
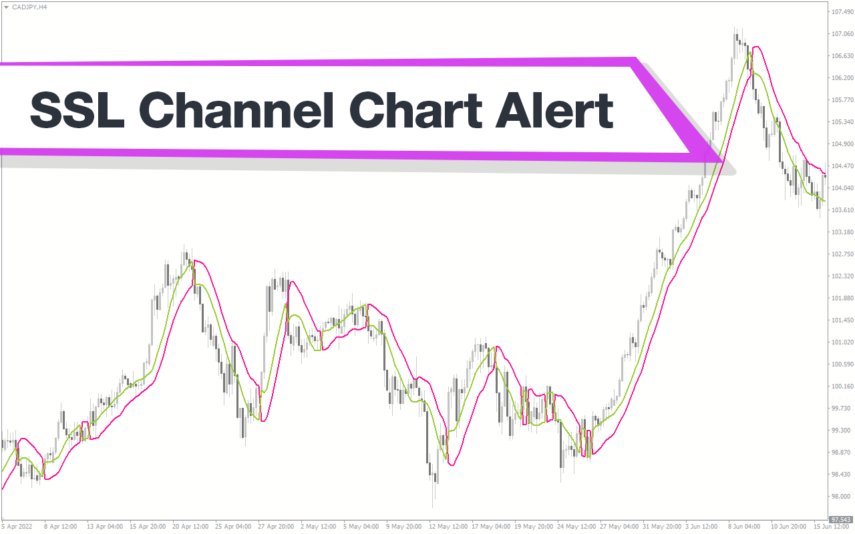
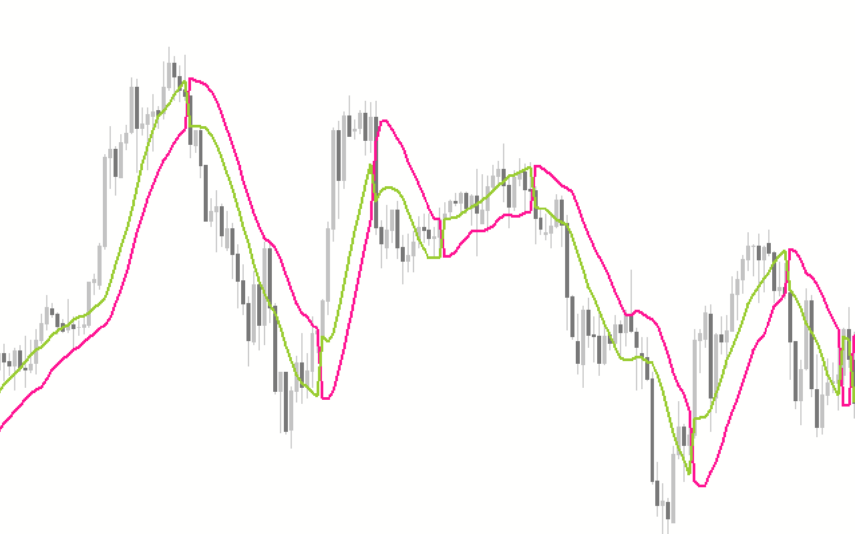
The SSL Channel Chart indicator is a useful and popular free Forex indicator for MT5. It is a technical indicator that helps traders to identify and analyze price movements. The indicator is composed of two lines, one that tracks the price action and the other that follows the trend. The two lines are drawn on a chart, and the price action is tracked in real time. The SSL Channel Chart indicator can be used to identify trend reversals, possible entry and exit points, and potential trading opportunities. It is also used to identify support and resistance levels, as well as potential breakouts. The indicator is designed to help traders to identify short-term and long-term trends, and to make informed trading decisions. It is a free indicator that is available to all MT5 users, and it is a great way to gain insight into the Forex market.
MT5


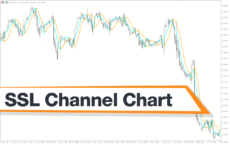
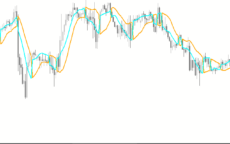
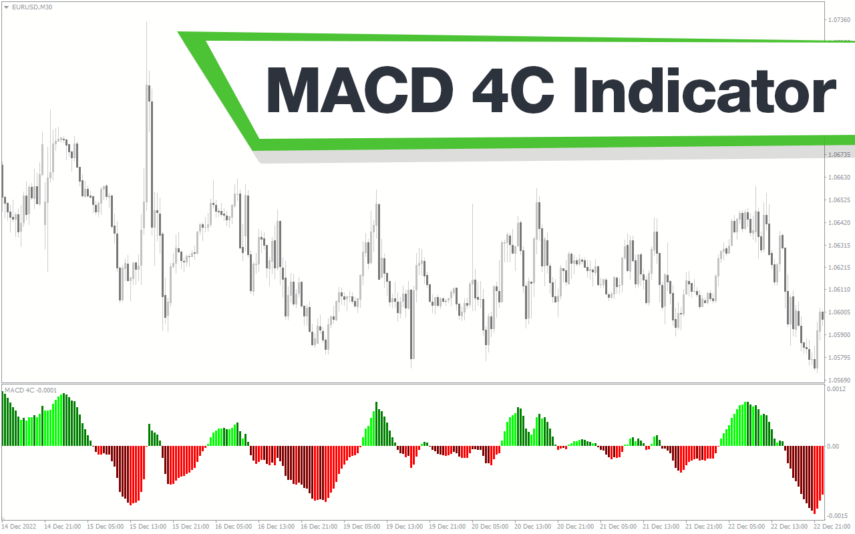
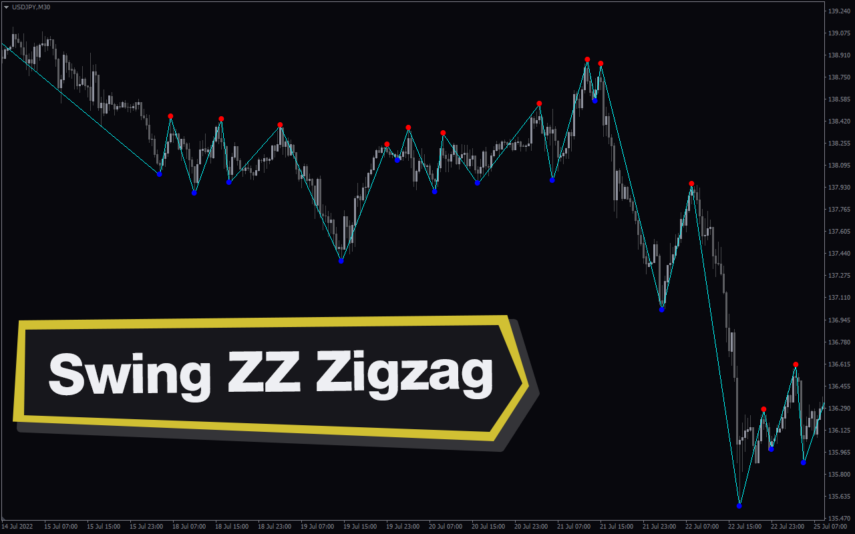
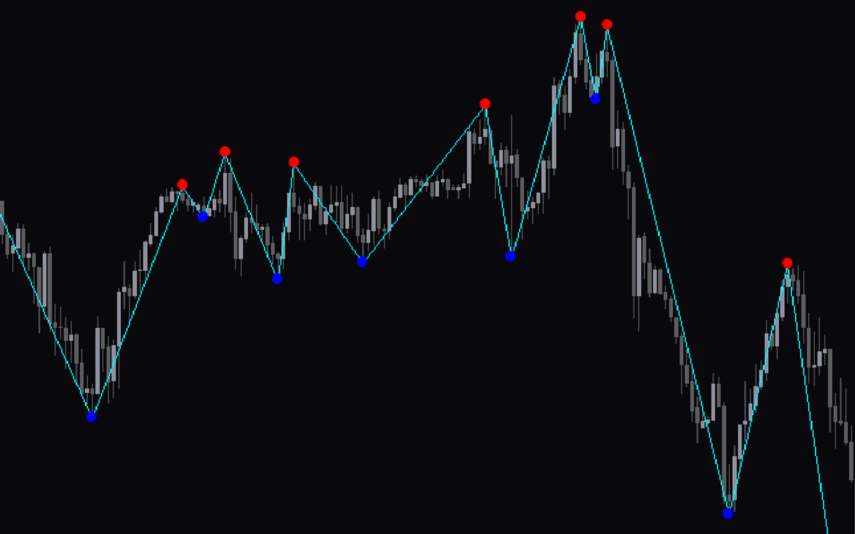
SSL Channel Chart
The SSL Channel Chart Forex Indicator is a popular and free MT5 indicator that is useful for traders looking to gain an edge in the Forex market. The indicator works by analyzing the price action of a given currency pair and plotting a channel on the chart. It can also be used with any time frame, making it a versatile and powerful tool for traders.
| Trading Style | , |
|---|---|
| Indicator Type | |
| Timeframe | , |
| Platform |
0
People watching this product now!
Downloads - 21
Description
Reviews (0)
How to Install
Related products
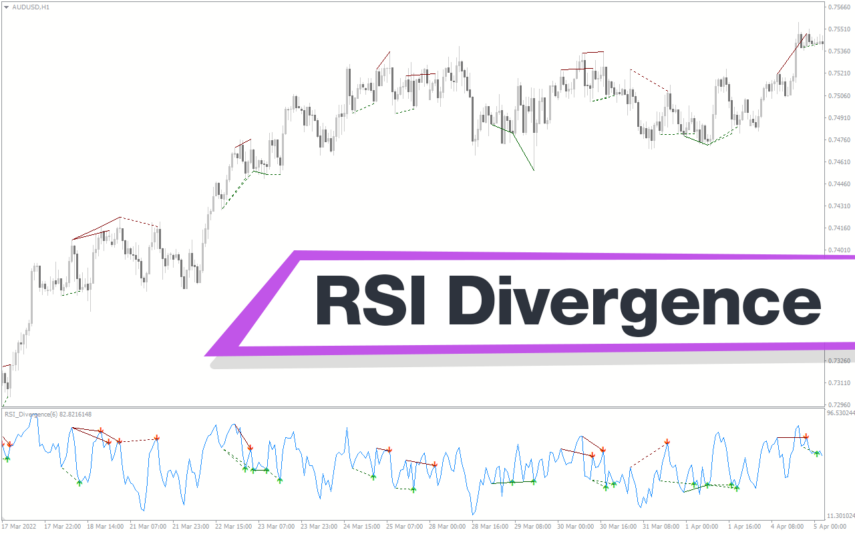
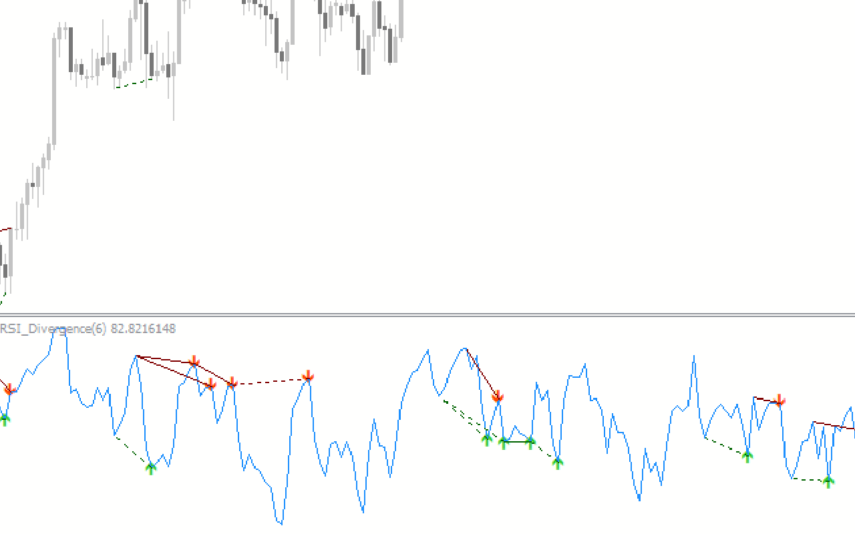
RSI Divergence
Enhance trading precision with the RSI Divergence indicator. Overcome signal challenges by leveraging divergence signals, which is vital for identifying potential market reversals. Customize settings, draw trendlines, and receive alerts for good trading decisions. Explore the power of the RSI Divergence indicator in assessing market conditions.
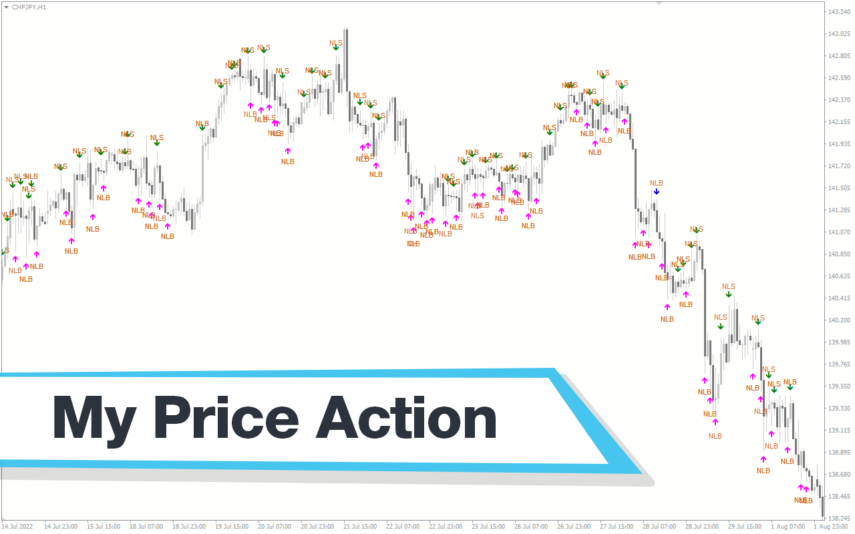
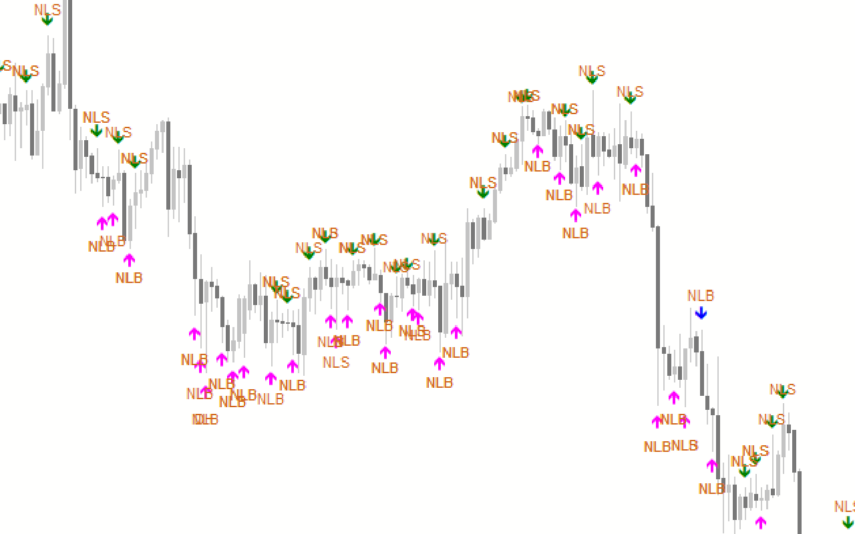
My Price Action
My Price Action Indicator is a nice and accurate forex trading indicator available for free on MT4 platrorm. This indicator uses historical price data to generate visual signals by highlighting support and resistance zones, trend lines, and chart patterns that can be used to make informed trading decisions. Whether you are a beginner or an experienced trader, My Price Action Indicator can provide valuable insights into the market to help you make profitable trades.
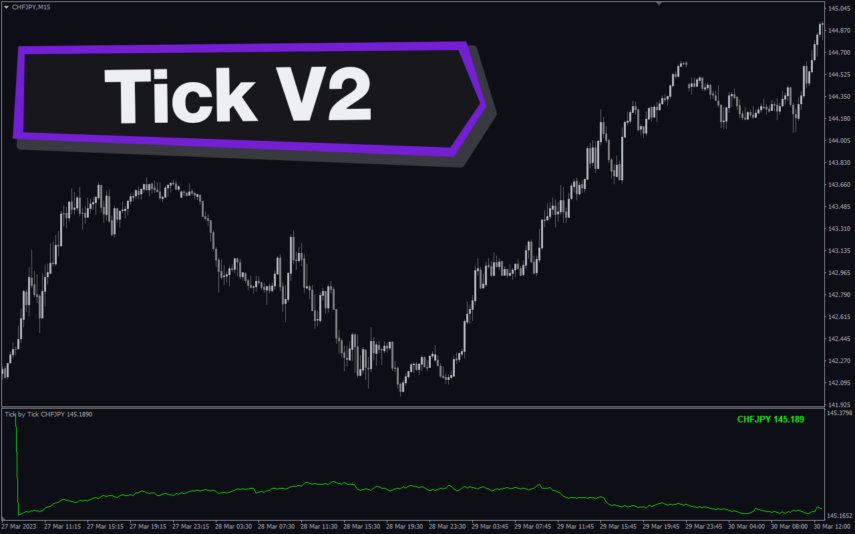
Tick V2
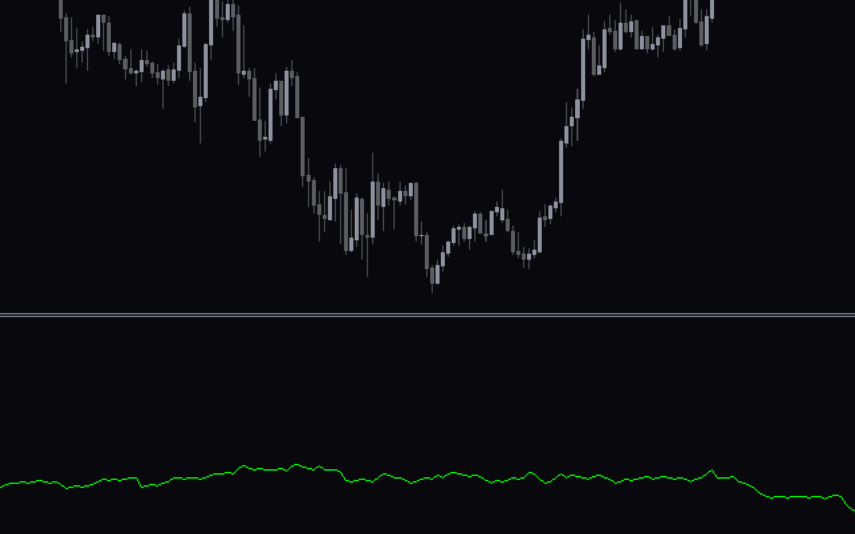
The Tick V2 Indicator is a new and popular forex indicator designed specifically for the MT4 platform. The green curved line in the indicator window represents the ticking line and shows the rise and fall of trading activities taking place every second, helping traders to determine the strength or weakness of the current market movement.
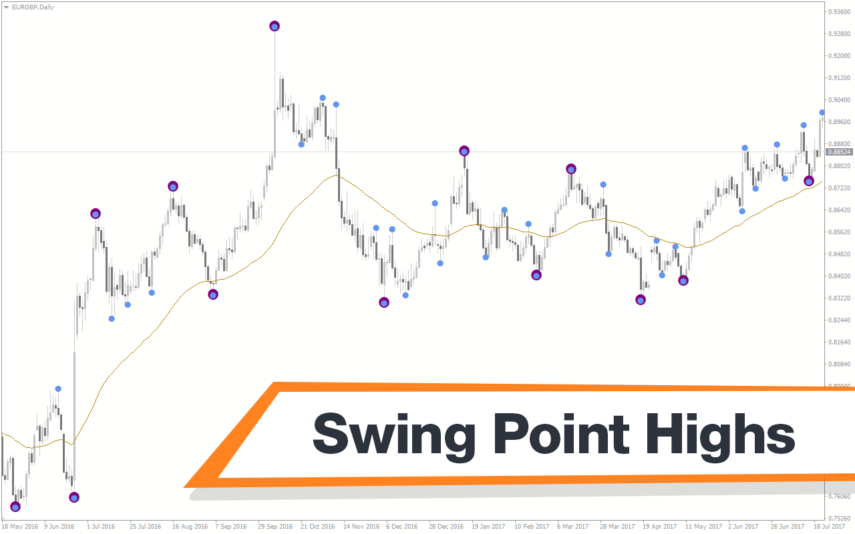
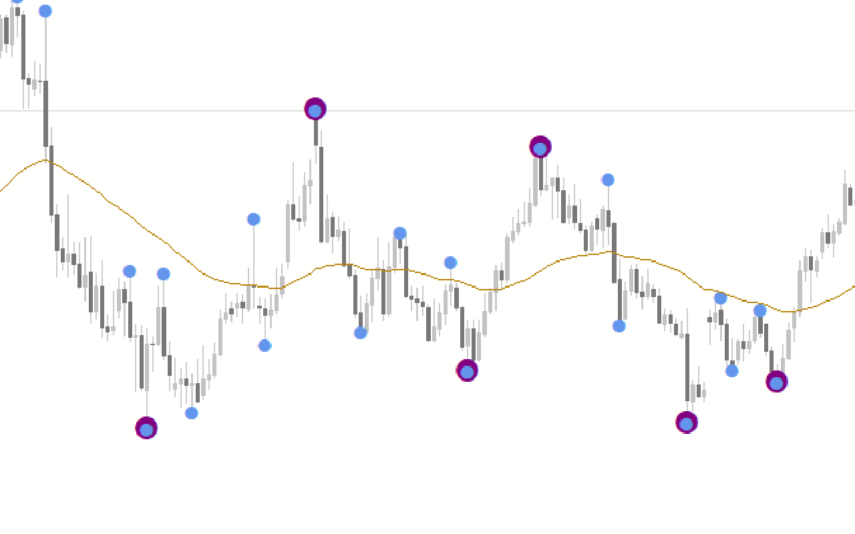
Swing Point Highs
The Swing Point Highs and Lows indicator is a new, popular and free MT4 technical analysis tool for forex traders. This indicator works by identifying swing points on a price chart and then drawing horizontal lines to indicate potential support and resistance levels. The swing point high and low indicator is a valuable tool for traders who want to identify key support and resistance levels and is suitable for both beginners and experienced traders.
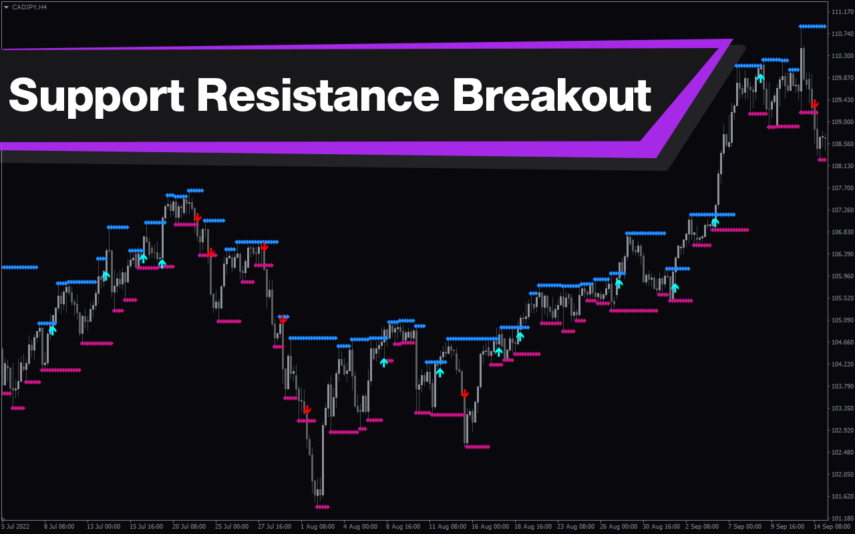
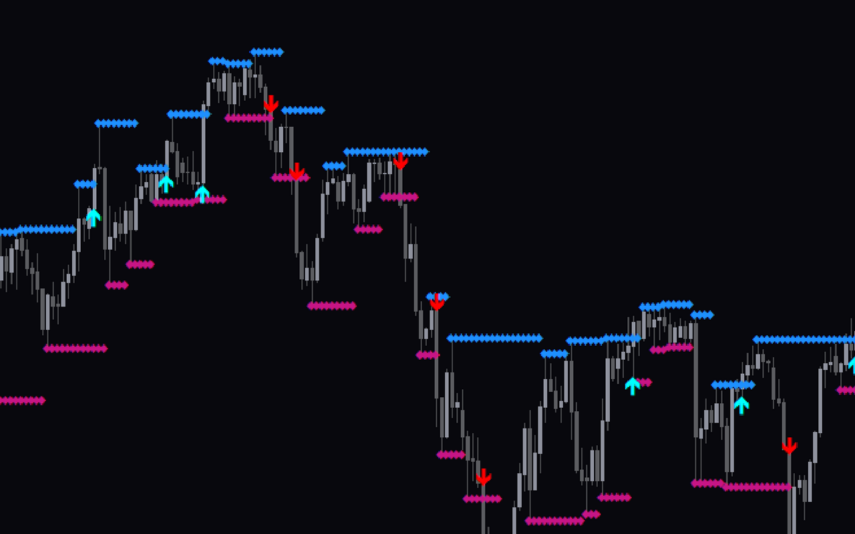
Support Resistance Breakout Arrows
Unlock profitable trading opportunities with the Support Resistance Breakout Arrows indicator for MT4. It generates precise buy and sell signals using Fractal, CCI, and RSI. The indicator also automatically marks significant support and resistance levels, helping in trend analysis. Benefit from clear entry signals, customizable settings, and compatibility across various time frames for daily and long-term traders.
Reviews
There are no reviews yet.