The market boasts numerous pattern formations, with Harmonic Patterns standing out for their remarkable accuracy and profitability. These patterns rely on Fibonacci ratios in geometric arrangements to pinpoint key areas – marking both reversal and continuation points that serve as reliable buy and sell signals.
Yet, identifying these patterns with the naked eye proves challenging. Additionally, manually drawing these patterns requires precision, given that different Fibonacci levels define seemingly similar patterns. This is where the Zup Harmonic indicator scans the chart to identify and display these patterns on the right side.
Unlike other indicators, the Zup Harmonic Pattern indicator goes further by predicting stop-loss and take-profit levels. It accommodates short-term and long-term trading strategies and relies on essential Fibonacci numbers for pattern recognition.
Harmonic patterns rank among the most lucrative patterns in forex trading, even though they occur relatively infrequently. The indicator’s accuracy in identifying these patterns removes the need for manual drawing, ensuring precise Fibonacci ratios. Thanks to this indicator, you only need to patiently wait for a complete pattern formation before entering the trend reversal direction.
Zup Harmonic Pattern Features
- The indicator draws complex patterns on the chart, which is useful for identifying trading opportunities.
- The indicator plots Fibonacci levels to help traders identify different chart patterns.
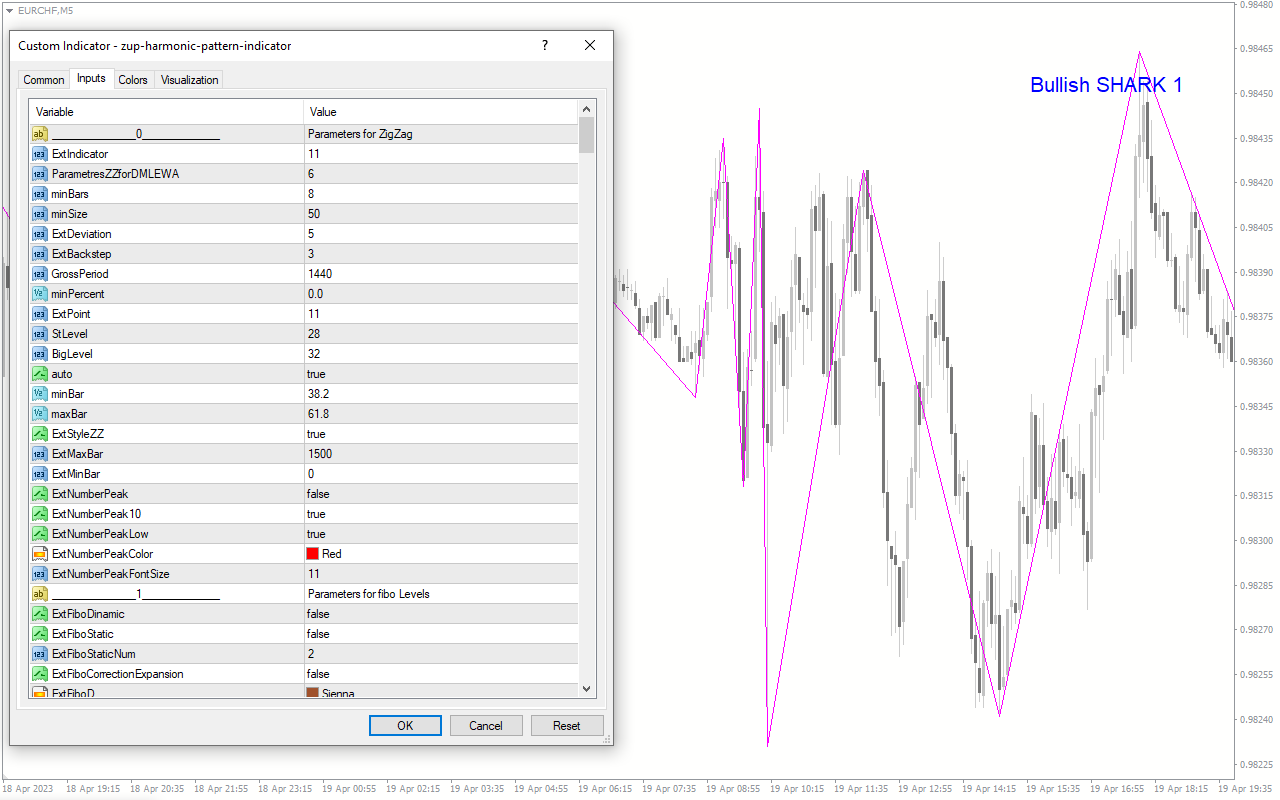
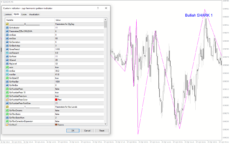
- It has numerous settings that allow traders to customize according to their preferences.
- It gives buy and sell signals when a pattern is complete.
Buy and Sell Strategies
Bullish Signal (Buy)
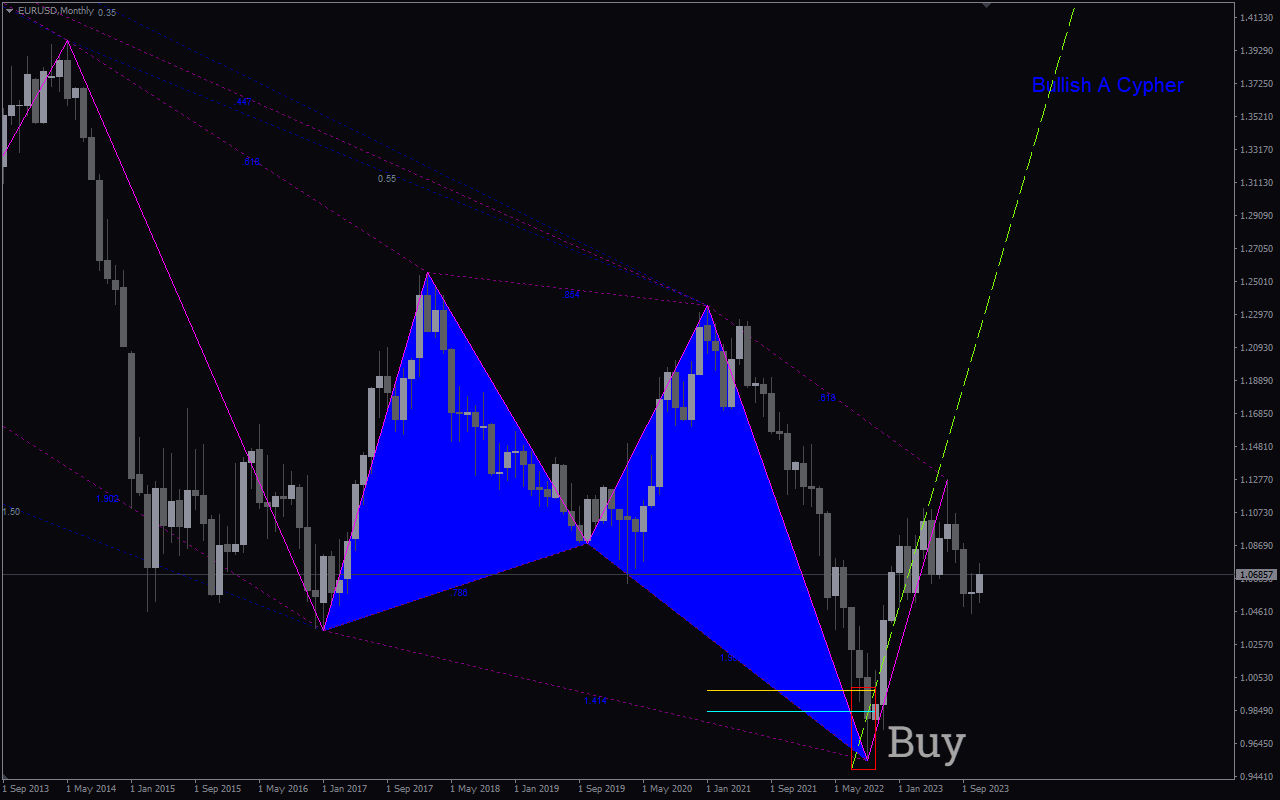
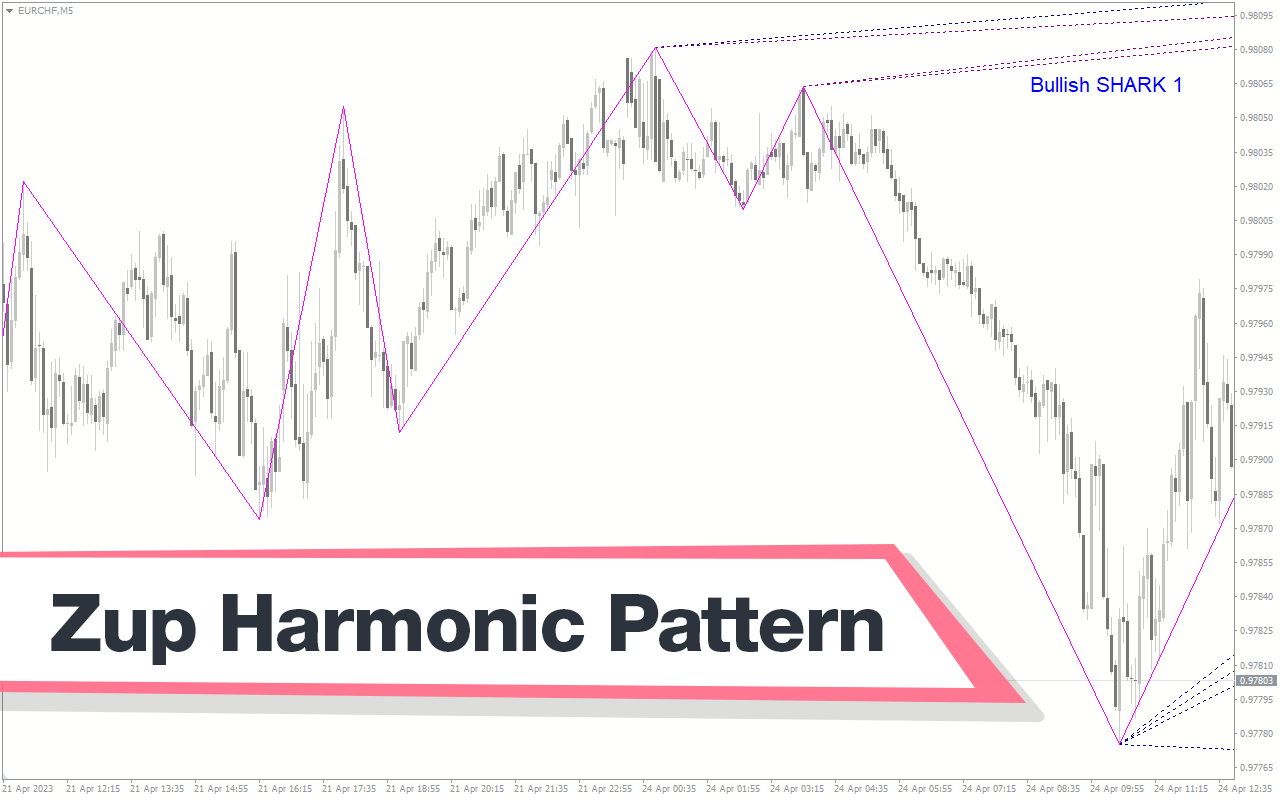
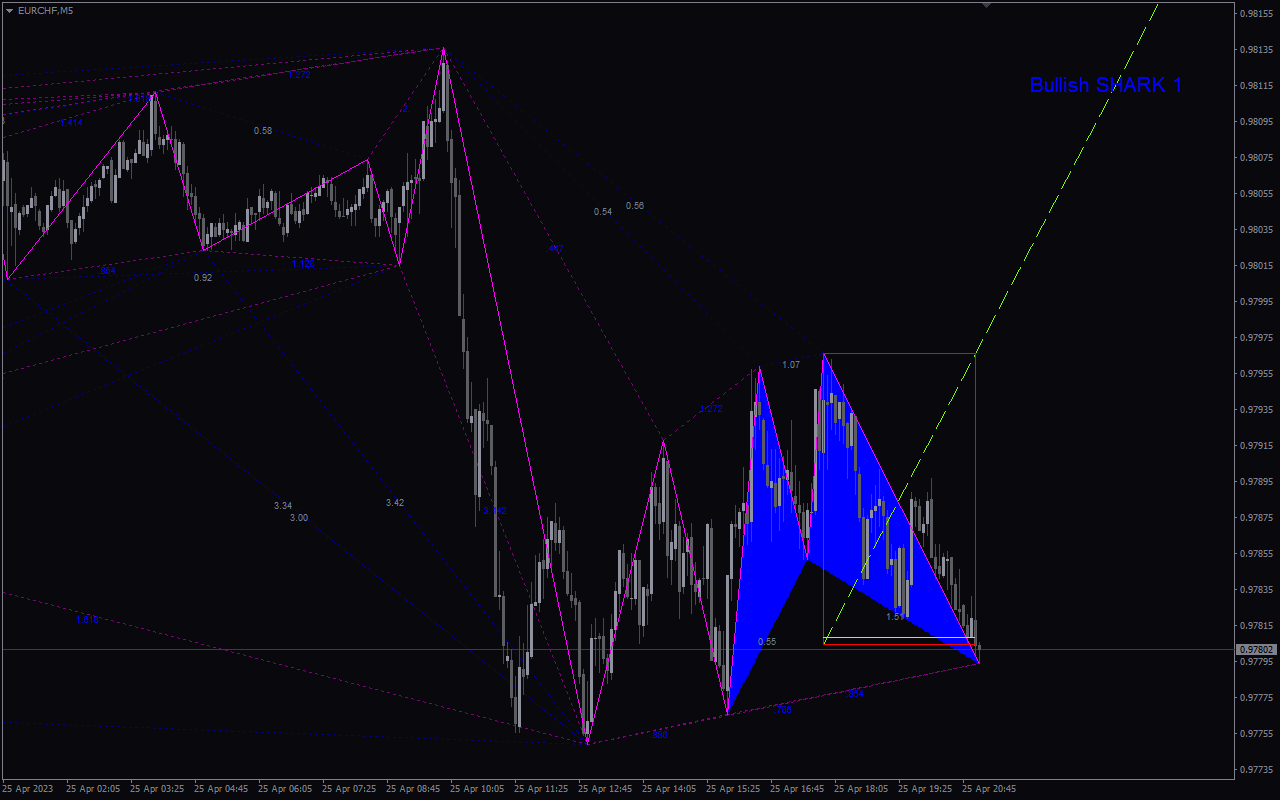
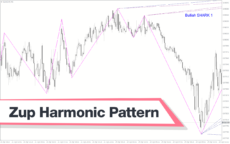
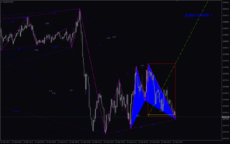
For a buy signal, wait for the indicator to create a bullish pattern. For instance, in the chart above, there is a bullish cypher pattern. Place your buy position when the price reverses, with your stop loss slightly below your entry.
Bearish Signal (Sell)
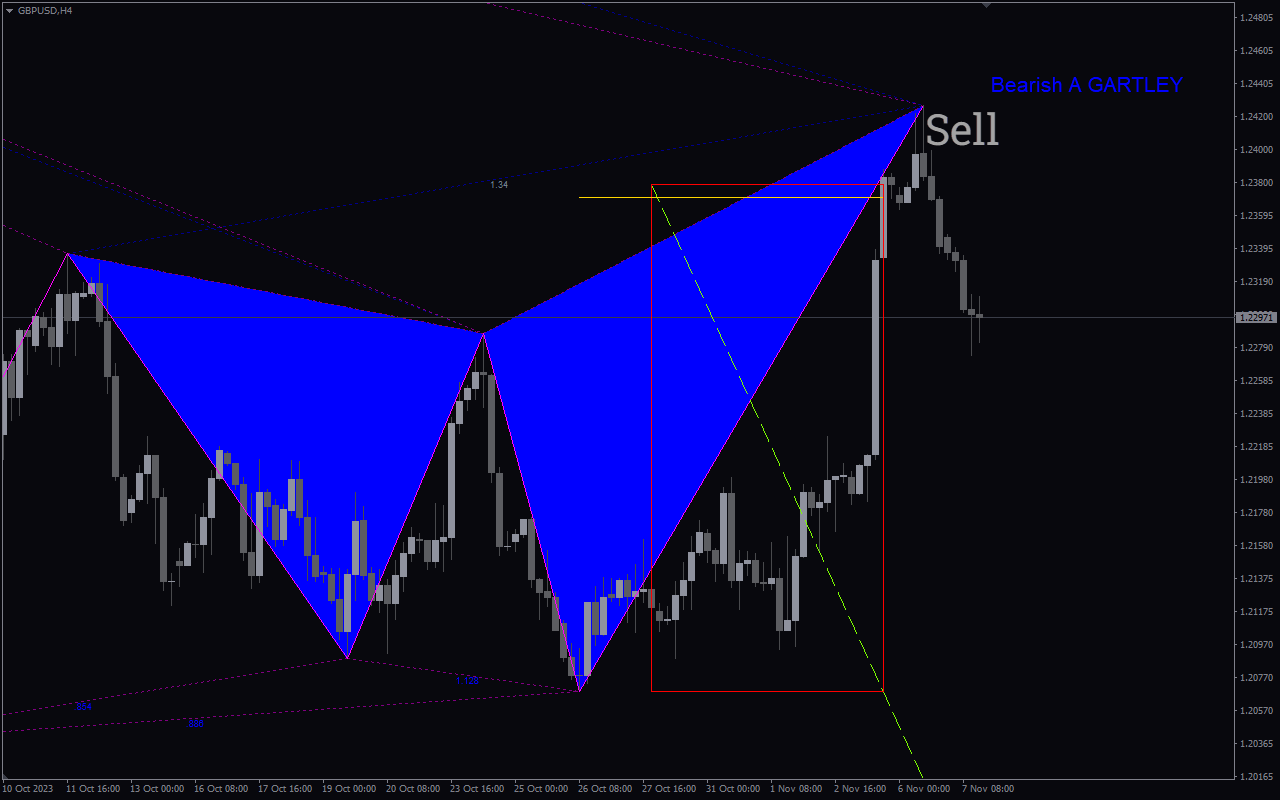
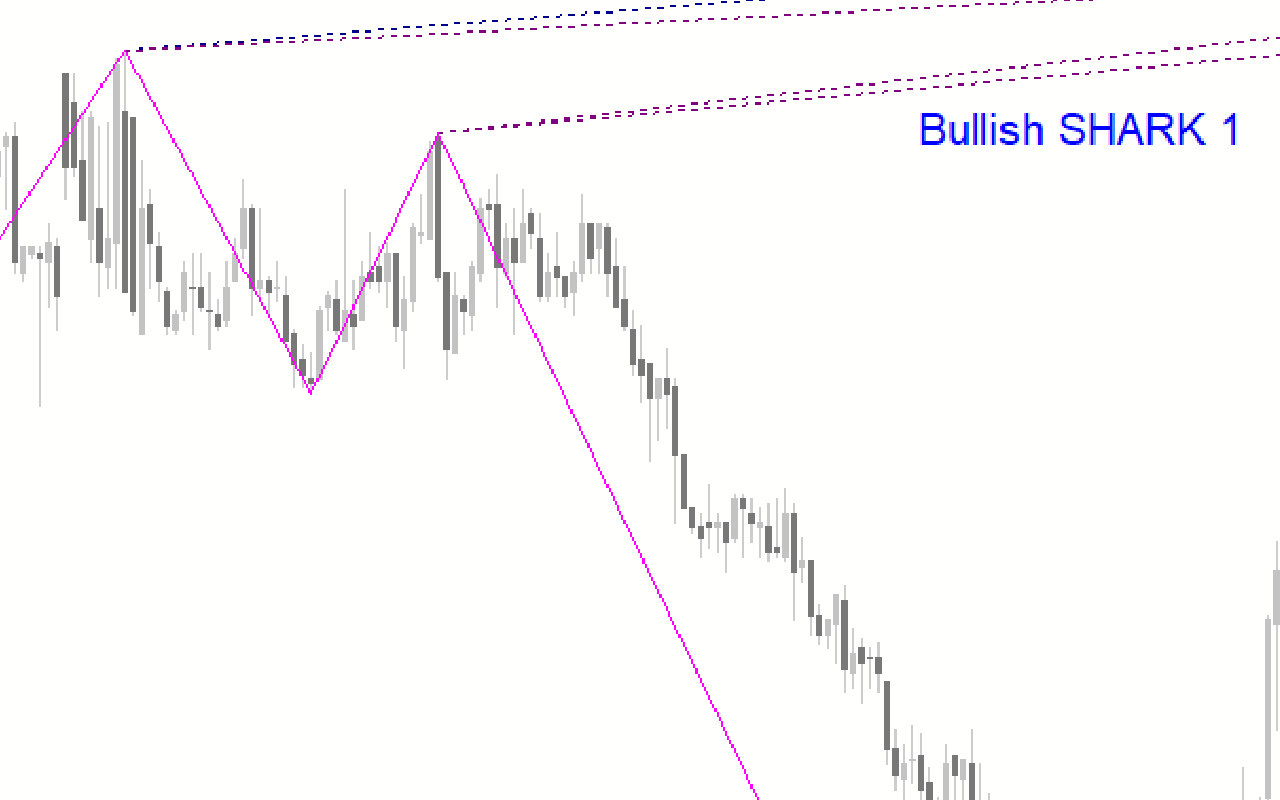
For a sell entry, wait for the indicator to create a bearish pattern. In the above chart, there is a bearish shark pattern. Place your sell entry when the pattern is completed and your stop loss slightly above your entry.
Exit strategy
Exit your trades depending on the patterns and Fibonacci levels. Depending on your risk-reward ratio, you can exit at the 0.382, 0.50, or 0.618 retracement levels.


Reviews
There are no reviews yet.