Features of the Candle Overlay Indicator
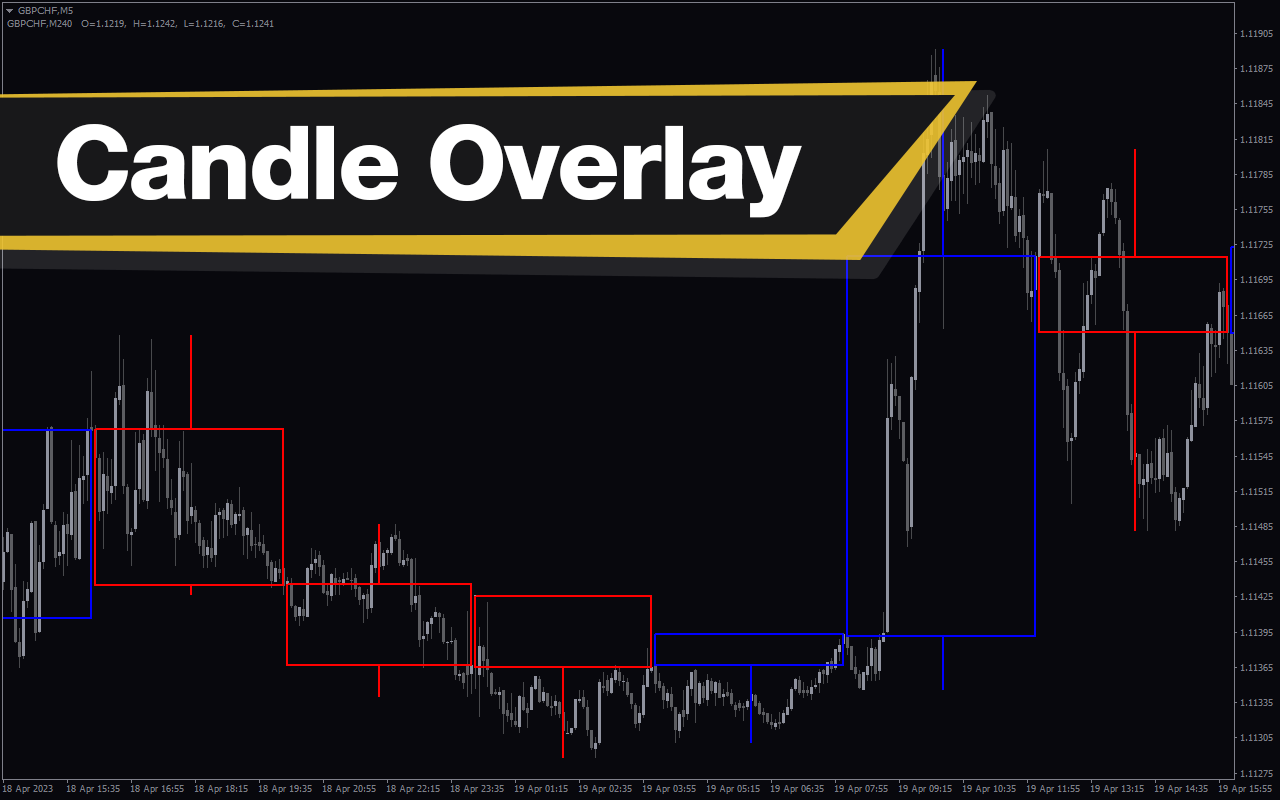
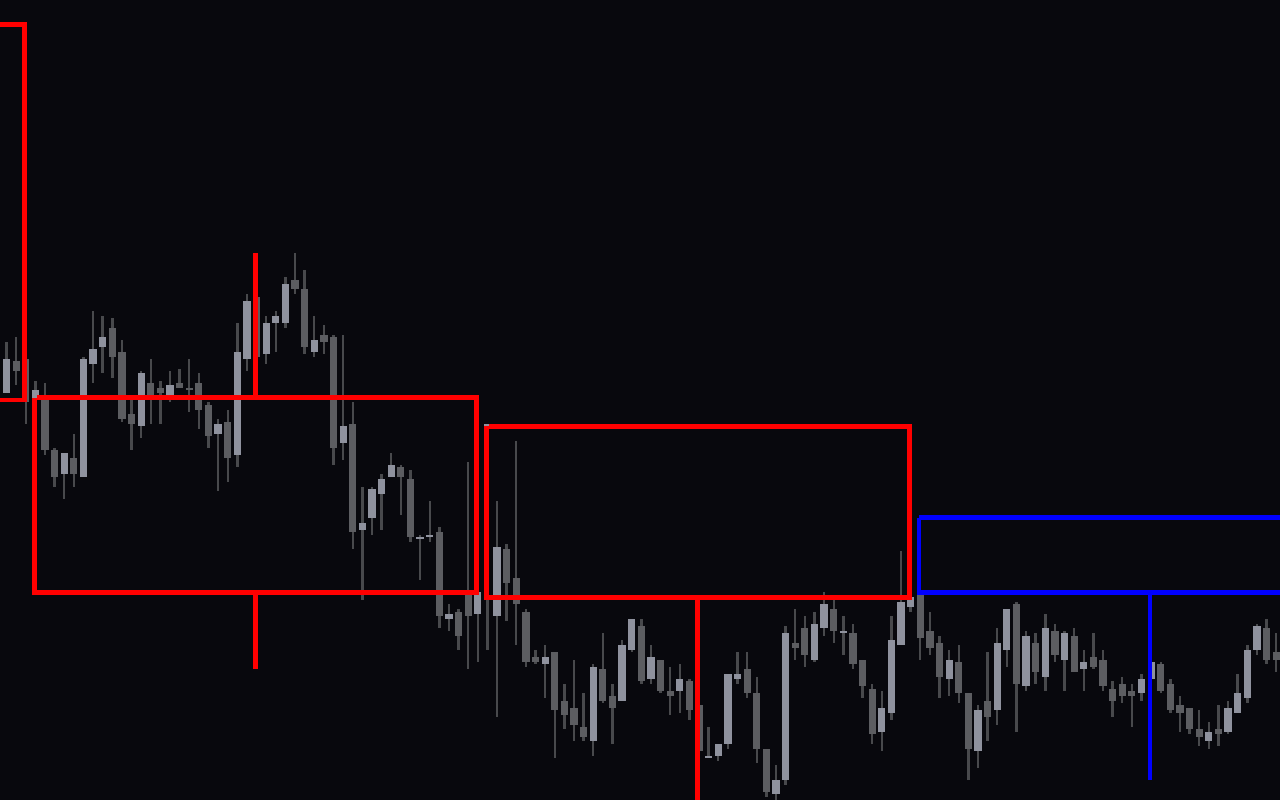
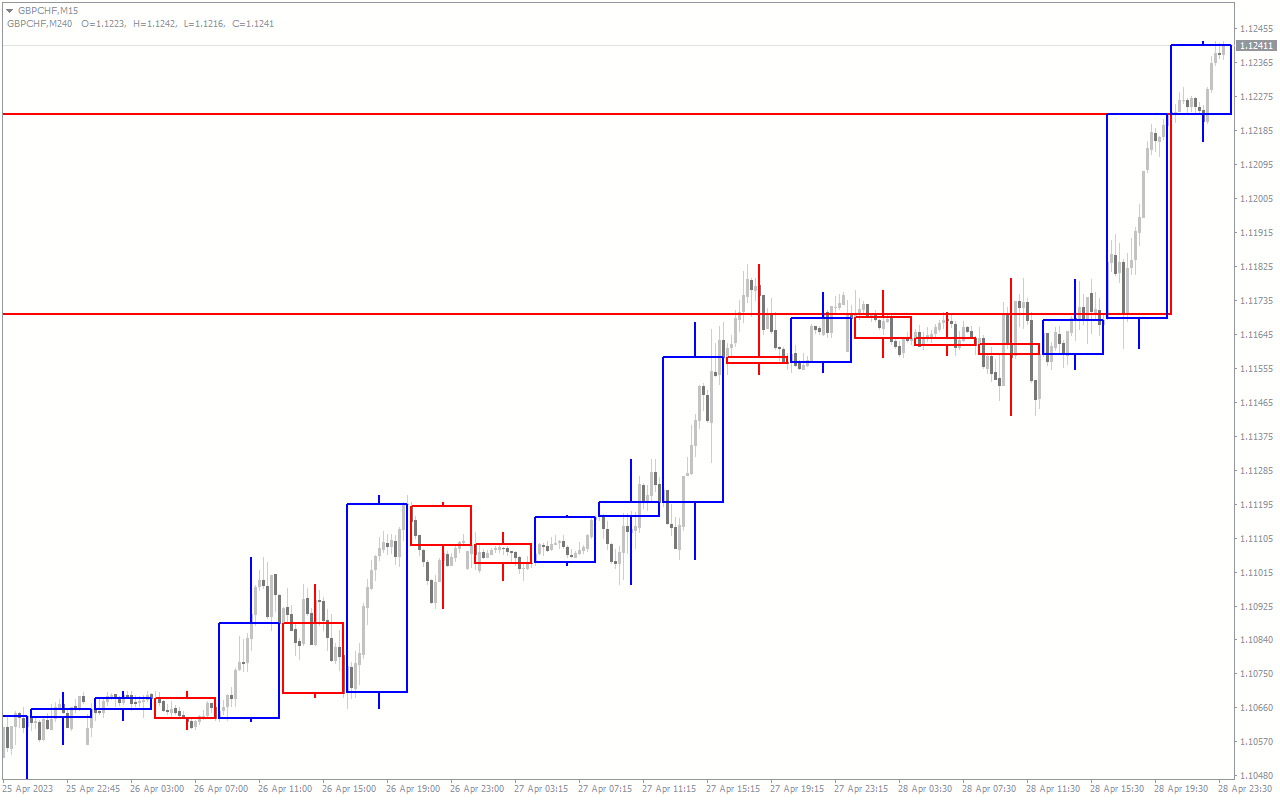
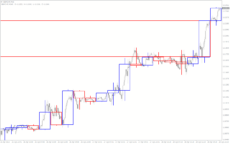
The Candle Overlay indicator overlays the candlesticks of higher time frames on a lower chart. The indicator is useful when conducting a top-down study of any trading instrument.
Essentially, it allows you to observe candlestick patterns of the 4-hour timeframe while on the 1-hour timeframe. This means that when viewing a 1-hour chart, you can see the body, wick, opening, and closing of a 4-hour candlestick. Consequently, the indicator eliminates the hassle of constantly alternating between various time frames while analysing the market.
The Candle Overlay MT4 indicator works best in the 4-hour timeframe and lower.
How the Indicator Can Benefit You
Using the Candle Overlay indicator when trading will make it easier to notice certain significant market levels over extended periods. With this information, you can predict how the price will respond as it approaches these key levels.
The Candle Overlay indicator can be used for trading swing, day, and scalping. The indicator can be used by new and seasoned traders (professionals). However, it would be more beneficial to seasoned traders because they know the significance of multi-timeframe analysis.
Indicator Setting Description
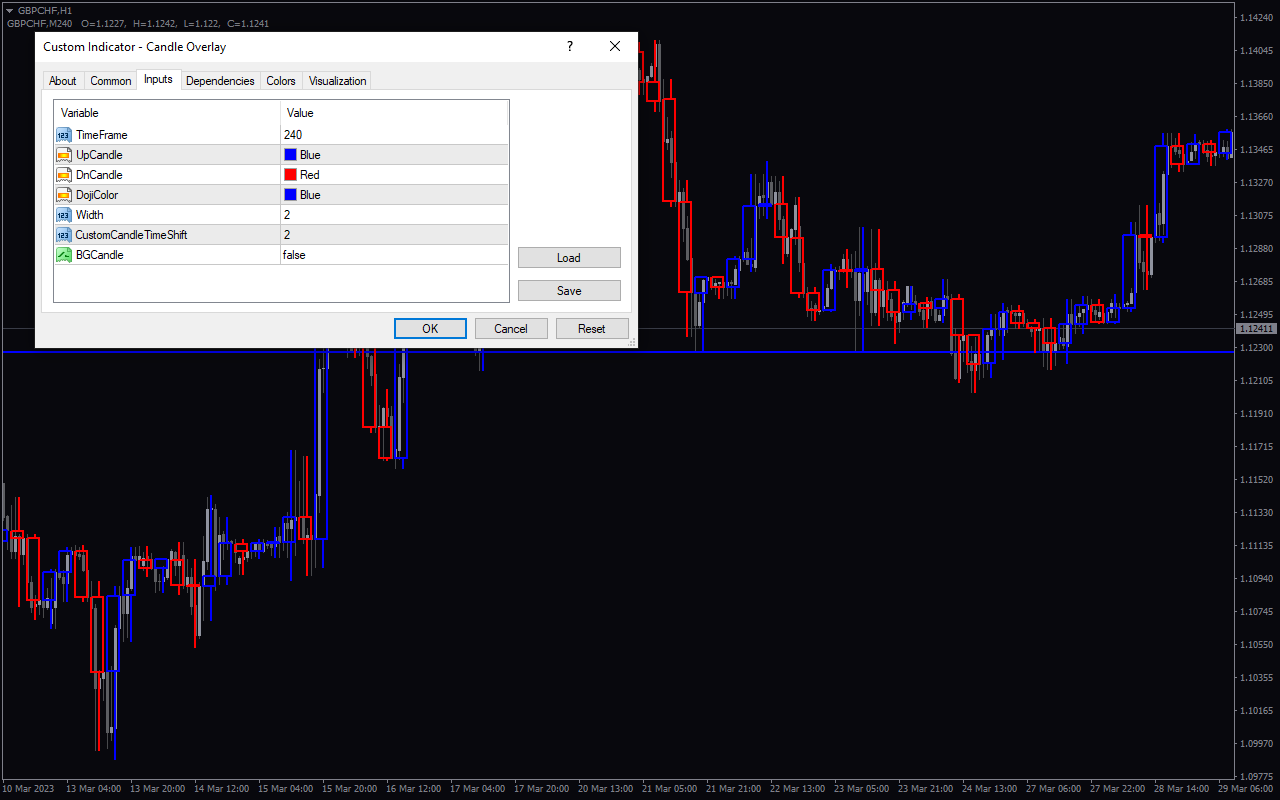
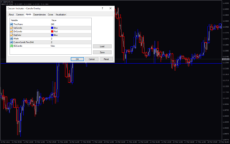
Time Frame: This input shows the higher time frame candlestick ( 240 minutes equals an H4 candle, etc.).
Up Candle: It allows you to select the colour of bullish candlesticks.
Dn Candle: It allows you to select the colour of bearish candlesticks.
Doji Color: It allows you to select the colour of all Doji candlesticks.
Width: This input shows the width of the candlestick.
Custom Candle Time Shift: You can change the time variable to form the candlestick.
BG Candle: This is used to define how a candlestick is displayed. This includes hollow candlesticks or solid candlesticks.

Reviews
There are no reviews yet.