• MT4 Collections
    • Top Indicators Hot
      • Top Rated
      • Top Downloads
      • Most Popular
      • New
      • Recommended
    • Trading Style
      • Beginner For Newbies
      • Scalping
      • Short-Term
      • Day Trading
      • Intraday
      • Swing
    • Indicator Type
      • Accurate
      • Leading
      • Reversal
      • Breakout
      • Sideways
      • Entry & Exit
      • Overbought & Oversold
      • Non-Repaint
    • Categories
      • Trend
      • Signal
      • Support & Resistance
      • Price Action
      • Stochastic
      • Envelope
      • Volume
      • Helpers
    • Timeframes
      • M1-M5
      • M15-M30
      • H1-H4
      • D1-W1
      • Multi Timeframe
    • Platform
      • MT4 Popular
      • MT5
  • Indicators
  • Blog
  • CONTACT US
  • ABOUT US
Menu
Search
Select category
  • Select category
  • Envelope Indicators
  • Helpers
  • Price Action
  • Signal
  • Stochastic
  • Support & Resistance
  • Trend
  • Volume
0 Wishlist
Home Collection Stochastic Absolute Strength
Profit Indicator
Back to products
Elliott Wave Oscillator
MT4
Watch video
Click to enlarge

Absolute Strength

The Absolute Strength Indicator is a popular and free MT4 Forex indicator that is useful for traders of all levels. It is designed to measure the strength of a currency pair in relation to other currency pairs in the Forex market. The indicator works by analyzing the price action of each currency pair and producing a signal when the strength of one currency pair is greater than that of another. It is one of the most popular and widely used Forex indicators available, and it is free to download and use.

Trading Style

Day Trading

,

Intraday

Indicator Type

Entry Exit

Timeframe

H1-H4

,

M15-M30

Platform

MT4

Add to wishlist
0 People watching this product now!
Category: Stochastic
Share:

Downloads - 98

Download now
  • Description
  • Reviews (0)
  • How to Install
Description

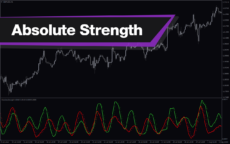
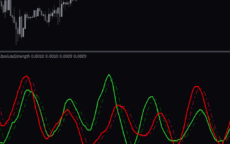
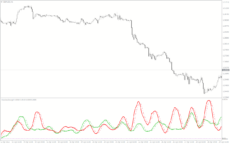
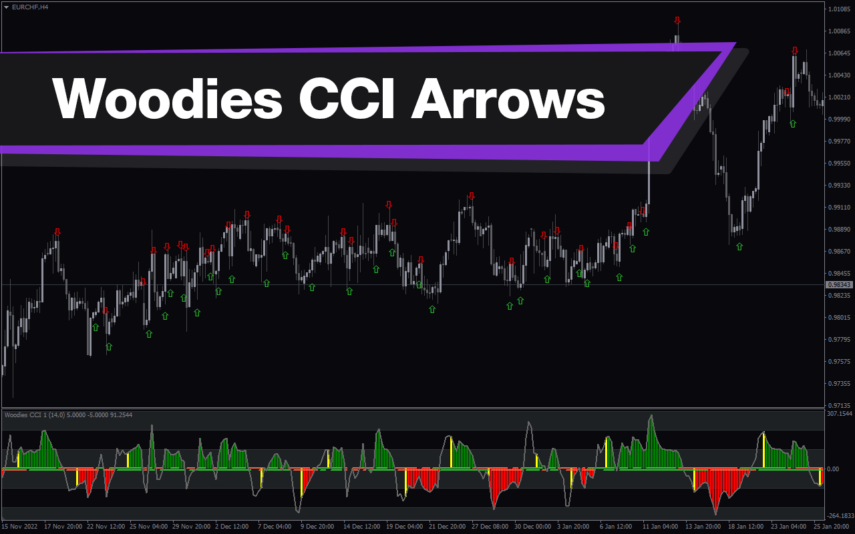
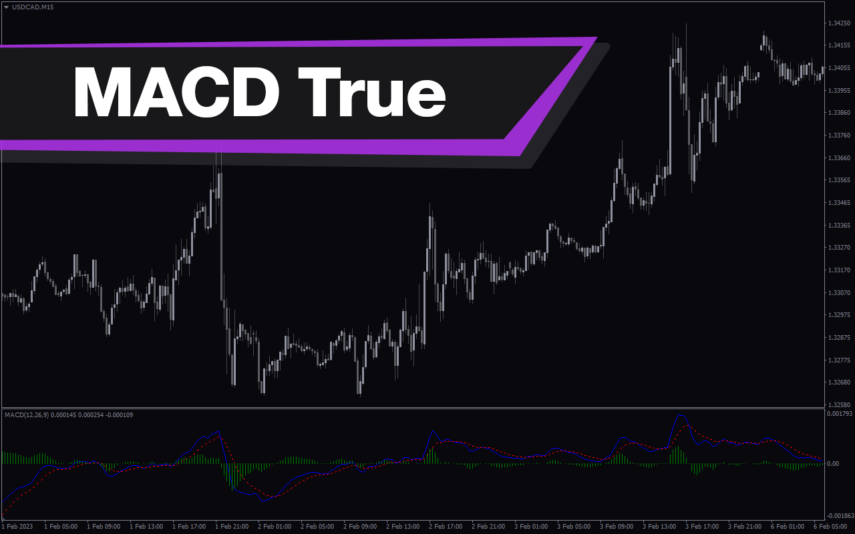
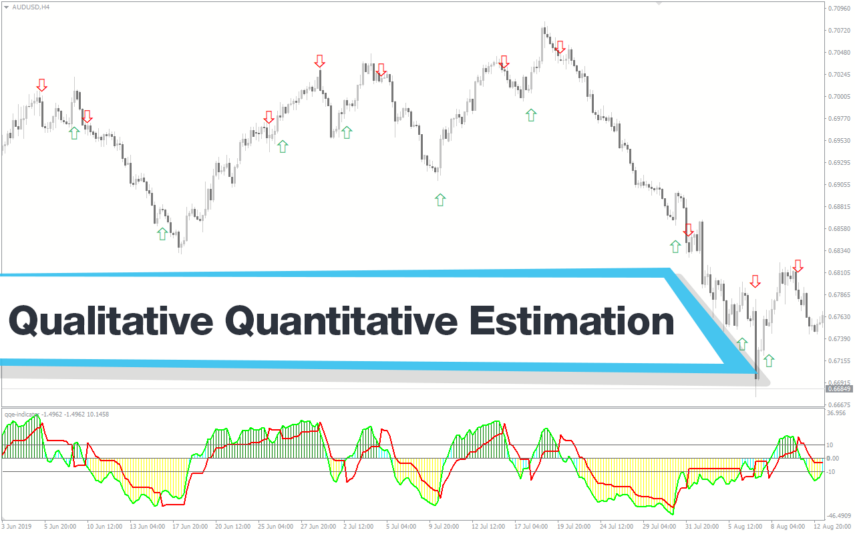
The Absolute Strength Indicator (ASI) is a widely used and free MT4 forex indicator that provides traders with valuable insights into the strength of a currency pair. It enables traders to assess the relative strength of a currency pair based on its current price compared to its historical price movements. By calculating a score that reflects the strength of the currency pair, the ASI helps traders identify potential opportunities in the forex market. A high score suggests that the currency pair is strong relative to its past performance, while a low score indicates weakness. The ASI also offers visual cues in the form of a red and green line, where the positioning and distance between the lines reflect the strength of the trend.

Features of the Indicator

The Absolute Strength Indicator offers several key features that make it a valuable tool for forex traders. Firstly, it uses historical price data to calculate the current strength of a currency pair. By comparing the current price to past performance, the ASI provides a quantitative measure of the currency pair’s strength.

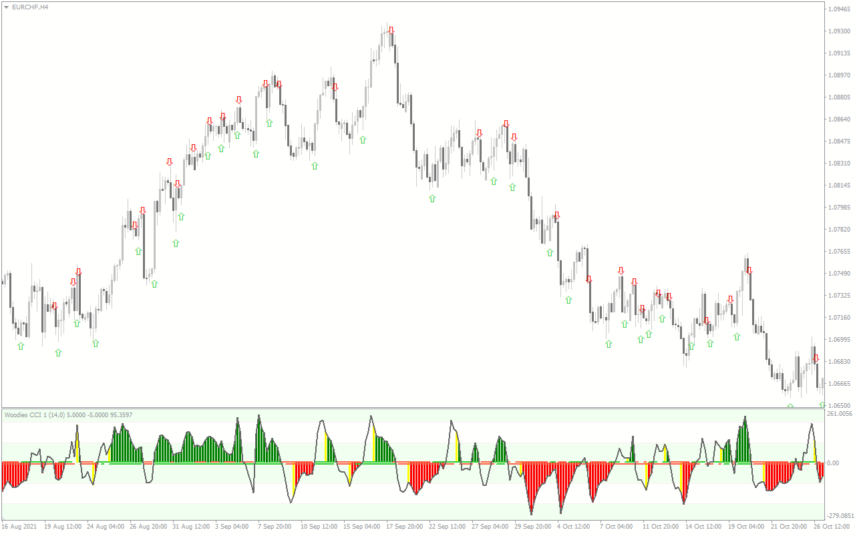
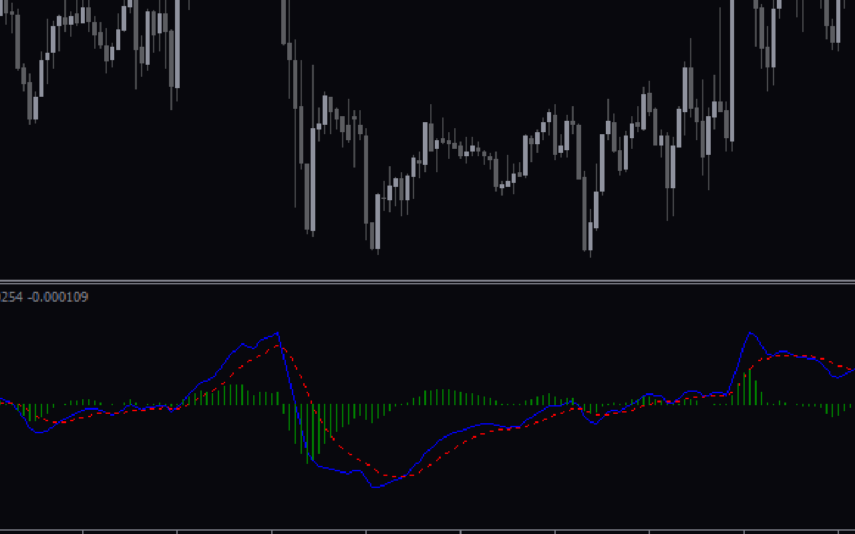
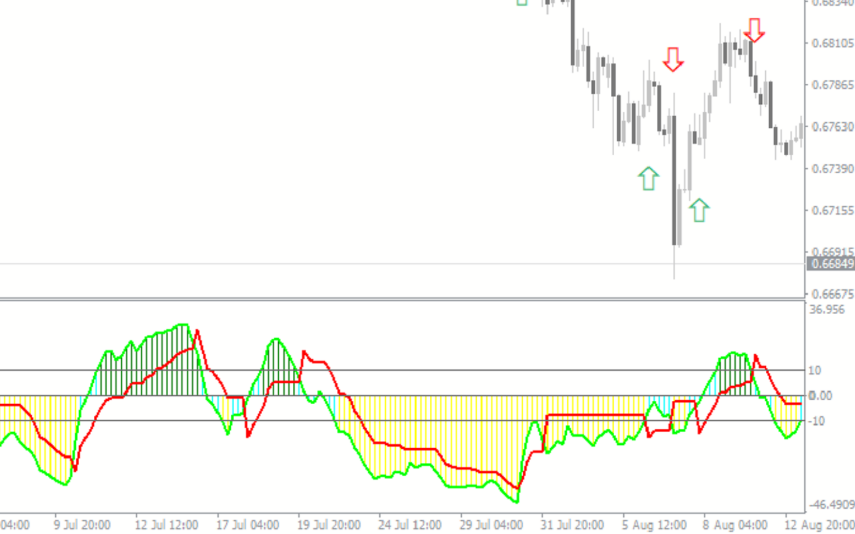
Additionally, the ASI incorporates visual components in the form of a red and green line. The positioning of these lines and the distance between them provide further insights into the strength of the trend. If the red line is above the green line, it signifies a bearish trend, while the green line above the red line indicates a bullish trend. The distance between the lines reflects the strength of the trend, with a greater distance indicating a stronger trend.

Furthermore, the ASI’s ability to assess the strength of the trend provides valuable information when making trading decisions. Traders can use the indicator to identify potential entry and exit points based on the strength or weakness of the currency pair.

How the Indicator Can Benefit You

The Absolute Strength Indicator offers several benefits to forex traders. Firstly, it helps traders identify the strength of a currency pair relative to its historic performance. This knowledge allows traders to focus on currency pairs that show strong potential for profitable trades.

Secondly, the visual cues provided by the ASI, in the form of the red and green lines, assist traders in understanding the current trend direction. By visually observing the positioning and distance between the lines, traders can easily identify whether the trend is bullish or bearish and evaluate the strength of the trend.

Moreover, the indicator serves as a valuable tool for confirming signals and trade setups. By incorporating the ASI into their trading strategy, traders can gain additional confirmation for their trading decisions, increasing the probability of successful trades.
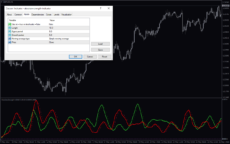
Indicator Settings

The first setting allows you to select whether the Absolute Strength Indicator will be calculated using RSI (Relative Strength Index) or Stochastic oscillator.

Length: This represents the primary period used for the indicator calculation.

Signal period: Specifies the period used for the signal line. A smaller value will result in the signal line being closer to the main solid line.

Smooth period: This parameter determines the period used for smoothing the main line.

Moving average type: You can choose from five different types of moving averages.

Price: Absolute Strength can be calculated based on different price types, including Heiken Ashi.

Conclusion

In conclusion, the Absolute Strength Indicator is a powerful technical tool that aids forex traders in assessing the strength of currency pairs. With its ability to calculate and provide a score based on historical price data, along with visual cues depicting trend strength, the ASI offers valuable insights into the forex market. By incorporating the Absolute Strength Indicator into your technical analysis, you can make more informed trading decisions and improve your overall trading performance.

Reviews (0)

Reviews

There are no reviews yet.

Be the first to review “Absolute Strength” Cancel reply

Your email address will not be published. Required fields are marked *

1 2 3 4 5
1 2 3 4 5
1 2 3 4 5

How to Install

How install MT4/5 indicator in the terminal?

To install an MT4/5 indicator in the terminal, follow these steps:

  1. Download the indicator file (.ex4 or .mq4/.ex5 or .mq5) to your computer.

  2. Open the MT4/5 terminal and click on “File” in the top left corner.

  3. Select “Open Data Folder” from the dropdown menu.

  4. In the window that opens, double-click on the “MQL4/5” folder.

  5. Double-click on the “Indicators” folder.

  6. Drag and drop the indicator file from your computer into the “Indicators” folder.

  7. Close the data folder window and restart the MT4/5 terminal.

  8. The indicator should now be available in the “Navigator” window on the left-hand side of the terminal. Simply double-click on the indicator to add it to a chart.

Note: If the indicator is in a .zip file, you will need to extract it first before following the above steps.

And if asks to confirm DLL?

If the indicator you are installing requires access to external Dynamic Link Libraries (DLLs), you may see a pop-up message asking you to confirm the use of DLLs.

DLLs are external libraries that contain code that can be used by other programs. In the case of MT4/5 indicators, they are often used to perform complex calculations or connect to external data sources.

If you trust the source of the indicator and want to use it, click “Yes” to confirm the use of DLLs. If you are not sure or do not trust the source, click “No” to cancel the installation.

It’s worth noting that some indicators may not work properly without access to their required DLLs. If you choose not to allow access to DLLs and the indicator does not work as expected, you may need to reinstall the indicator and confirm the use of DLLs to get it to work properly.


Related products

MT4
Quick view
Add to wishlist

CCI Divergence

Signal, Stochastic
The CCI Divergence Indicator for MT4 is a useful and popular free Forex indicator. It is used to identify potential reversals in the market by looking for divergences between price and the Commodity Channel Index (CCI). The indicator uses the CCI to determine when the market is overbought or oversold and when the trend is likely to reverse. It will then plot a divergence line on the chart to indicate potential reversal points. The CCI Divergence Indicator for MT4 is a great tool for traders of all levels and can be used to help traders make more informed decisions.
MT4
Quick view
Add to wishlist

Woodies CCI Arrows Oscillator

Signal, Stochastic
The Woodies CCI Arrows Oscillator Indicator is a popular MT4 technical analysis tool used by forex traders to identify trends and potential entry and exit points wich based on the Woodies CCI system, which helps traders to identify when a trend is strong and when it may be weakening. The arrows on the indicator show when the price is moving in a particular direction, and the oscillator provides additional confirmation of the trend's strength. The Woodies CCI Arrows Oscillator Indicator is a valuable addition to any trader's toolkit, and it can help traders make better-informed trading decisions.
MT4
Quick view
Add to wishlist

Pullback Factor

Stochastic
Pullback Factor Indicator is a popular and new trend-following indicator designed for use in the forex market. It helps you to identify the end of a trend retracement and the resumption of the trend. With its unique algorithm, the indicator predicts the extent of a trend pullback, enabling traders to enter the market with precision and accuracy.
MT4
Quick view
Add to wishlist

MACD True

Stochastic
The MACD True Indicator is a popular and useful MT4 forex indicator that helps traders identify trends and momentum in the market. It is a modified version of the traditional MACD indicator that incorporates a color-coded histogram to provide more visual cues for traders. This indicator works by measuring the difference between two moving averages, and it is often used in conjunction with other technical indicators to confirm trading signals. Traders of all levels can benefit from using the MACD True Indicator in their trading strategies.
MT4
Quick view
Add to wishlist

Commodity Channel Index

Stochastic
The Commodity Channel Index (CCI) is a popular and useful Forex indicator used by many traders. It is a technical indicator that measures the momentum of price movements and helps to identify when a currency pair is overbought or oversold. It is easy to use and can help traders identify potential trading opportunities. The indicator is free to use on the MT4 trading platform and is one of the most popular indicators used by traders.
MT4
Quick view
Add to wishlist

Volatility Quality

Signal, Stochastic
The Volatility Quality Indicator is a useful and popular free Forex indicator for MT4 that helps traders identify the best entry and exit points in the market. This indicator is based on the ratio of the price range of a given period to the average true range of the same period. It helps traders determine the quality of the volatility of a currency pair. It is also a great tool for identifying support and resistance levels. The Volatility Quality Indicator is a great way to make informed decisions when trading Forex.
MT4
Quick view
Add to wishlist

Currency Pairs Correlation

Stochastic
The Currency Pairs Correlation indicator is a free and popular tool for forex traders available on MT4 platform. It shows the correlation between various currency pairs, helping traders identify potential trading opportunities and manage their portfolio risk. The indicator calculates correlation coefficient between selected currency pairs and displays it as a color-coded matrix. The Currency Pairs Correlation indicator can be used by both novice and experienced traders to get a better understanding of market dynamics and make more informed trading decisions.
MT4
Quick view
Add to wishlist

Qualitative Quantitative Estimation

Signal, Stochastic
The Qualitative Quantitative Estimation Indicator is a powerful tool for traders in the Forex market. It's a new and popular indicator that works with the MT4 platform. The QQE Indicator is used to determine market trends, identify overbought and oversold positions, and detect divergence in prices and momentum.
    Close
    Indicator Categories
    • Envelope Indicators 303
    • Helpers 405
    • Price Action 165
    • Signal 1110
    • Stochastic 1675
    • Support & Resistance 558
    • Trend 890
    • Volume 145
    Recently Viewed Products
    • Fiji Trend
    • Trend Finder
    • MT4 COLLECTION HOT
      • Top Rated
      • Top Downloads
      • Most Popular
      • New
      • Recommended
    • Trading Style
      • Beginner For Newbies
      • Scalping
      • Short-Term
      • Day Trading
      • Intraday
      • Swing
    • INDICATOR TYPE
      • Accurate
      • Leading
      • Reversal
      • Breakout
      • Sideways
      • Entry & Exit
      • Overbought & Oversold
      • Non-Repaint
    • CATEGORIES
      • Trend
      • Signal
      • Support & Resistance
      • Price Action
      • Stochastic
      • Envelope
      • Volume
      • Helpers
    • Timeframe
      • M1-M5
      • M15-M30
      • H1-H4
      • D1-W1
      • Multi Timeframe
    • Platform
      • MT4 Popular
      • MT5
    • USEFUL LINKs
      • Privacy Policy
      • Cookie Policy
      • Terms of Use
      • Disclaimer
      • About Us
      • Contact Us
    Logo-grayscale-transparent-720
    Unlock your trading potential with our powerful indicator library.

    Follow us:

    MT4COLLECTION.COM © 2024 All Rights Reserved.
    • Menu
    • Categories
    • Signal
    • MT4 Collections
    • Collection
    • Blog
    • About us
    • Contact us
    • Wishlist
    Get Sentiment Indicators with 70% OFF. Only on Black Friday! View Offer Only till DEC, 2
    Sidebar
    We use cookies to improve your experience on our website. By browsing this website, you agree to our use of cookies.
    Accept