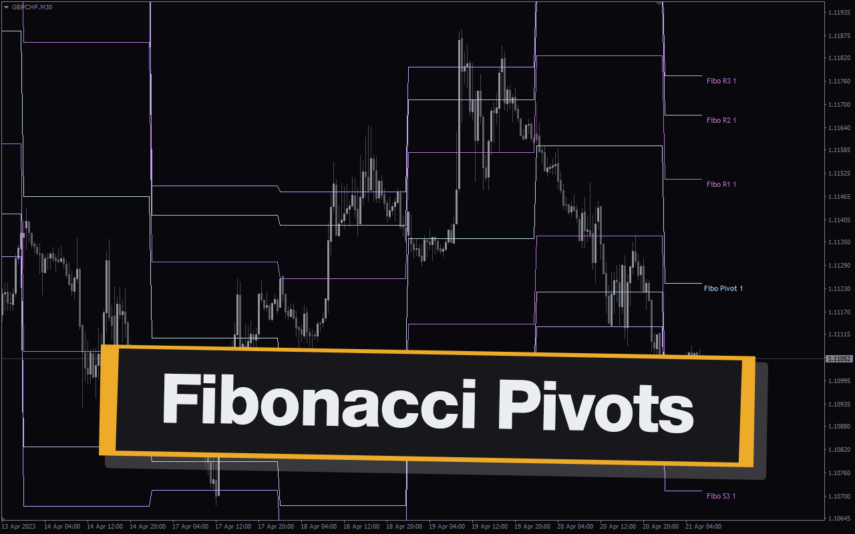
The Fibo Pivot V2 MT5 indicator calculates the pivot and three support and three resistance levels using the classic Fibonacci values. The main difference of this indicator and other pivot indicator is the application of Fibo values.
Features of Fibo Pivot V2 MT5 Indicator
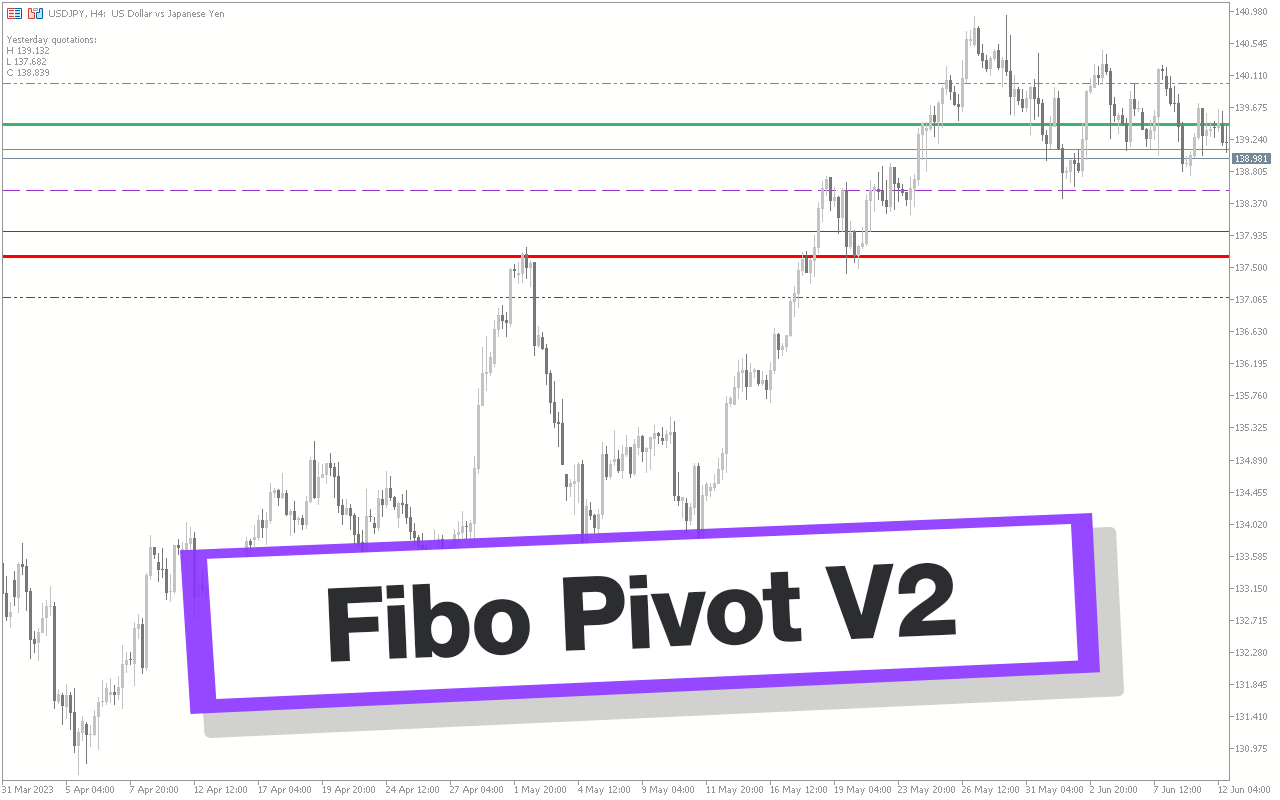
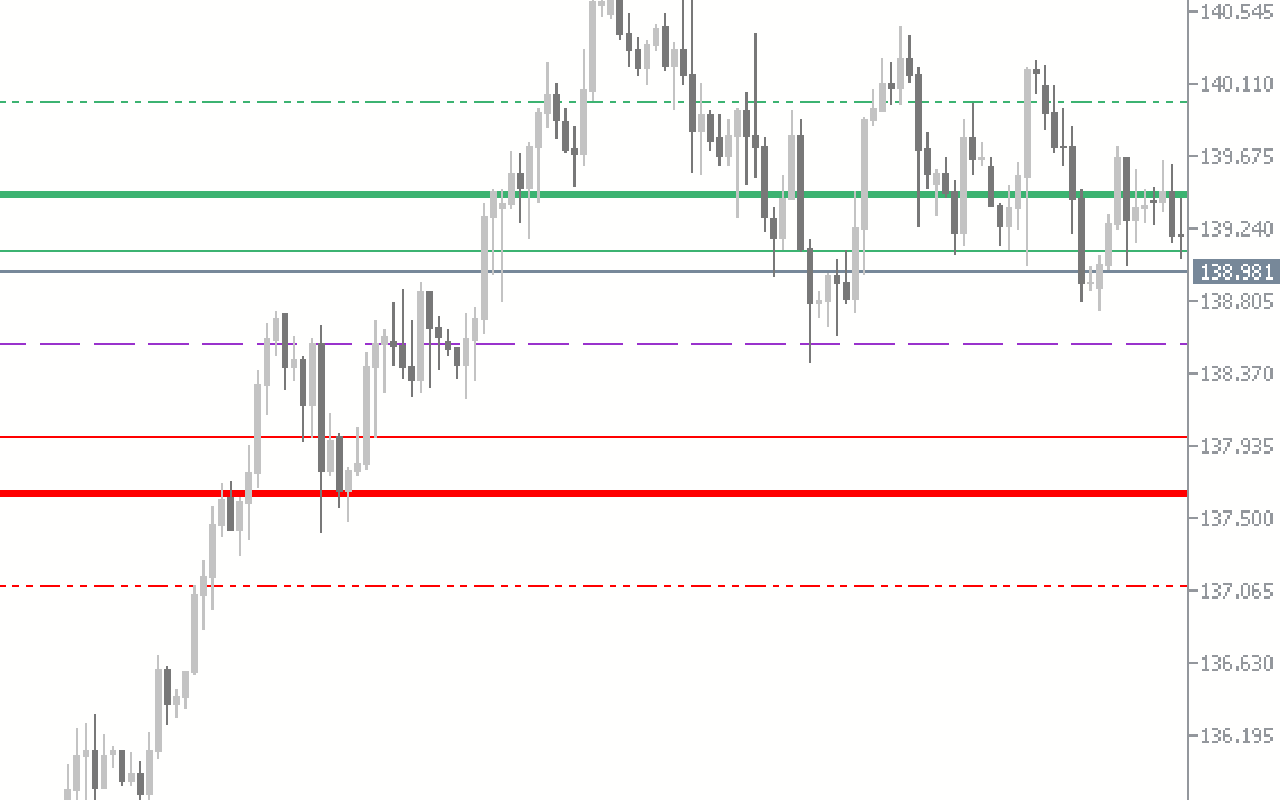
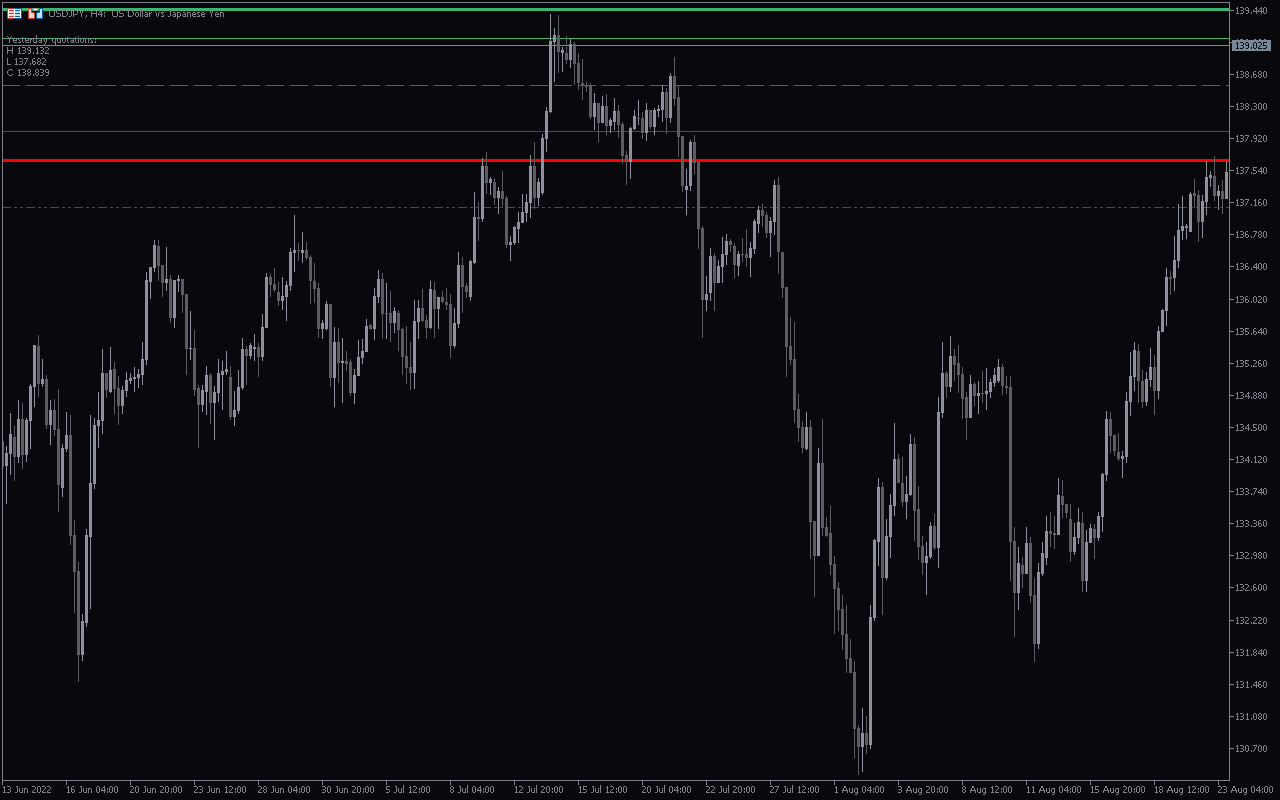
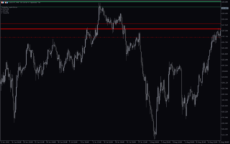
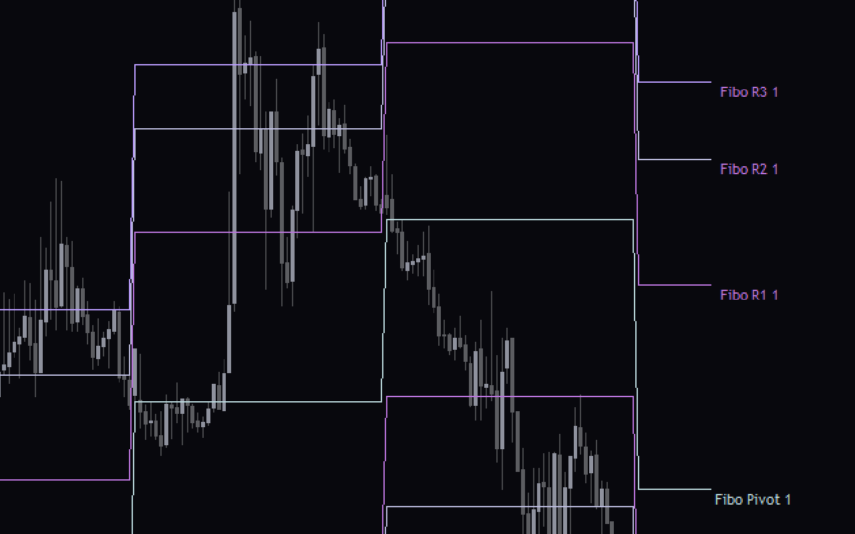
The indicator plots the pivot line as dark orchid, R1 resistance as green line, and R2 resistance as solid line and R3 as a dotted line. Similarly, the support S1 is a red line, S2 as a solid line and R3 as dotted line.
The purpose of this indicator is to avoid trader’s discretion and to identify the best support and resistance lines. Pivot line helps to identify the trend direction, while the other 6 lines are potential price reversal areas.
If the price is above the pivot line, it indicates a bullish market and is opposite for a bearish market.
During a strong market trend it is highly possible for the price to break through the resistance and support lines. However, in a ranging market price respects the R1, R2 and S1, S2. Generally, the R3 and S3 acts as overbought or oversold market condition and warrants a reversal.
Benefits of Fibo Pivot V2 MT5 Indicator
The main benefit of this indicator is to derive the support and resistance levels mathematically. So, new and advanced forex traders can enter and exit the markets with the best possible price.
However, traders should apply price action or use other technical indicators and confirm the price reversals before entering a trade.
Indicator Settings Description
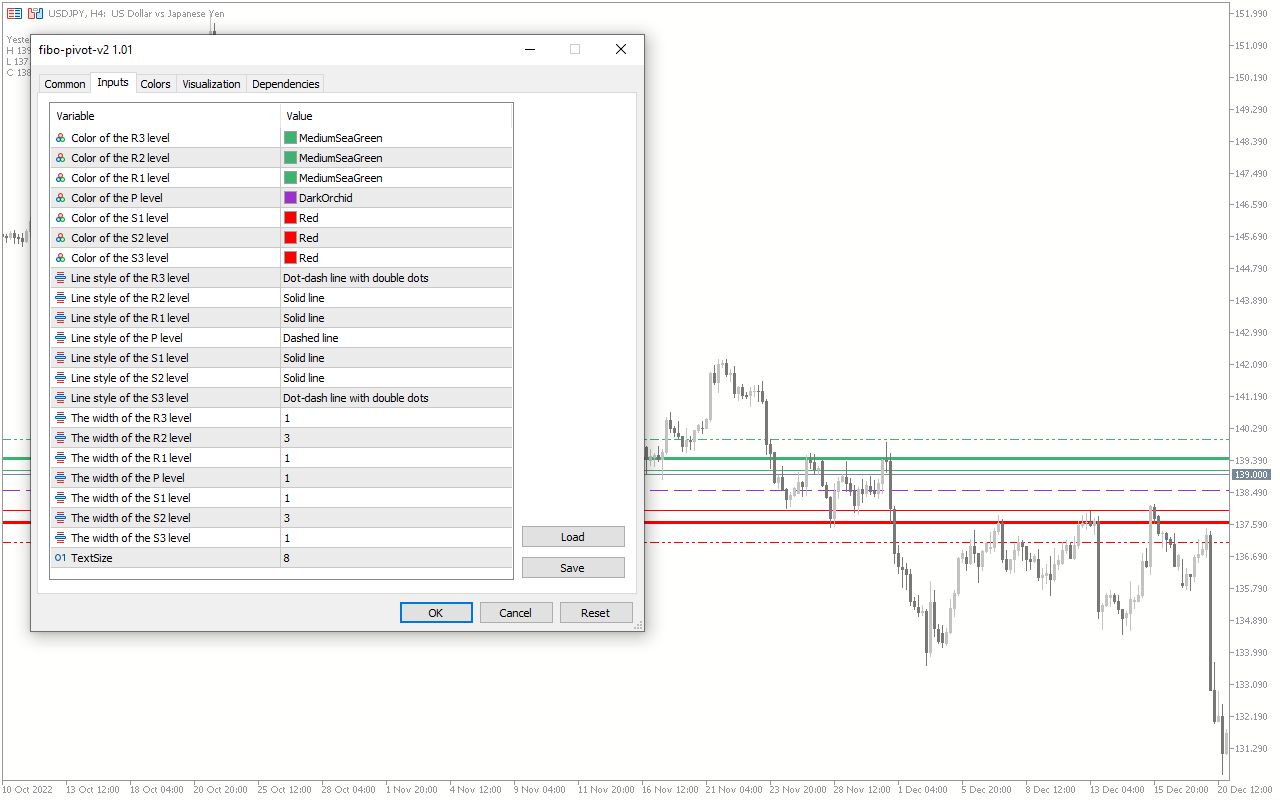
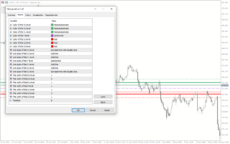
Color of the R3 level to Color of the S3 level: Input color for pivot, resistance and support lines.
Line style of the R3 level to Line style of the S3 level: Input for line style.
The width of the R3 level to The width of the S3 level: Input for line width.
TextSize: Size of text.

Reviews
There are no reviews yet.