The Trend Strength indicator for MT5 is a technical analysis tool that assesses the strength of the prevailing market trend. It is a valuable trading tool that can come in handy during technical analysis, aiding scalpers, day/intraday, and swing traders in interpreting the trend direction of the market with better precision.
Features of the Trend Strength Indicator for MT5
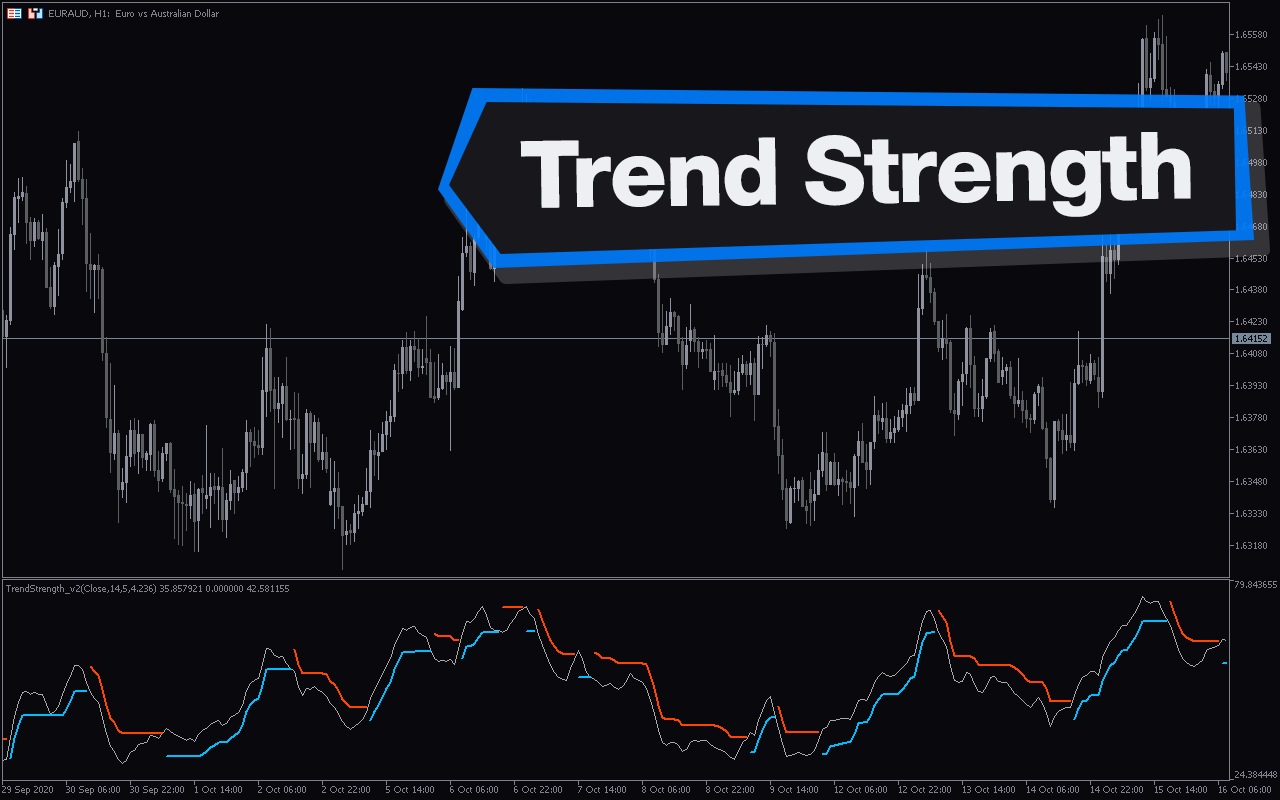
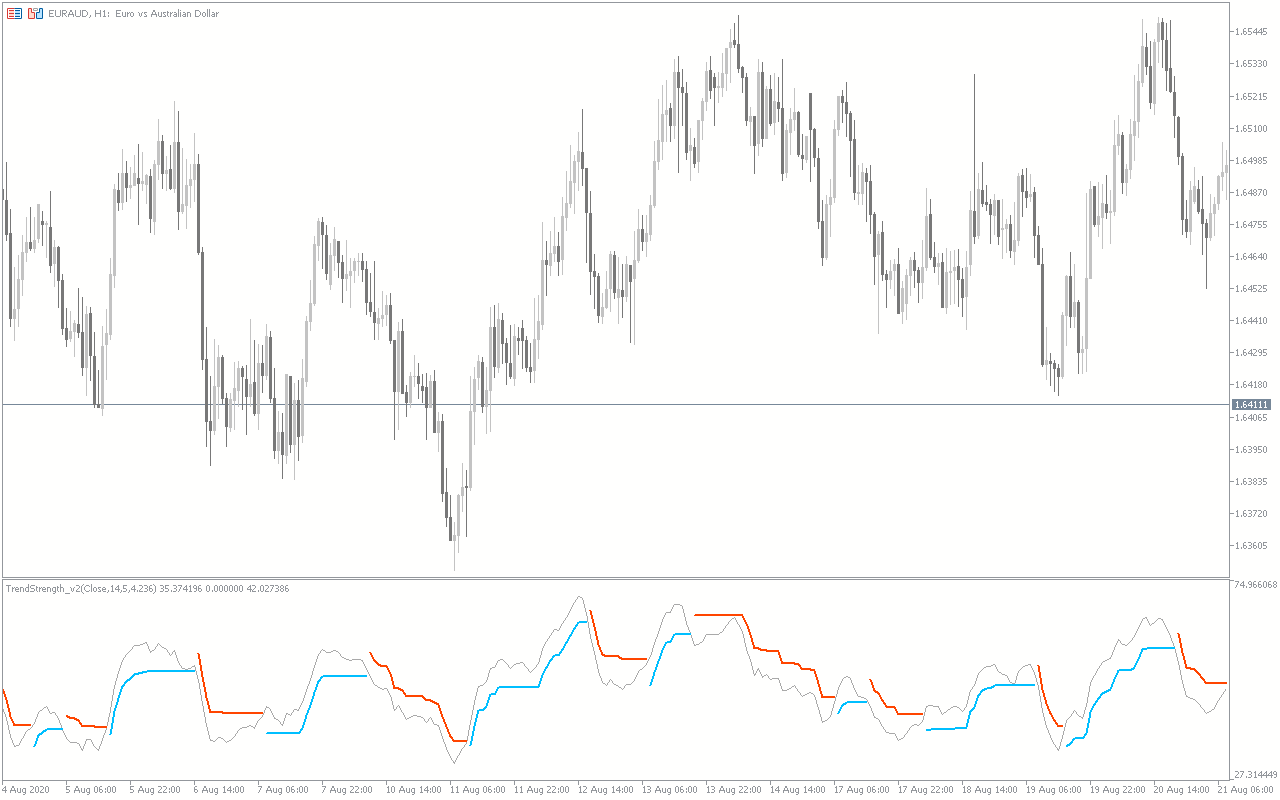
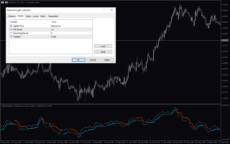
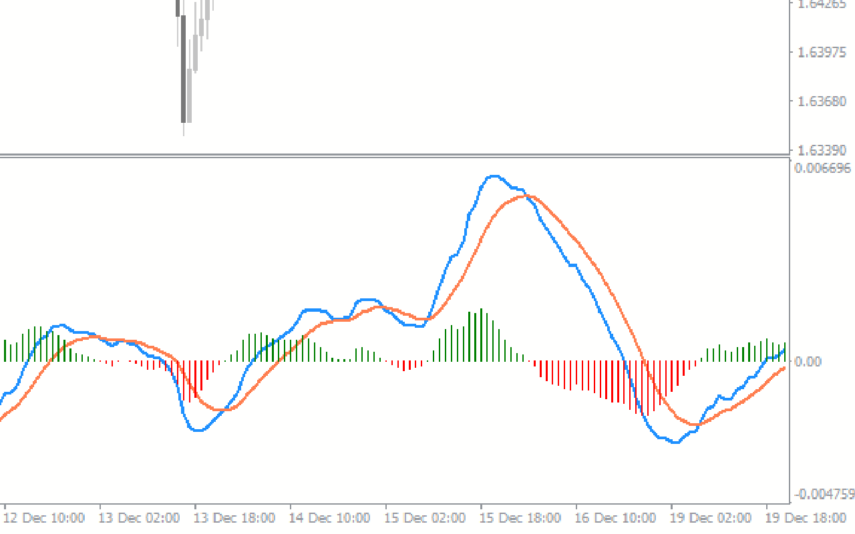
The indicator analyzes the trend strength of an asset across multiple timeframes and displays it on a separate window below the price chart. It uses a dark gray line, a deep sky blue line, and an orange line that provides insights into the trend’s strength.
The deep sky blue and orange-red lines represent bullish and bearish momentum, respectively. The indicator shows the momentum of an asset is bullish when the deep sky blue line is below the gray line, while bearish momentum is when the orange-red line is above the gray line.
Benefits of Using the Indicator
- Trend Identification: The underlying strength of the trend determines the prevailing trend direction of an instrument. So, by displaying the trend strength of an asset, the indicator helps traders determine when the market is trending or ranging, which enables better trading decisions.
- Confluence: The indicator can be used with price action in making an objective trading decision on when to buy/sell, hold a trade position, or exit. For example, traders may close a buy/long position if price action signals a reversal at a resistance level, coupled with a shift in the Trend Strength indicator from bullish to bearish momentum.
Indicator Settings Description
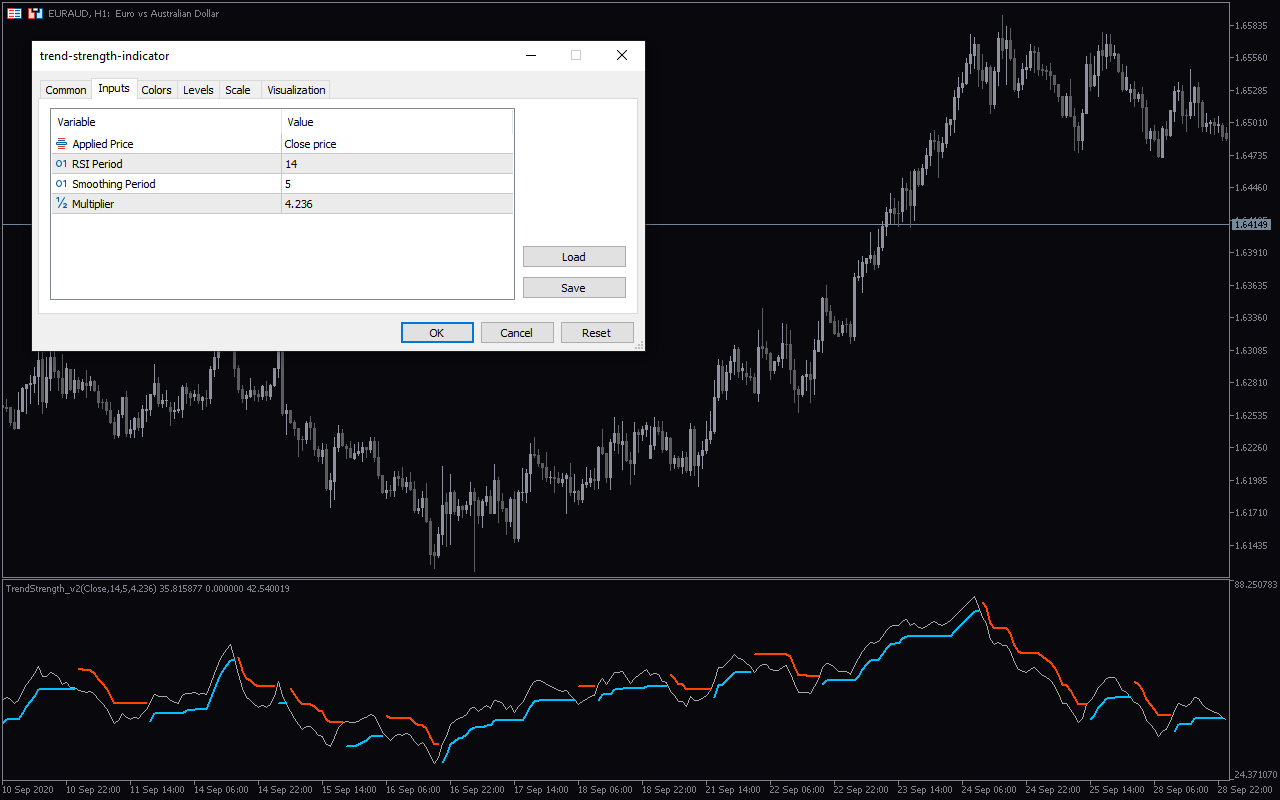
The indicator comes with the following customizable settings:
Applied price: Determines the price type (e.g., open, high, etc.) for calculations.
RSI Period: Determines the RSI period for calculation.
Smoothing period: Determines the smoothing period of the indicator.
Multiplier: Determines the multiplier factor of the indicator.


Reviews
There are no reviews yet.