The Double Stochastic RSI Indicator for MT5 is a momentum-based indicator optimized to detect overbought and oversold market conditions accurately. Thus, it is a technical analysis tool for identifying high-probability trend reversal zones in the market.
Features of the Double Stochastic RSI Indicator for MT5
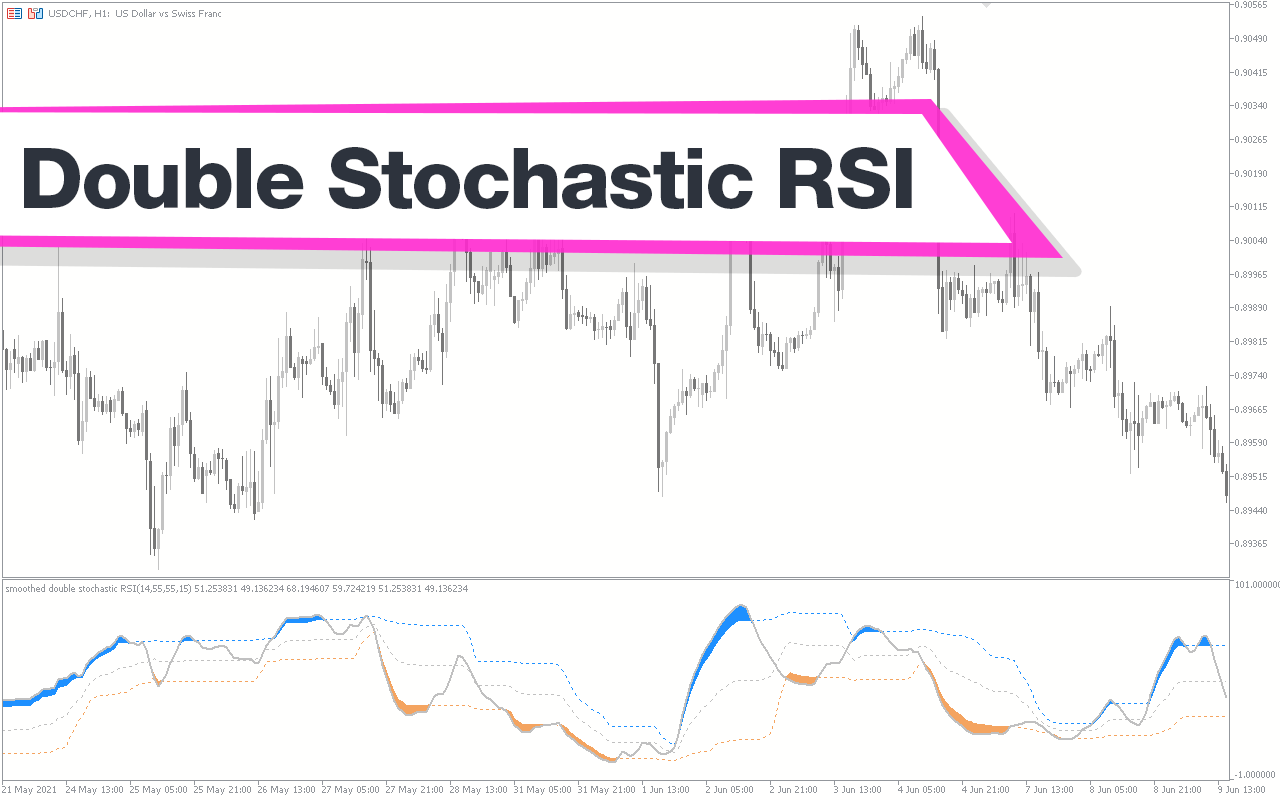
The indicator’s name suggests it was built by combining the Stochastic Oscillator and the Relative Strength Index (RSI) to enhance trend analysis. Besides, it uses floating overbought and oversold levels to identify the extreme market conditions of an instrument based on the current price action.
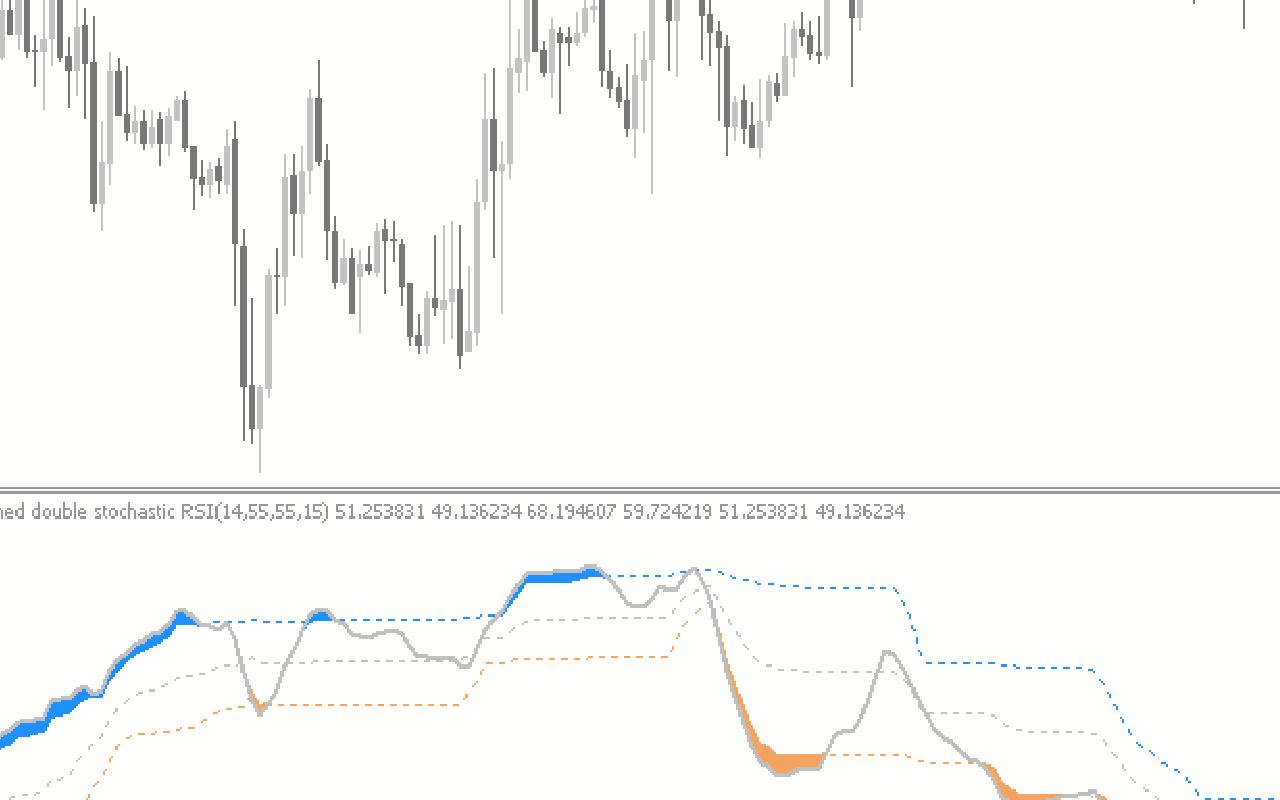
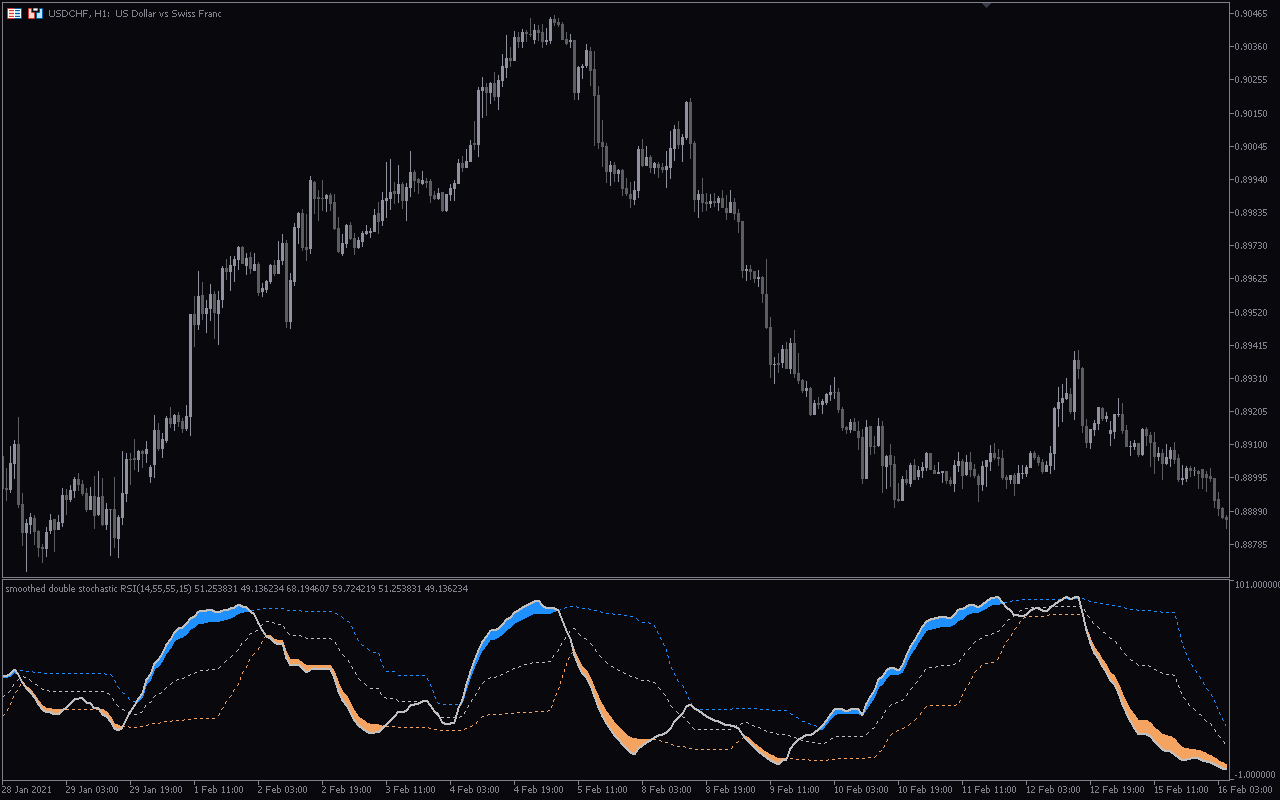
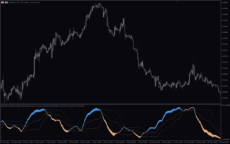
Furthermore, the indicator signals overbought and oversold market conditions using dodger blue and sandy brown shaded zones, respectively. Therefore, the indicator signals a potential bullish trend reversal (buy signal) when it displays the dodger blue, while the sandy-brown represents bearish reversal signals (sell signal).
Benefits of Using the Indicator
- Improved Accuracy: The indicator combines the RSI and the Stochastic to provide a more accurate overbought/oversold trend reversal signal, thus enhancing better trading decisions.
- Clear Signals: The indicator’s signals are easy to interpret, which makes it suitable for novice and experienced traders.
Indicator Settings Description
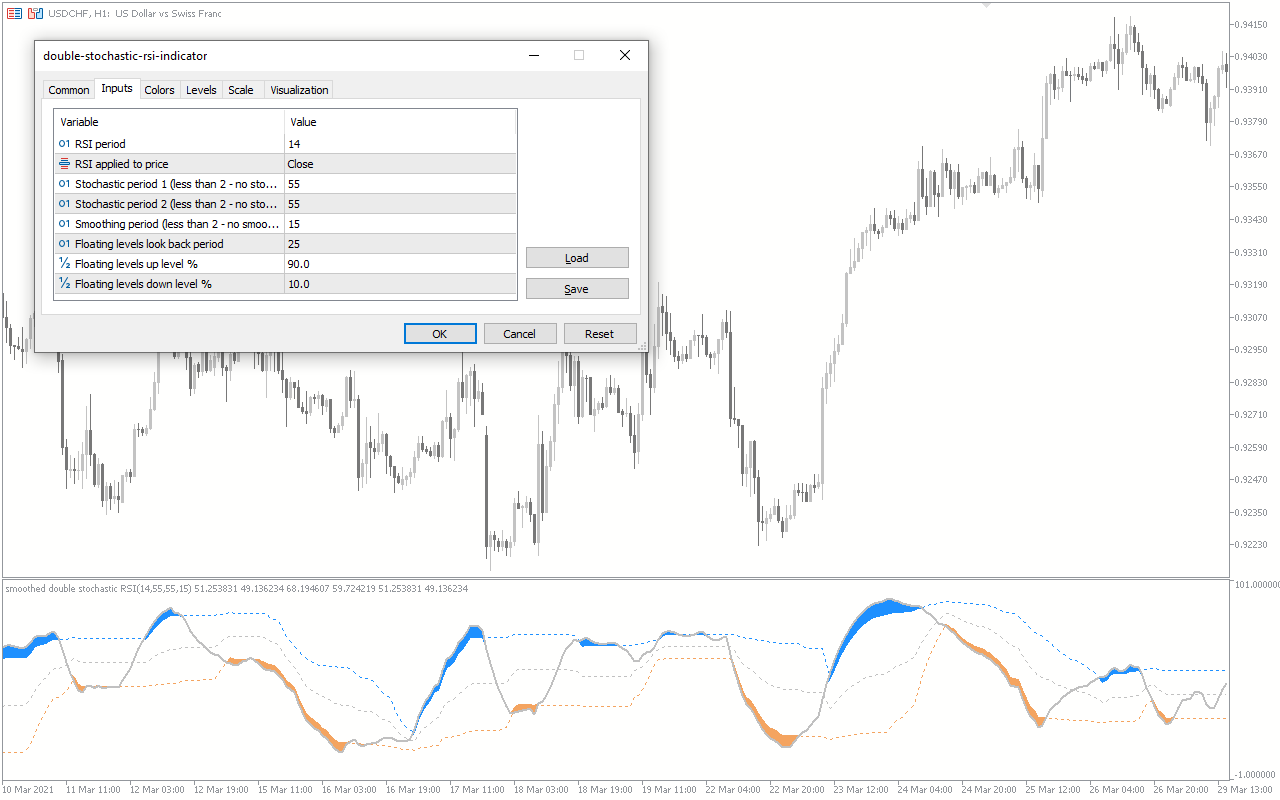
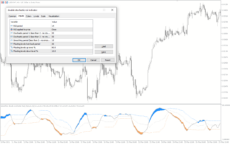
The indicator comes with the following customizable settings:
RSI Period: Determines the number of periods for RSI calculation.
RSI applied to price: Defines the price point used for RSI calculation.
Stochastic period 1 and 2: Determines the periods for the first and second stochastic indicators.
Smoothing period: Determines the number of the indicator’s smoothing period.
Floating levels look back period: Determines the period for calculating the overbought and oversold floating levels.
Floating levels up level %: Defines the level for the overbought zone.
Floating levels down level %: Defines the level for the oversold zone.

Reviews
There are no reviews yet.