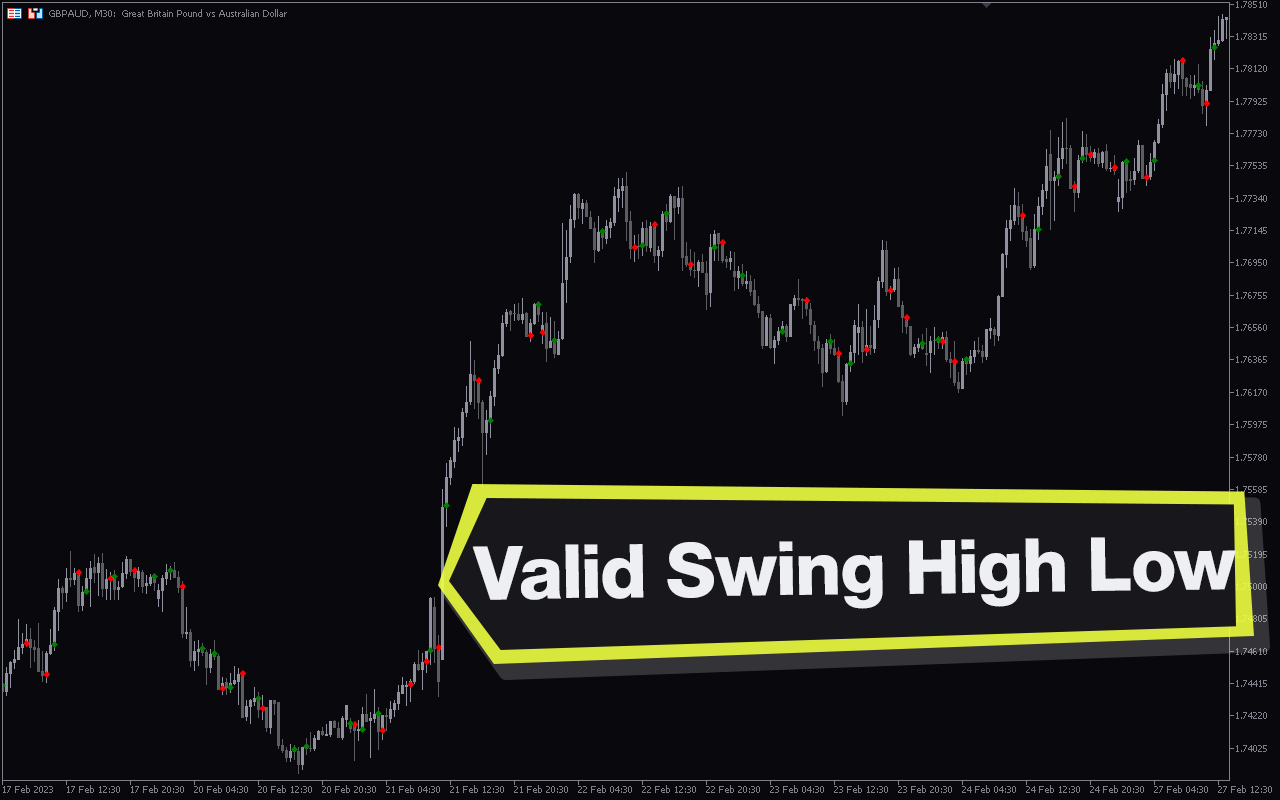
The Valid Swing High Low Indicator is a technical analysis tool for the MetaTrader 5 (MT5) platform that identifies significant price swing zones on the chart. Swing highs and lows are critical resistance and support zones for potential price reversal.
Therefore, the indicator can be a valuable trading asset to assist traders in identifying optimal trading zones to anticipate a trend reversal. It can also be used for trend identification.
How do you identify a swing high and low?
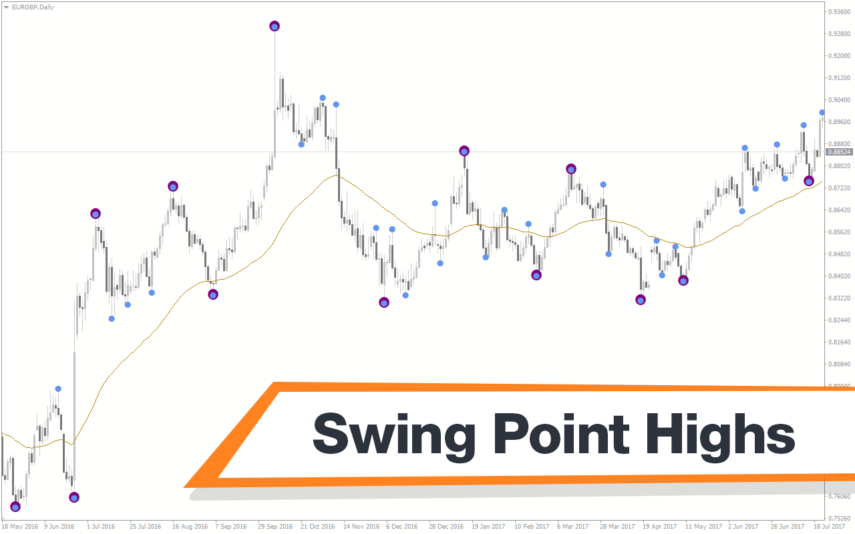
A swing high is formed when the price breaks above the previous peak, while a swing low is when the price breaks below the previous trough. The Valid Swing High Low Indicator for MT5 makes it easier as it helps in identifying the latest swing highs/lows.
Features of the Valid Swing High Low Indicator
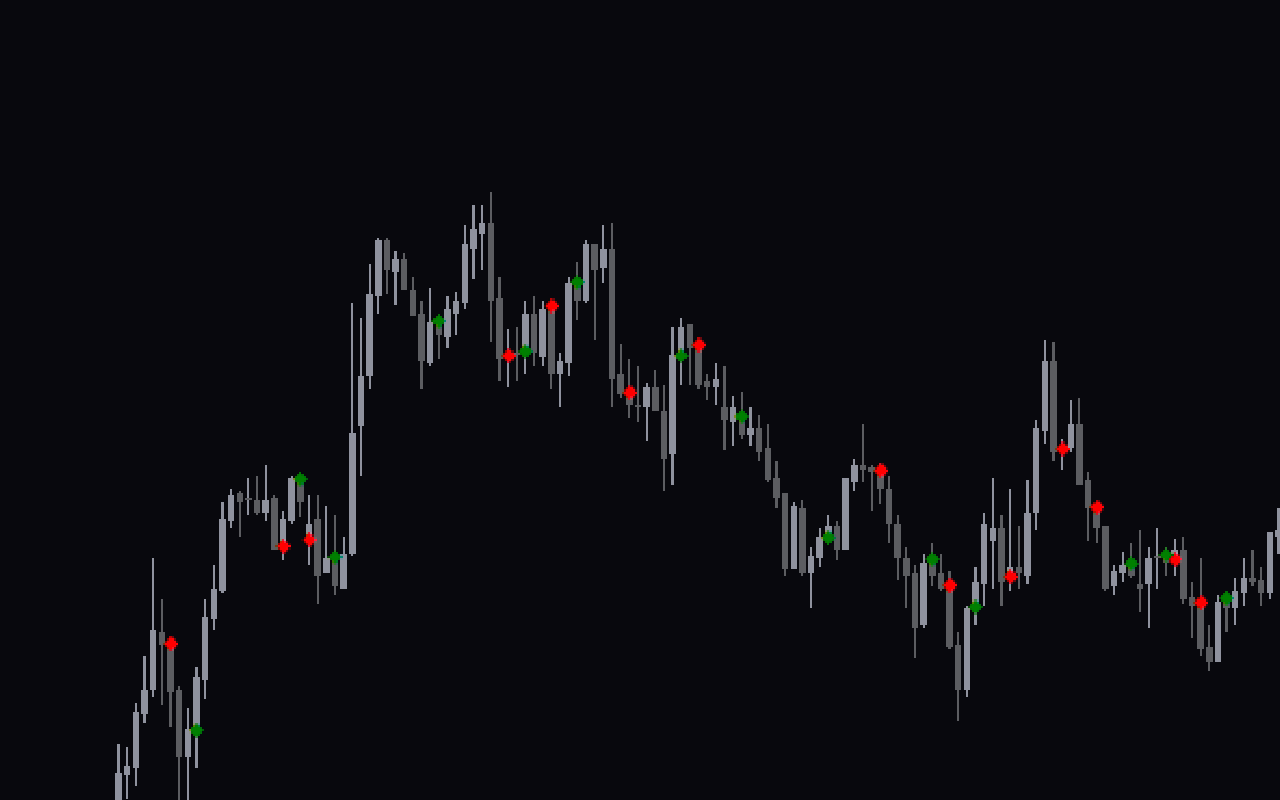
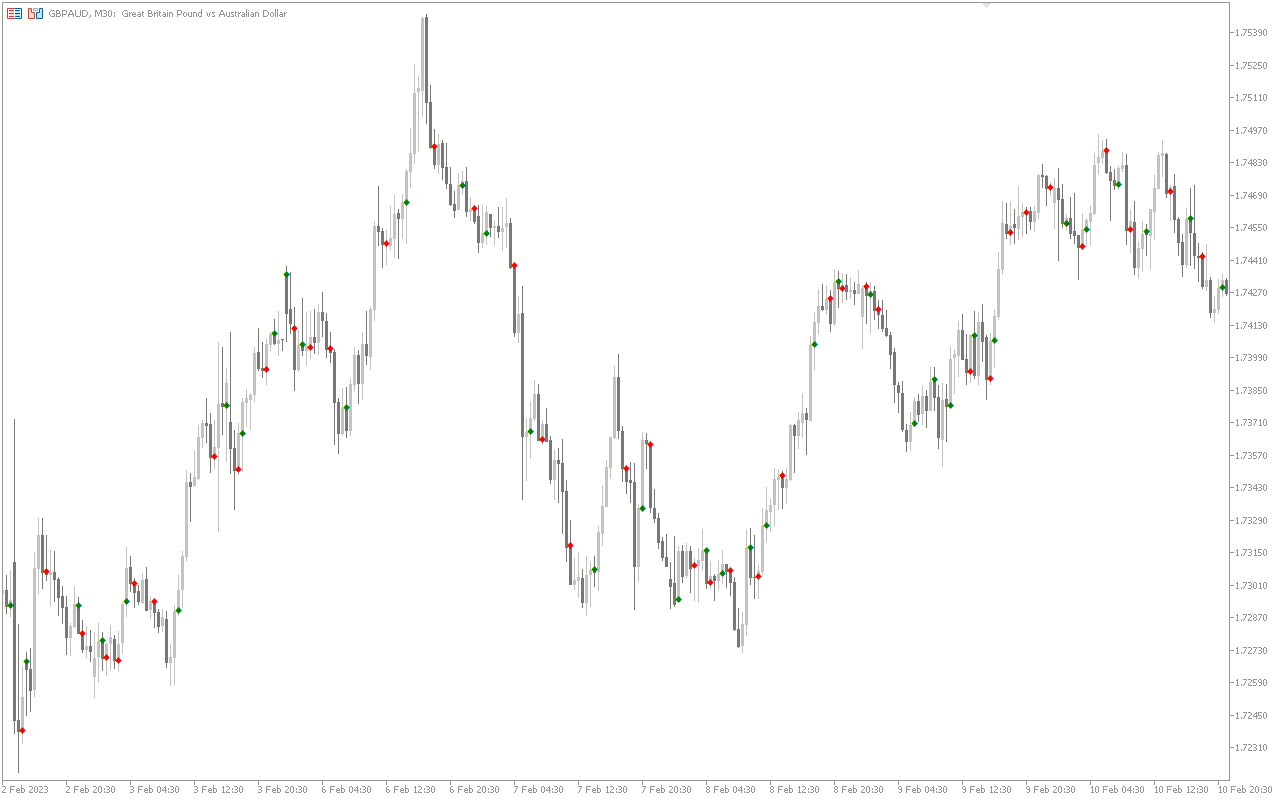
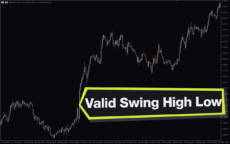
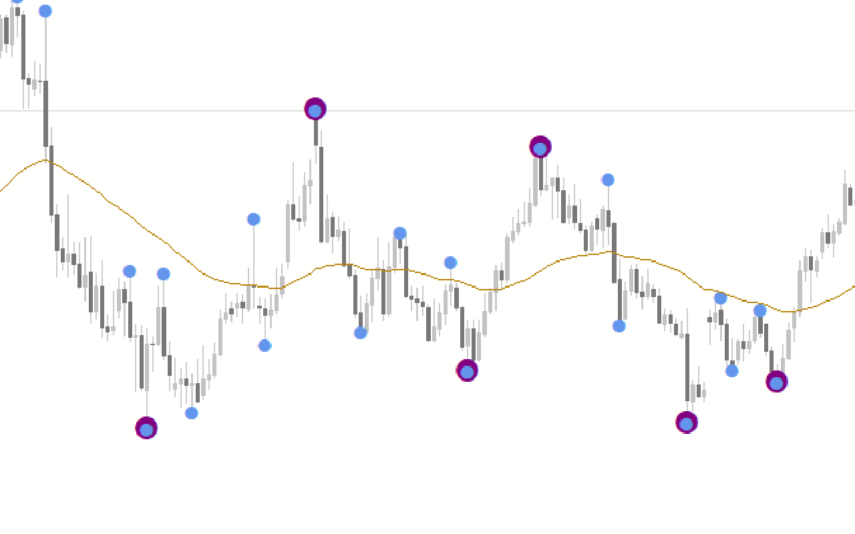
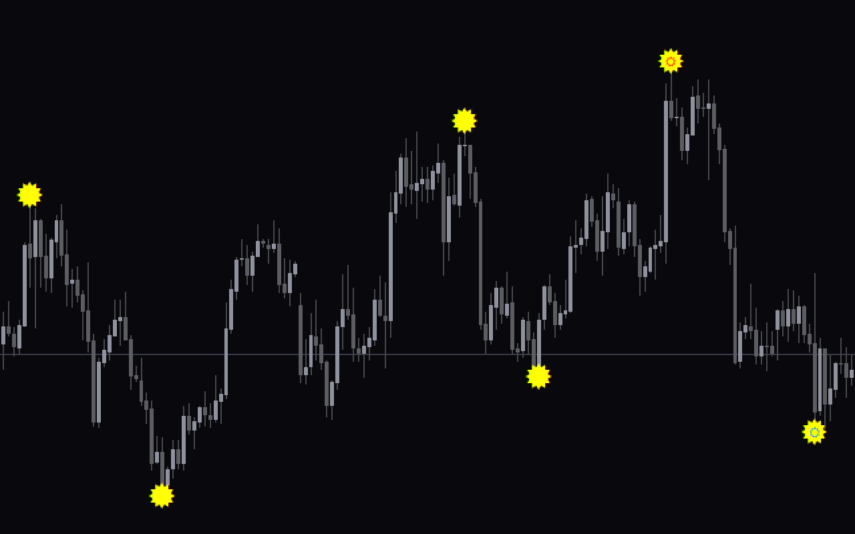
The indicator highlights swing highs and lows with red and green dots at the peaks and troughs of the previous price point. The red dot indicates the swing high, while the green dot signifies the swing low. Besides, it allows traders to choose between a fractal bar and a signal bar, which determines how the swing highs or lows are displayed.
Benefits of Using the Indicator
- Market Trend Identification: Swing highs and lows provide traders with a clear trend direction of the market. For instance, the market is in a downtrend when the price continually prints lower highs and lower lows.
- Trend Reversal Identification: Swing highs/lows are potential support and resistance zones where the trader anticipates a possible trend reversal setup.
- Entry and Exits Signal: Highs and lows can be used to spot trade entry or exit zones. For example, a trader may look for an opportunity to sell/buy an instrument when the price is rejected at a previous swing high/low, and then print a reversal candlestick pattern.
Indicator Description Settings

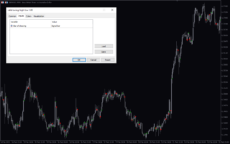
The indicator’s setting includes the following:
Bar of drawing: This parameter allows traders to choose the type of bar to display the swing highs/lows.


Reviews
There are no reviews yet.