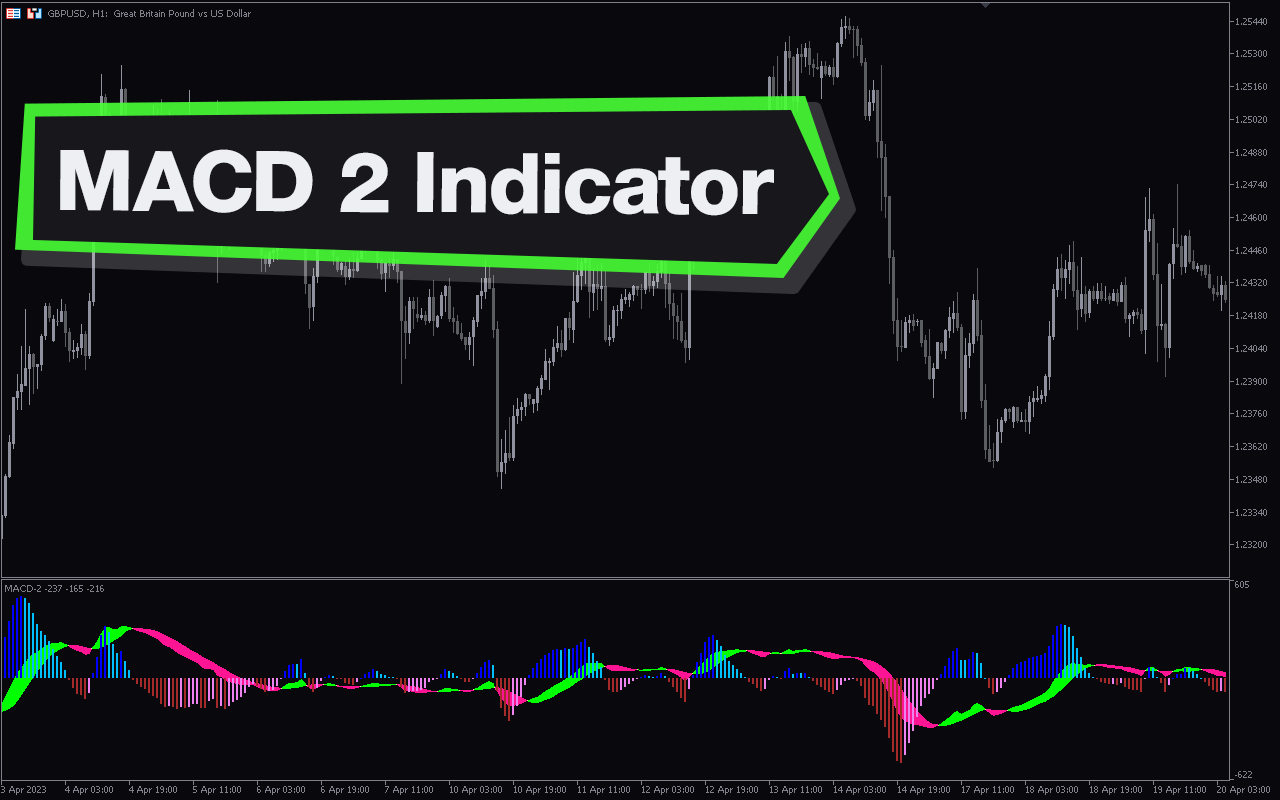
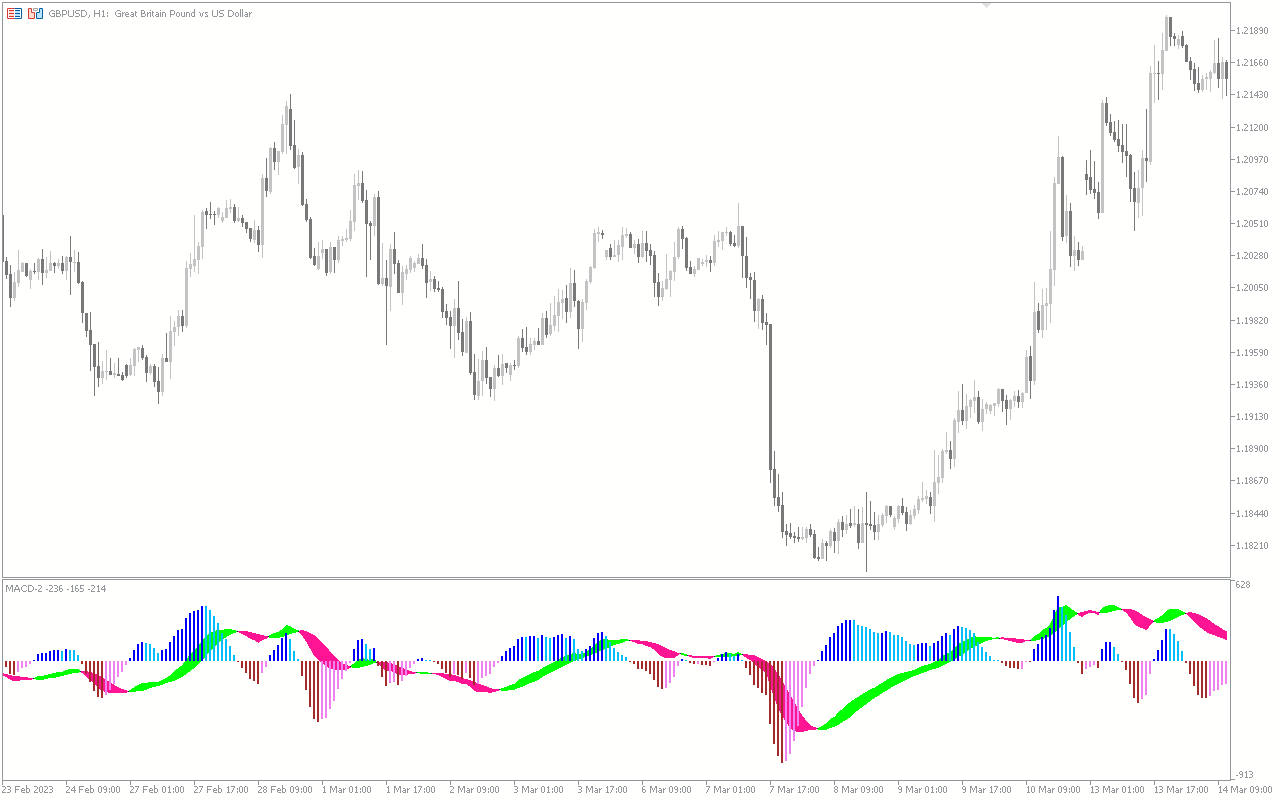
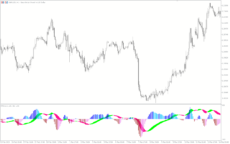
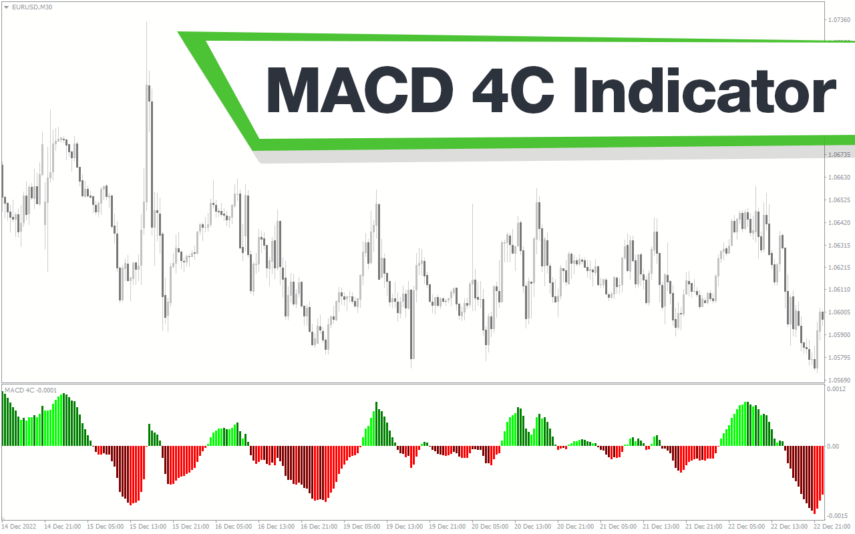
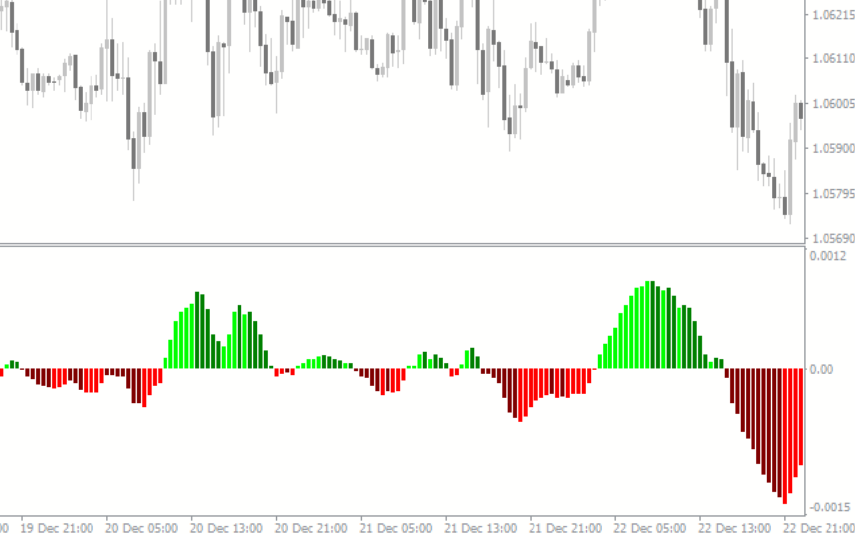
The MACD 2 MT5 indicator plots a MACD cloud and MACD histogram bar on the same indicator window. This helps forex technical traders to clearly understand the crossovers and trade the markets effectively.
Features of MACD 2 MT5 Indicator
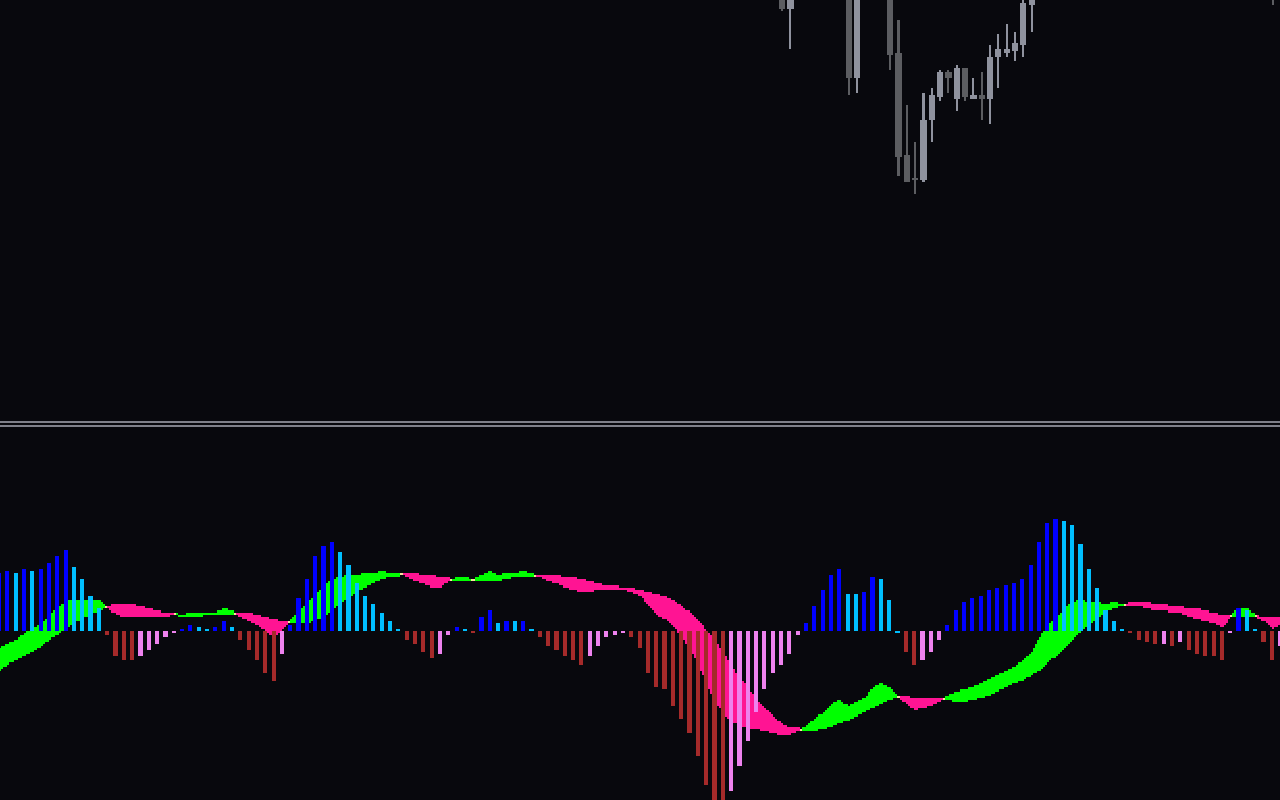
The indicator plots a double color MACD cloud. Green represents a bullish MACD cloud while the red indicates a bearish cloud. Traders should note that the cloud is based on the MACD values similar to the histogram bars.
The indicator plots a multi color histogram bar. Dark blue indicates a strong bullish trend while the light blue shows a weak uptrend. Similarly, dark red shows a strong downtrend and the light red indicates a weak downtrend.
MACD – Moving average convergence and divergence is a proven and effective technical analysis indicator across asset classes. Though it can be traded in multiple ways, there are a few that are more reliable.
Primarily, the appearance of histogram bars above the zero level together with a green cloud indicates a bullish market. So, traders can enter a buy trade with a stop below the previous swing low and look to book profits at an opposite trading signal.
Oppositely, traders can open a sell trade if the histogram bars appear below the zero level and the cloud turn red.
Benefits of MACD 2 MT5 Indicator
The indicator plots the histogram over the cloud, so both are visible always in the same indicator window. This helps forex traders in technical analysis and trading strategies to have a complete understanding of the output values.
This indicator works well in all intraday chart time frames and the daily, weekly and monthly price charts. So, it is beneficial for new and advanced forex traders and is useful to short and long-term forex traders.
Indicator Settings Description
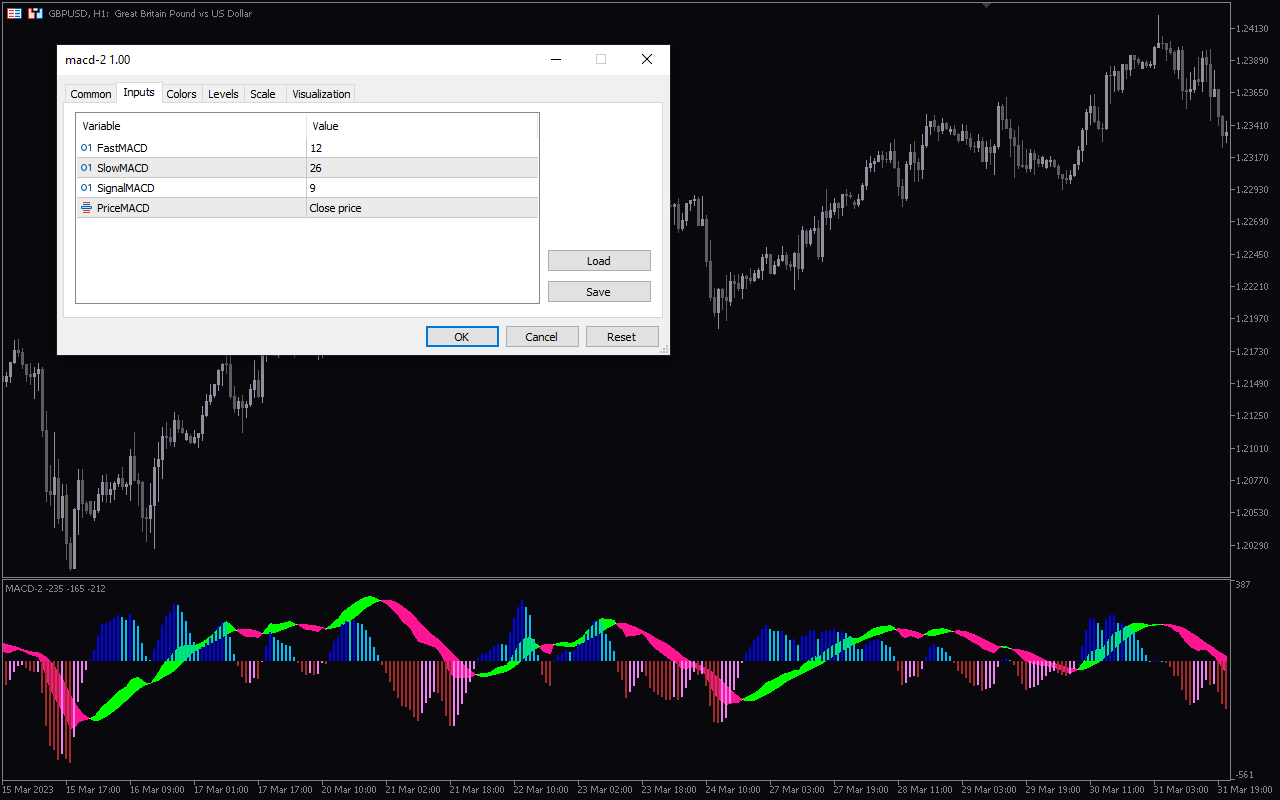
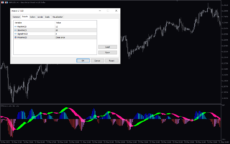
FastMACD:, SlowMACD:, SignalMACD: Period for MACD calculation.
PriceMACD: Price type.

Reviews
There are no reviews yet.