In the dynamic realm of forex trading, precision and precision hold significant importance. Traders worldwide are perpetually in pursuit of instruments and approaches that can grant them a competitive advantage in interpreting market dynamics. Among the array of technical analysis tools, Fibonacci indicators occupy a unique position due to their capacity to pinpoint potential support and resistance levels, forecast price objectives, and unveil market retracements.
Within this extensive article, we venture into the domain of Fibonacci indicators, examining the top 20 selections that can equip forex traders with advanced decision-making abilities. Whether you’re an experienced trader or embarking on your forex journey, mastering the potential of Fibonacci indicators can prove to be a pivotal factor. Come along as we uncover the mysteries surrounding these indicators, their practical uses, and how they can empower you to navigate the intricate and ever-evolving realm of forex trading with precision and assurance.
Top 10 Best Fibonacci Indicators for Forex Traders
- Fibonacci Pivots Indicator
- Fibonacci Retracement Indicator
- Zigzag Fibonacci Fan Indicator
- KG Fibonacci MA Indicator
- Auto Fibonacci Retracement Indicator
- Break Out With TP and SL Fibonacci Indicator
- PivotPoints.All-In-One Indicator
- Fibonacci Based Moving Averages Indicator
- Auto Fibonacci Fan Indicator
- Elliot Fibonacci Indicator
Fibonacci Pivots Indicator
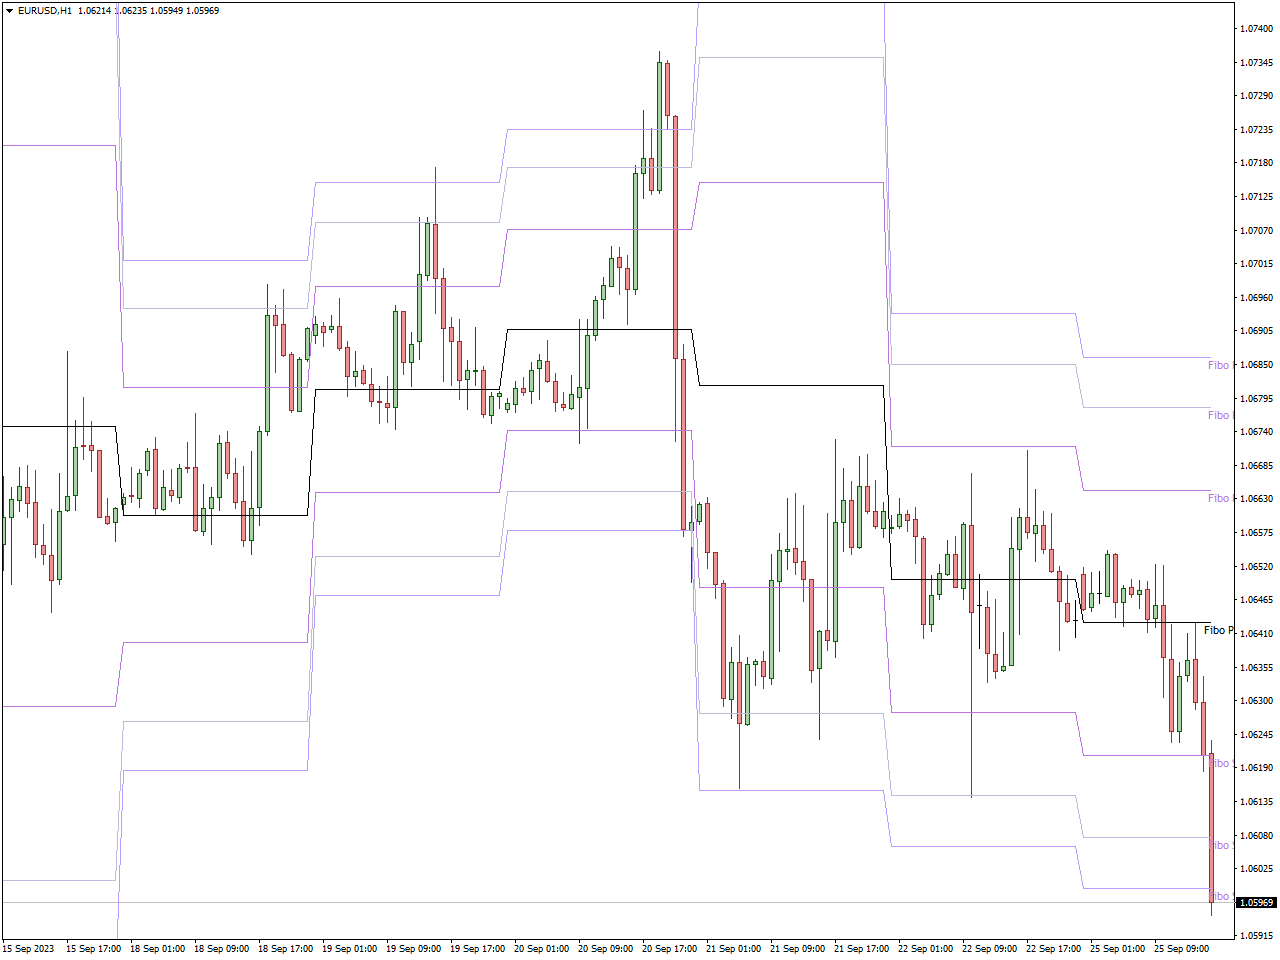
The Fibonacci Pivots Indicator for MT4 is a technical analysis instrument created for utilization within the MetaTrader 4 trading platform. It leverages the Fibonacci sequence, a mathematical concept frequently employed in financial markets to analyze support and resistance levels.
This indicator calculates and plots key support and resistance levels on the price chart based on Fibonacci ratios. These levels are derived from the Fibonacci sequence, including commonly used ratios like 0.618, 0.382, and 1.618. Fibonacci Pivots are similar to traditional pivot points but incorporate Fibonacci retracement levels. These pivot points help traders identify potential turning points in the market.
Traders often use Fibonacci Pivots to confirm the direction of the prevailing trend. For example, if prices are above a Fibonacci support level, it may indicate a bullish trend, and vice versa. Traders can combine the Fibonacci Pivots Indicator with Fibonacci retracement tools to enhance their analysis and identify potential confluence zones.
Fibonacci Retracement Indicator
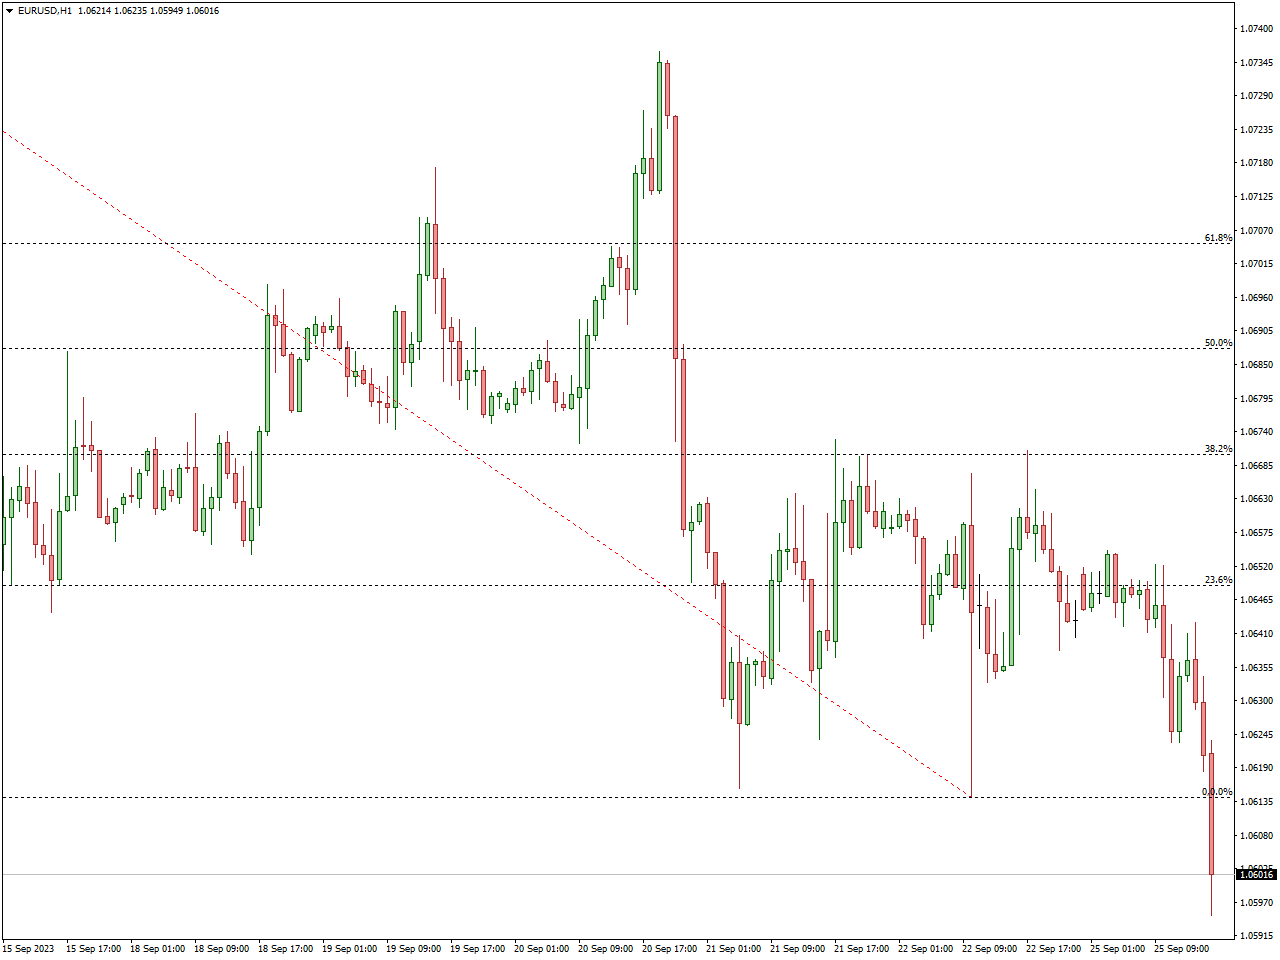
The Fibonacci Retracement Indicator is a commonly employed technical analysis instrument within financial markets, including the forex realm. Rooted in the Fibonacci sequence, a mathematical principle harnessed for trading purposes, it serves to pinpoint prospective support and resistance thresholds, alongside price retracements.
The Fibonacci Retracement Indicator calculates and plots horizontal lines on the price chart at specific Fibonacci retracement levels. These levels represent potential support (if prices are moving upward) or resistance (if prices are moving downward) levels where price retracements might occur.
Traders frequently combine Fibonacci retracement levels with other technical analysis tools, including trendlines, moving averages, or candlestick patterns. This amalgamation aids in pinpointing confluence zones where multiple indicators align, signaling the possibility of either a trend reversal or its continuation.
Zigzag Fibonacci Fan Indicator
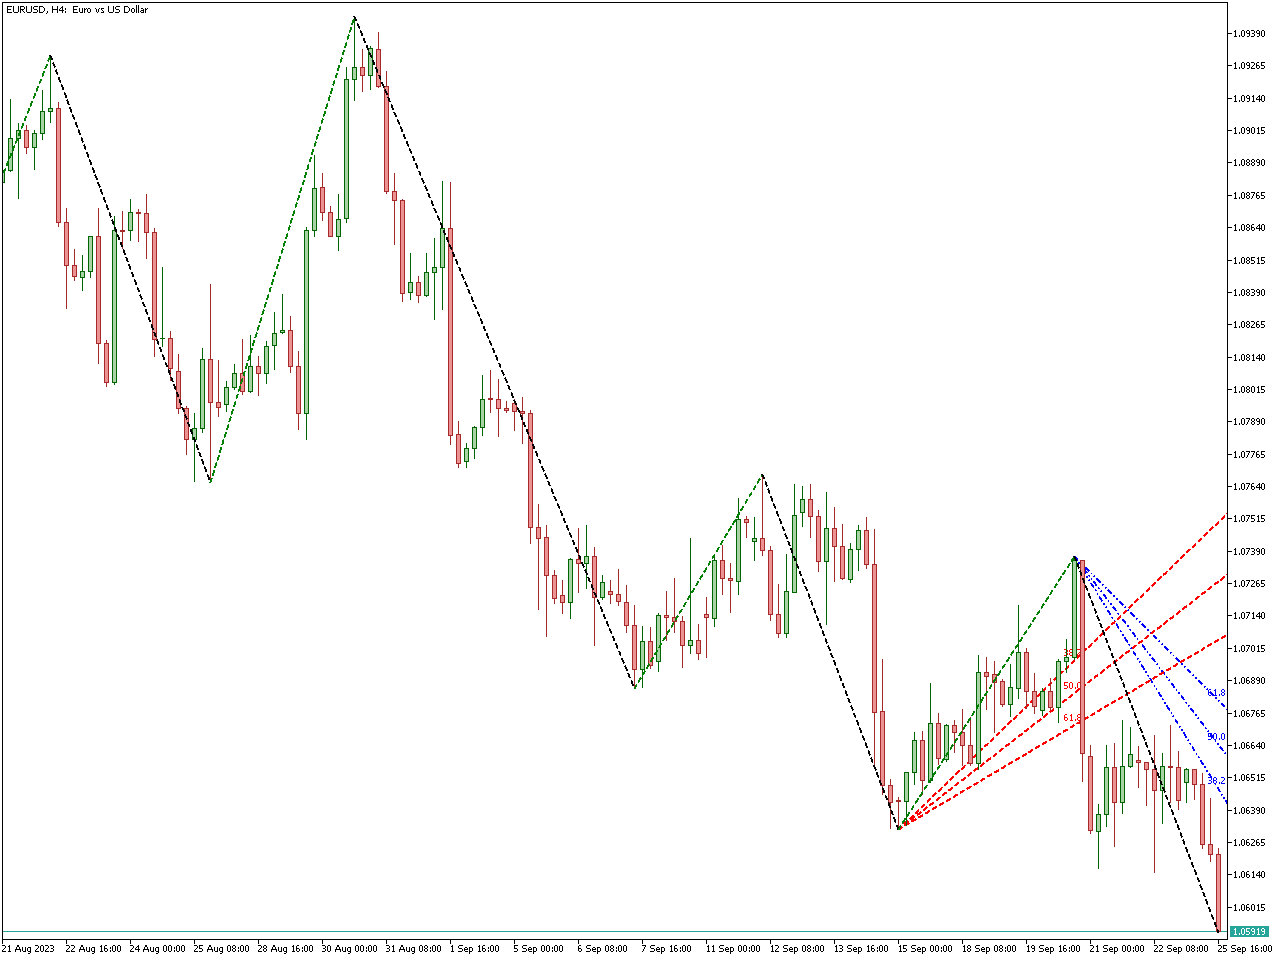
The Zigzag Fibonacci Fan Indicator is a technical analysis tool used in financial markets, including the forex market, to identify potential support and resistance levels, as well as to visualize price trends. It combines two technical analysis concepts: the Zigzag indicator and Fibonacci retracement levels.
The Zigzag indicator is used to identify significant price swings or “waves” in a financial asset’s price chart. It connects swing highs and swing lows with trendlines, helping traders visualize the direction and magnitude of price movements.
The Zigzag Fibonacci Fan helps traders identify trends and potential reversal or continuation points within those trends. The diagonal lines of the fan can act as dynamic support or resistance levels. Traders use this indicator to identify potential entry points for trades when the price approaches or interacts with the fan’s diagonal lines. Additionally, the fan can provide exit signals or points to adjust stop-loss and take-profit levels.
KG Fibonacci MA Indicator
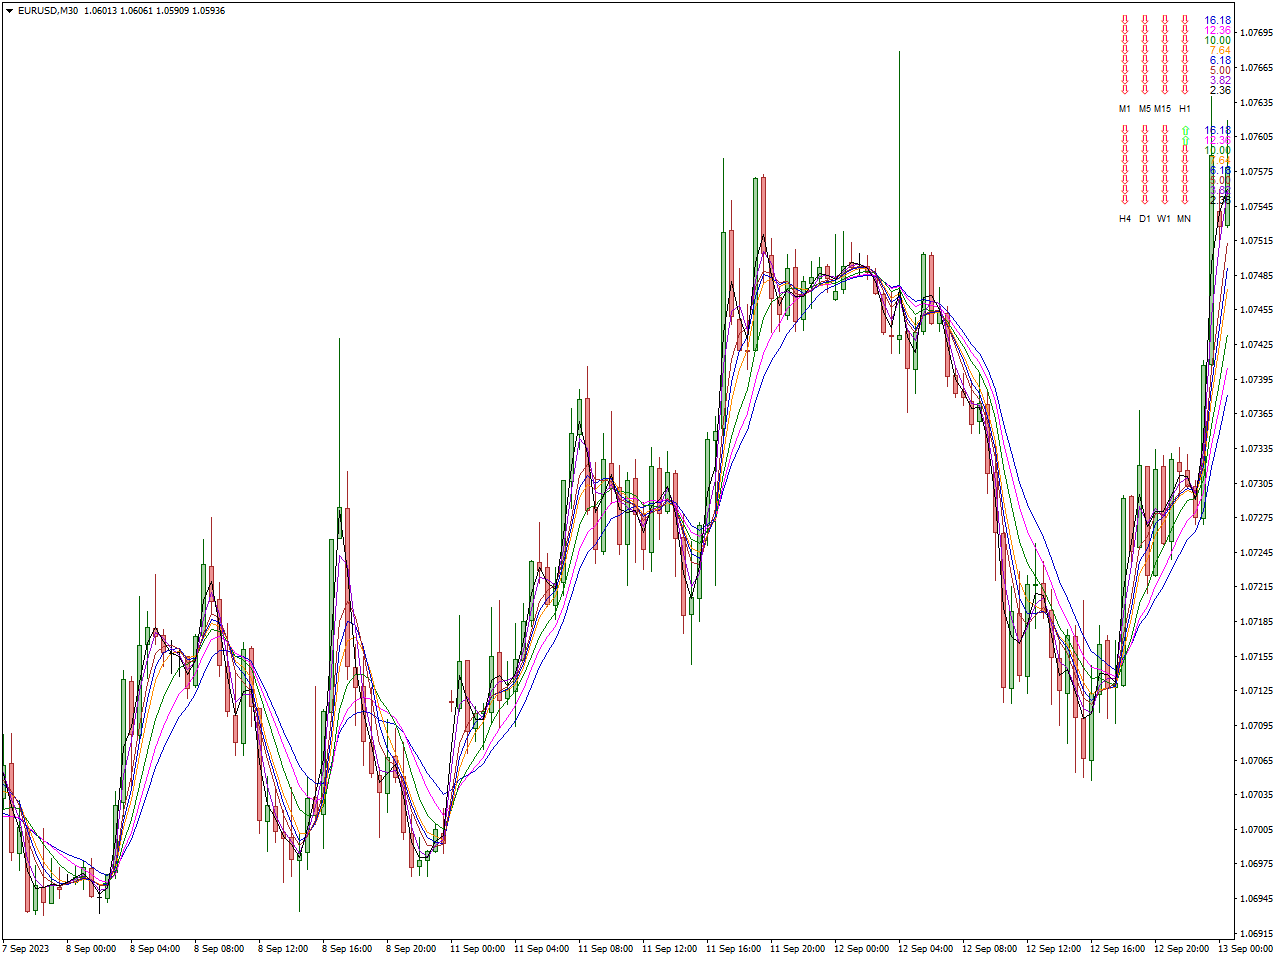
The KG Fibonacci MA Indicator is a technical analysis tool employed in financial markets, including the forex sector. Its purpose is to aid traders in identifying trends and potential reversal zones. This indicator combines two essential concepts: the Fibonacci sequence and moving averages (MA).
This indicator combines the principles of Fibonacci retracement levels with moving averages. It calculates and plots moving averages on the price chart, and these moving averages are often based on Fibonacci values, such as the 8 EMA or 21 SMA.
Traders use the KG Fibonacci MA Indicator to identify trends in the market. When the indicator’s moving averages are sloping upward, it suggests an uptrend, while a downward slope indicates a downtrend.
Auto Fibonacci Retracement Indicator
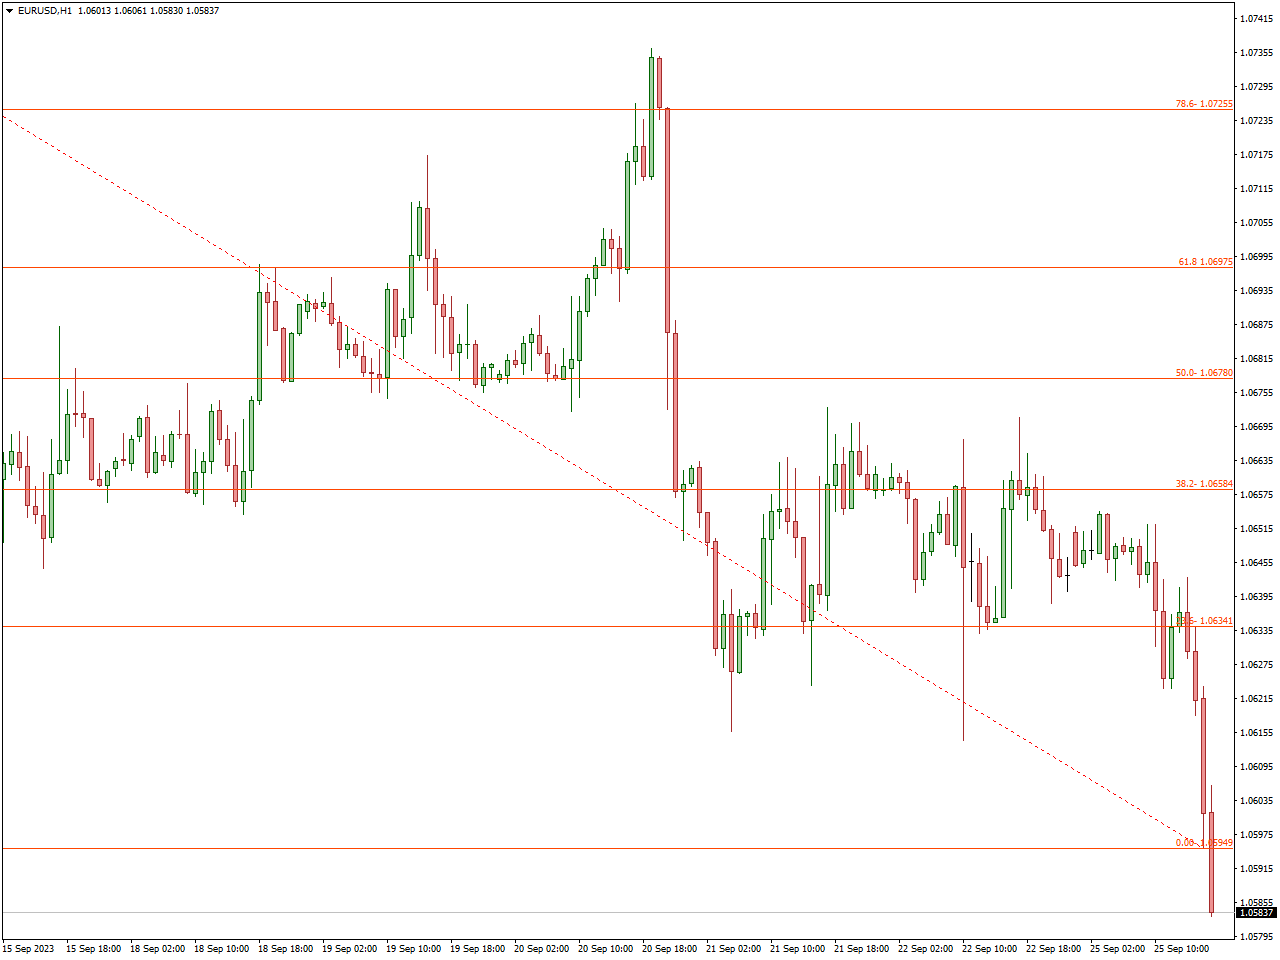
As the name suggests, the Auto Fibonacci Retracement Indicator automatically calculates and plots key Fibonacci retracement levels on the price chart. These levels are typically based on the most recent major price swing or trend.
The presence of Fibonacci retracement levels can help traders confirm the direction of the prevailing trend. For instance, if prices are above a Fibonacci retracement level in an uptrend, it may indicate strength in the trend.
Traders use the indicator to identify potential support levels (if prices are moving upward) or resistance levels (if prices are moving downward). These levels can serve as areas where price corrections may pause or reverse.
Break Out With TP and SL Fibonacci Indicator
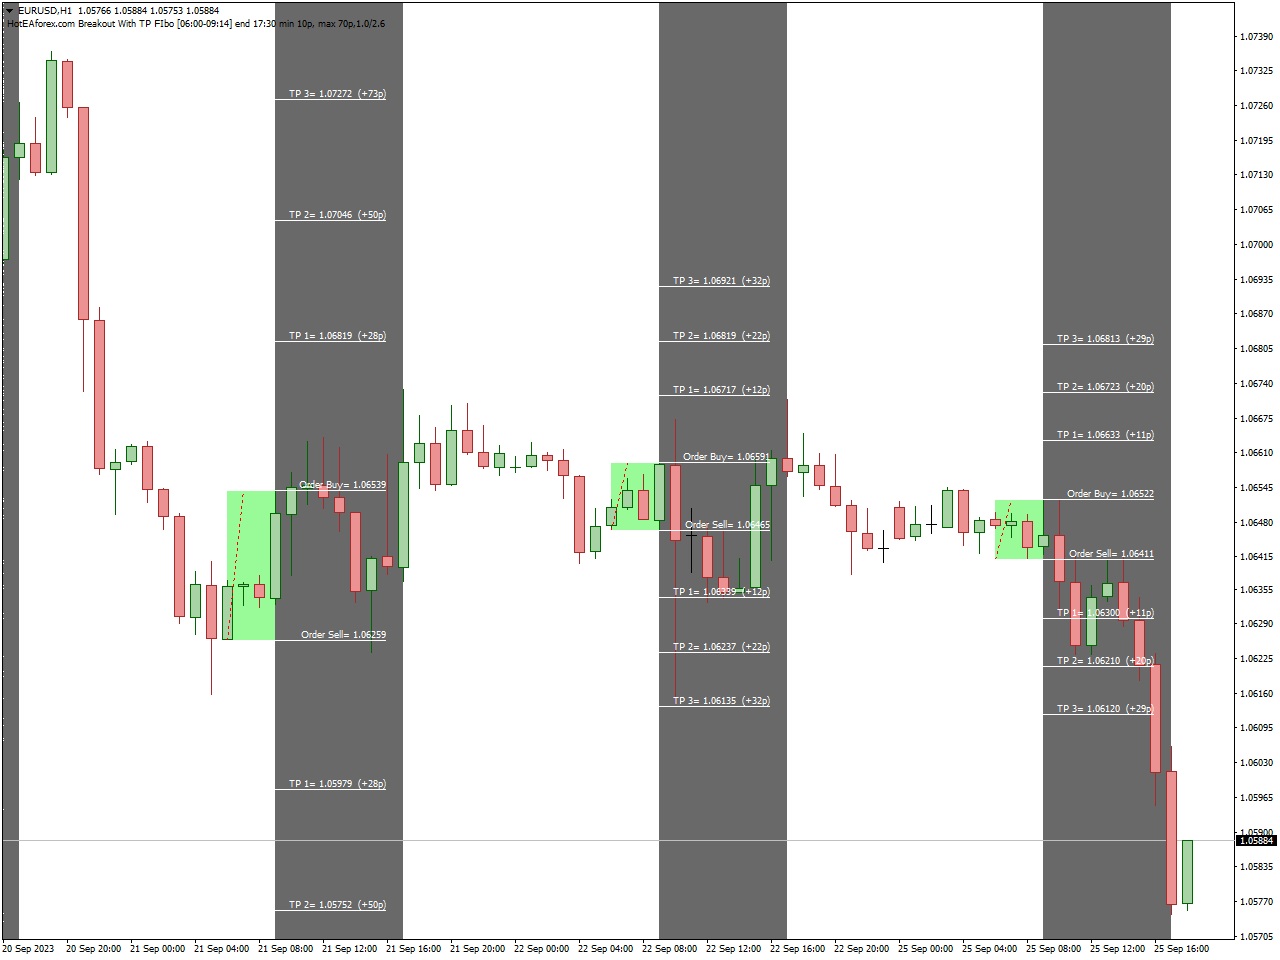
The “Breakout with TP and SL Fibonacci Indicator” is a technical analysis tool employed in various financial markets, including the forex market, to help traders identify breakout trading opportunities. It incorporates Fibonacci retracement levels to establish take-profit (TP) and stop-loss (SL) levels.
The primary function of the indicator is to detect potential breakout points on a price chart. Breakouts occur when the price breaches significant levels of support or resistance, indicating a potential change in market direction. Once a breakout is identified, the indicator generates suggested TP and SL levels based on the Fibonacci retracement levels. Traders can utilize these levels as guidelines when setting their TP and SL orders.
While the primary focus is on TP and SL levels, traders may also utilize the breakout points identified by the indicator as potential entry points for their trades.
PivotPoints.All-In-One Indicator
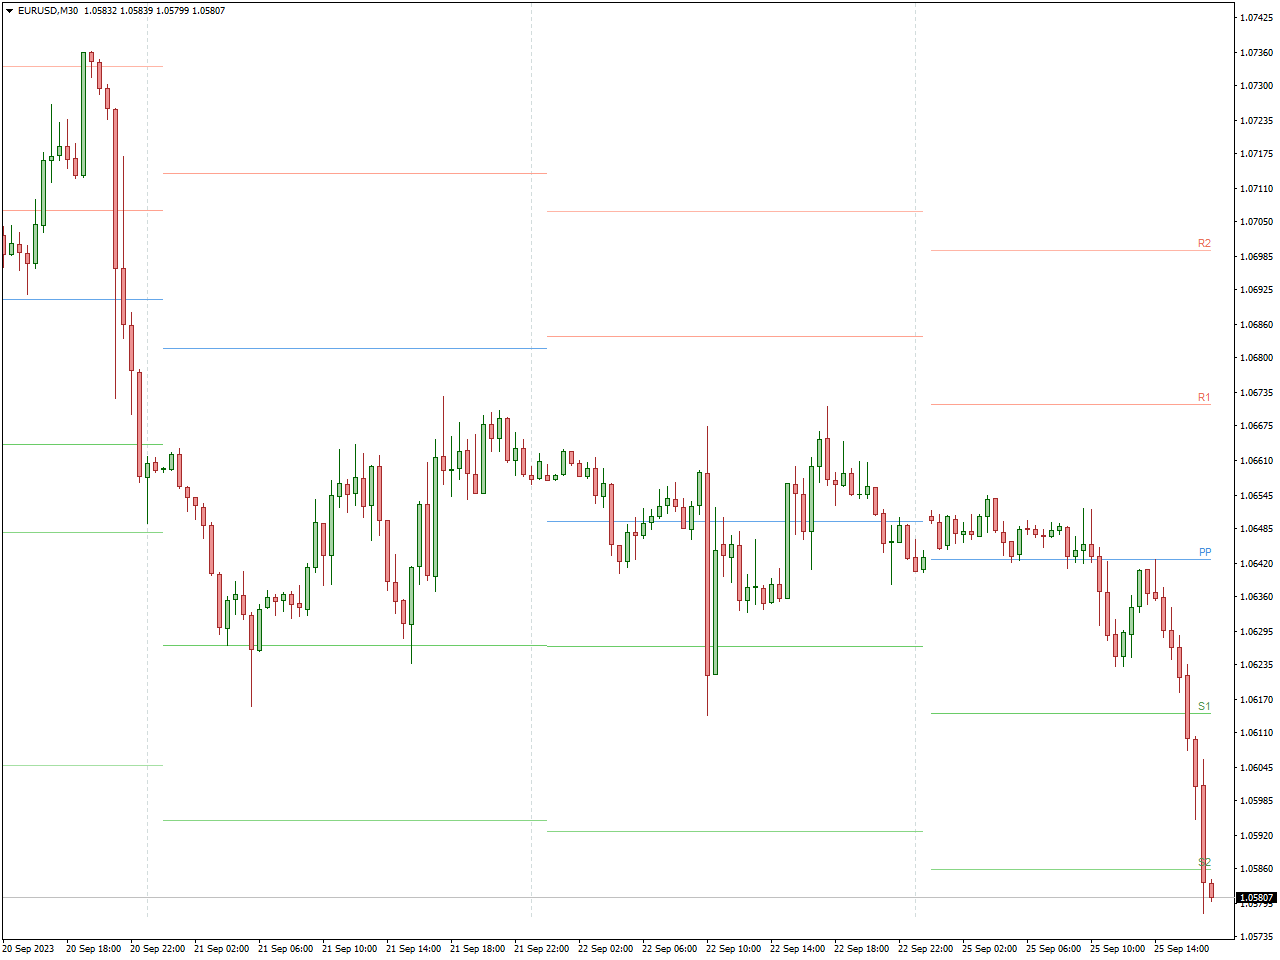
The “PivotPoints All-In-One Indicator” is a comprehensive technical analysis tool used in financial markets, including the forex market, to provide traders with various pivot point levels and associated support and resistance levels on a price chart. This indicator simplifies the process of calculating and plotting pivot points, making it a versatile tool for traders.
The primary function of this indicator is to calculate and display different types of pivot points. These include the Classic Pivot Points, Camarilla Pivot Points, Woodie Pivot Points, and Fibonacci Pivot Points. The PivotPoints All-In-One Indicator often provides the ability to calculate and display pivot points and associated levels for various timeframes, including daily, weekly, monthly, and more.
Pivot points can be used as part of various trading strategies, such as breakout trading, range trading, or trend following. Traders use pivot points to identify potential entry, exit, and stop-loss levels.
Fibonacci Based Moving Averages Indicator
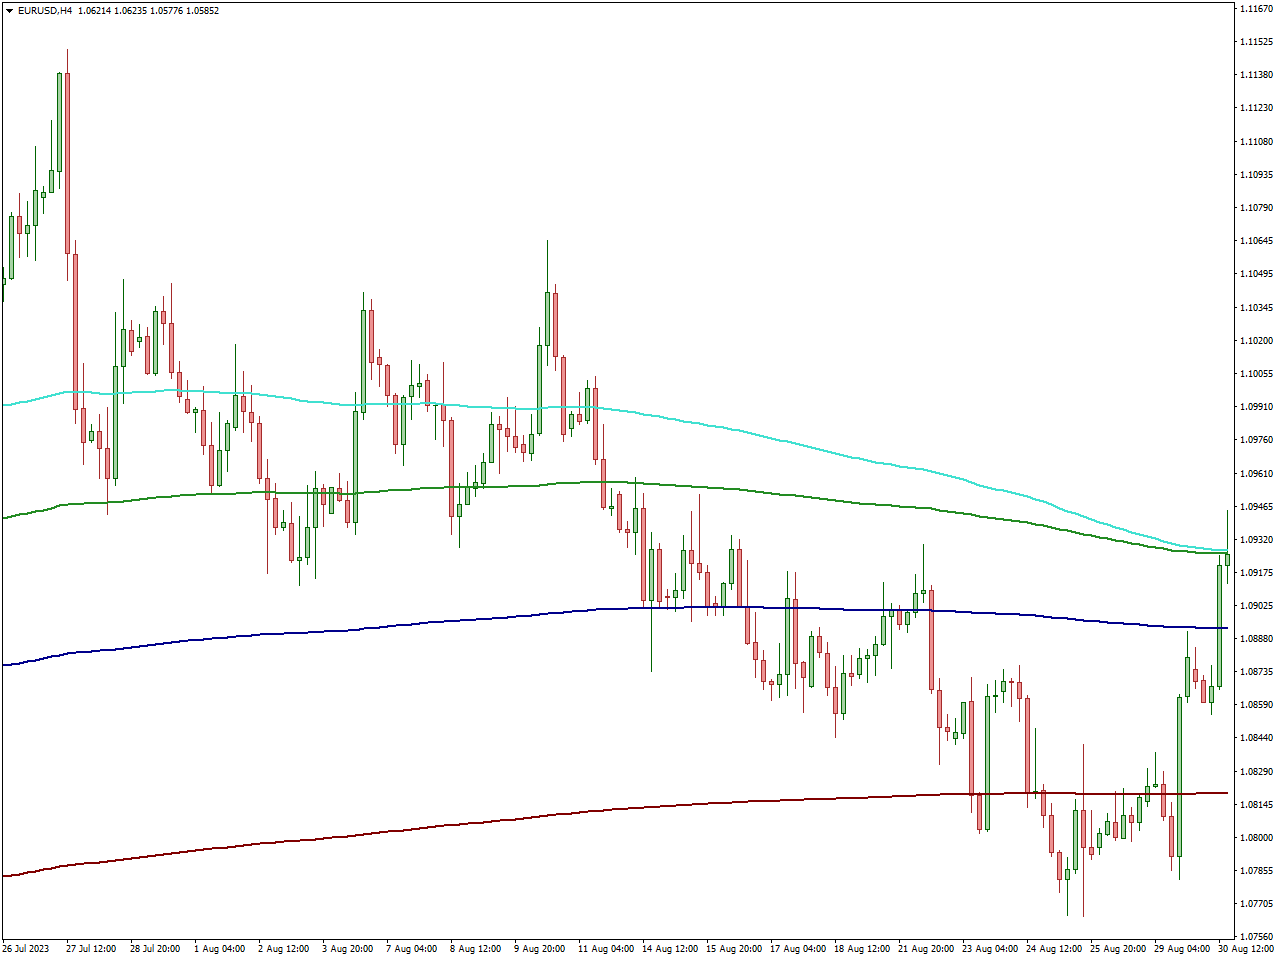
The Fibonacci-Based Moving Averages Indicator is a technical analysis tool used in financial markets, including the forex market, to provide traders with moving averages that are based on Fibonacci ratios. This indicator combines two essential technical analysis concepts: moving averages and Fibonacci retracement levels.
Traders use the indicator to identify trends in the market. The Fibonacci-based moving averages help traders gauge the strength and direction of the trend by considering Fibonacci levels in the calculation.
The Fibonacci-Based Moving Averages Indicator is a valuable tool for traders who want to incorporate both Fibonacci analysis and moving averages into their trading strategies. It helps identify trends, potential reversal points, and dynamic support/resistance levels.
Auto Fibonacci Fan Indicator
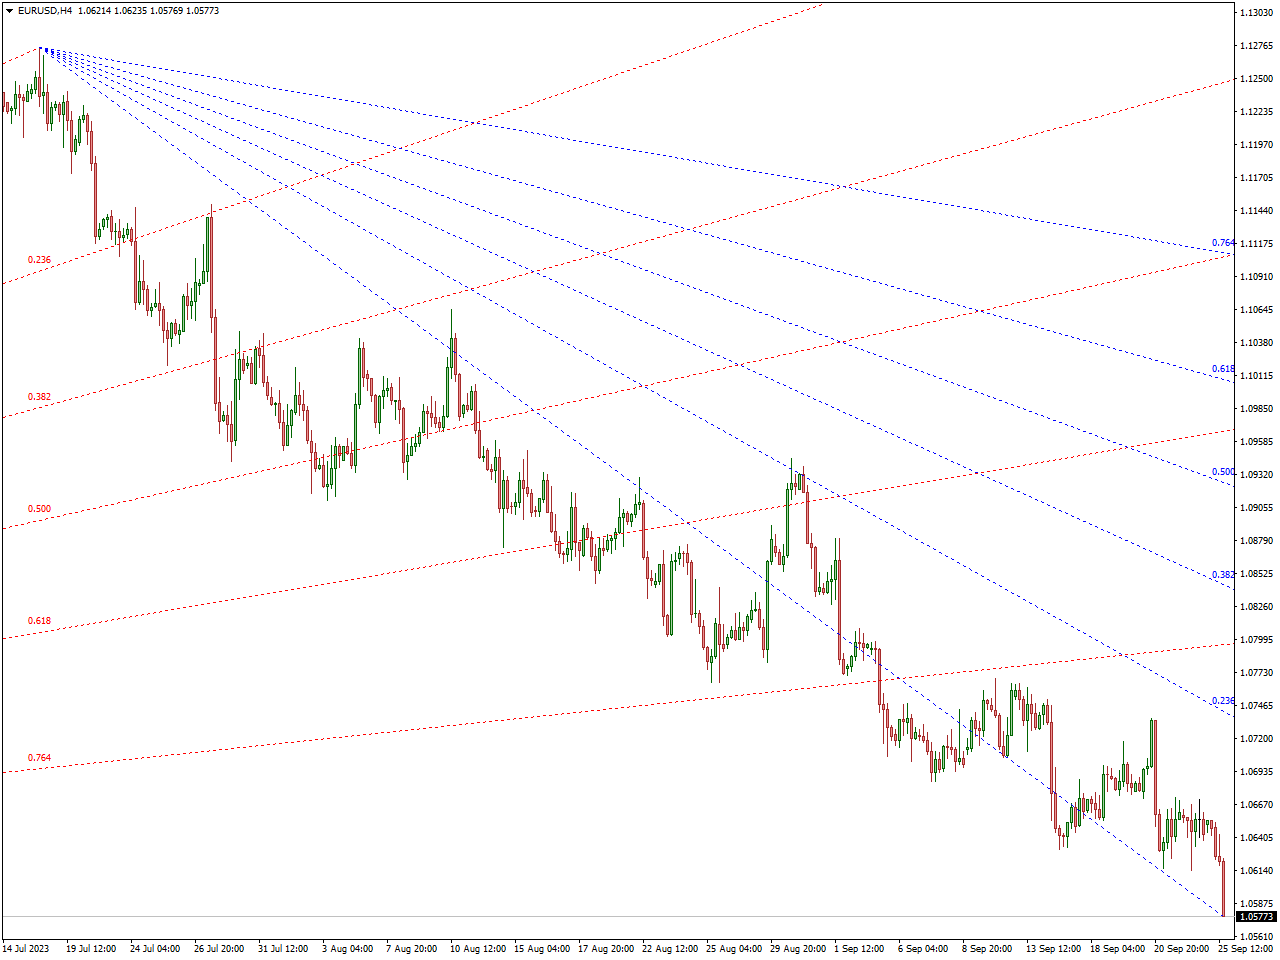
The Auto Fibonacci Fan Indicator is a technical analysis tool used in financial markets, including the forex market, to automatically plot Fibonacci fan lines on a price chart. These fan lines are based on Fibonacci retracement levels and help traders identify potential support and resistance levels as well as price trends.
The primary function of the Auto Fibonacci Fan Indicator is to automatically calculate and draw Fibonacci fan lines on the price chart. It selects a starting point, typically a significant swing high or swing low, and then plots diagonal lines that radiate outward at specific angles corresponding to Fibonacci retracement levels.
Traders may use the indicator to identify potential entry and exit points for their trades. The interaction between price and the fan lines can signal potential trade opportunities.
Elliot Fibonacci Indicator
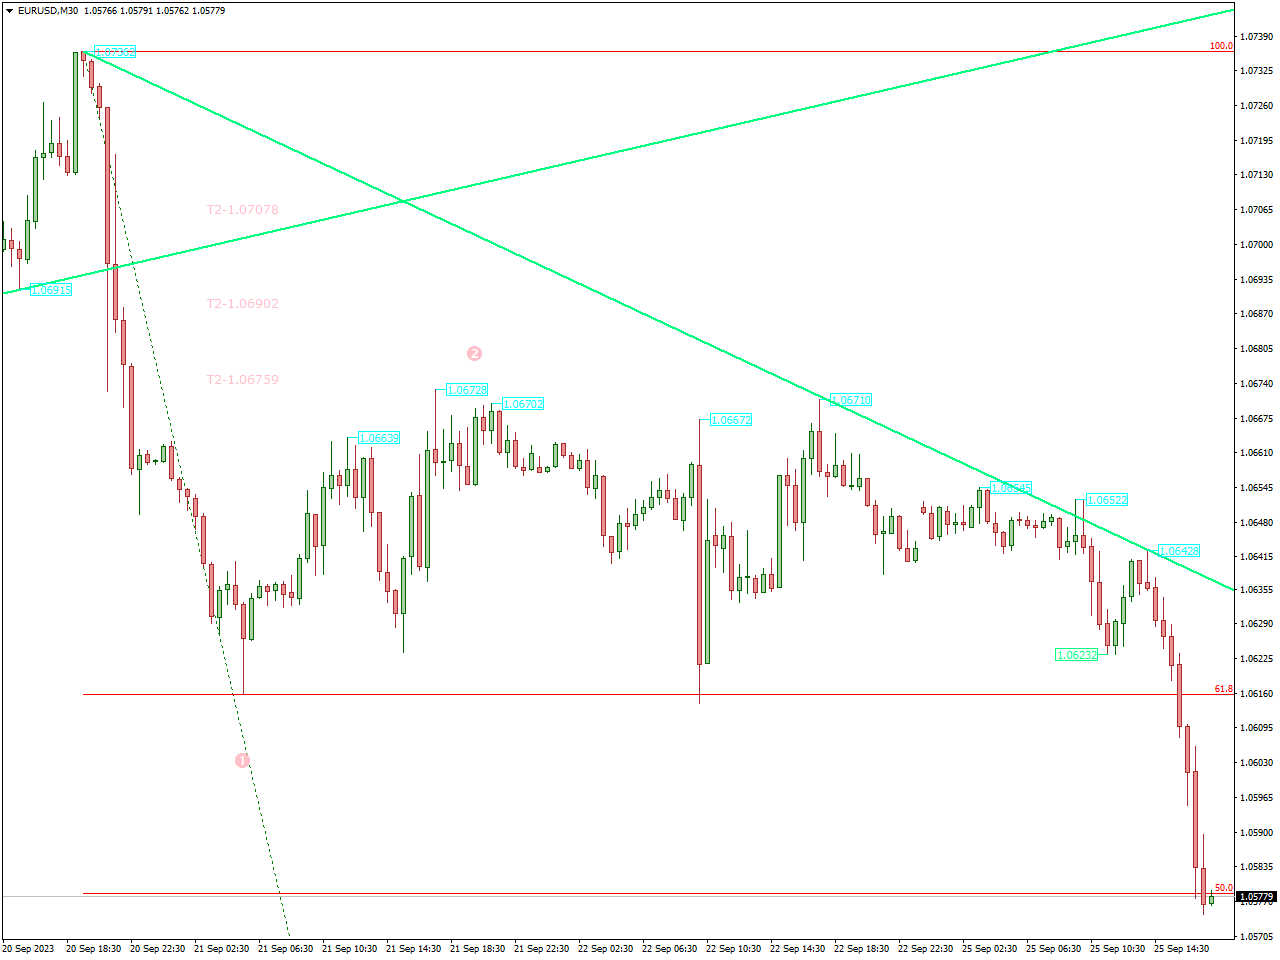
The Elliott Fibonacci Indicator is a technical analysis tool that combines two popular trading methodologies: Elliott Wave Theory and Fibonacci retracement levels. This indicator is used in financial markets, including the forex market, to assist traders in identifying potential price reversal and continuation points based on the Elliott Wave principle and Fibonacci ratios.
Elliott Wave Theory is a technical analysis methodology aimed at forecasting future price movements by recognizing repetitive patterns in market price charts. It categorizes price actions into impulsive waves (representing trends) and corrective waves (indicating counter-trends). The indicator builds upon this theory as a fundamental basis for its analysis.
The Elliott Fibonacci Indicator is a powerful tool for traders who combine Elliott Wave analysis with Fibonacci retracement levels in their trading strategies. It assists in identifying potential turning points and trend confirmation.
Conlusion
The world of forex trading is a dynamic and complex landscape where precision can make all the difference. Throughout this comprehensive guide, we’ve explored the top 20 best Fibonacci indicators that can serve as invaluable tools for traders seeking to decode market movements with accuracy.
These indicators, rooted in the timeless principles of Fibonacci analysis, offer traders a range of strategies to identify potential support and resistance levels, anticipate price targets, and navigate retracements. Whether you’re a seasoned trader looking to refine your approach or a newcomer eager to harness the power of Fibonacci indicators, the key takeaway is clear: precision in forex trading is within reach.
As you embark on your trading journey armed with these Fibonacci tools, remember that success requires not only the right tools but also discipline, practice, and a comprehensive trading plan. By integrating these indicators into your strategy and continuously honing your skills, you can unlock the market precision needed to thrive in the world of forex trading. Happy trading, and may your endeavors be marked by accuracy and profitability.

