
The Stoch Rainbow Indicator is a useful and popular free Forex indicator for MT4 trading platforms. It is based on the Stochastic Oscillator and Rainbow MA indicators, and is designed to help traders identify potential entry and exit points in the Forex market. The Stoch Rainbow Indicator displays the Stochastic Oscillator as a histogram, with the Rainbow MA plotted as a line. The indicator is easy to use and can be used on any timeframe. The Stoch Rainbow Indicator works by measuring the momentum of price movements, and then plotting the results as a histogram. When the histogram is above the Rainbow MA line, it indicates that the market is in an uptrend. Conversely, when the histogram is below the Rainbow MA line, it indicates that the market is in a downtrend. The Stoch Rainbow Indicator can also be used to identify potential entry and exit points in the Forex market. The indicator is available for free on MT4 trading platforms, making it a popular choice among traders.
MT4


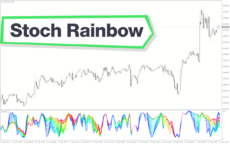
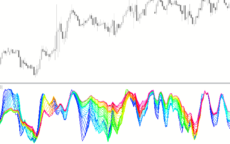
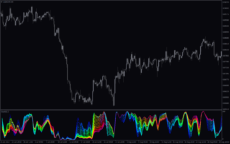
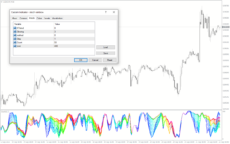
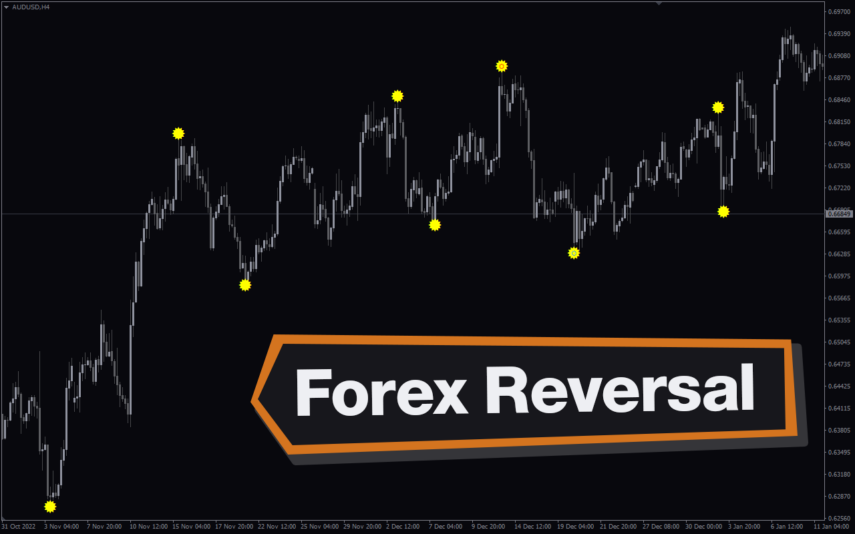
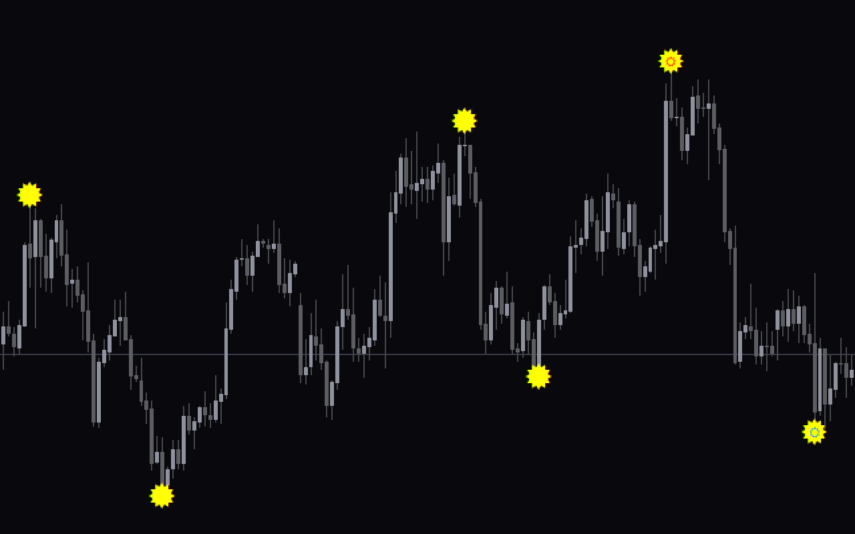
Stoch Rainbow
The Stoch Rainbow Indicator is a popular and free Forex indicator for MT4 which can be used by traders to identify potential buy and sell signals. This useful indicator is based on the Stochastic Oscillator and uses the rainbow to represent the overbought and oversold levels. It is a popular indicator and can be a great tool for traders looking to make the most of their Forex trading.
| Trading Style | , |
|---|---|
| Indicator Type | |
| Timeframe | |
| Platform |
0
People watching this product now!
Downloads - 9
Description
Reviews (0)
How to Install
Related products
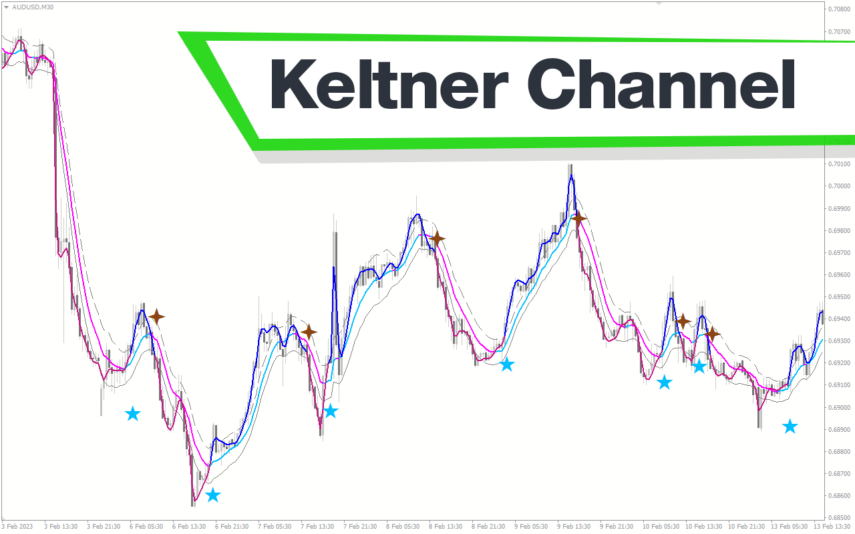
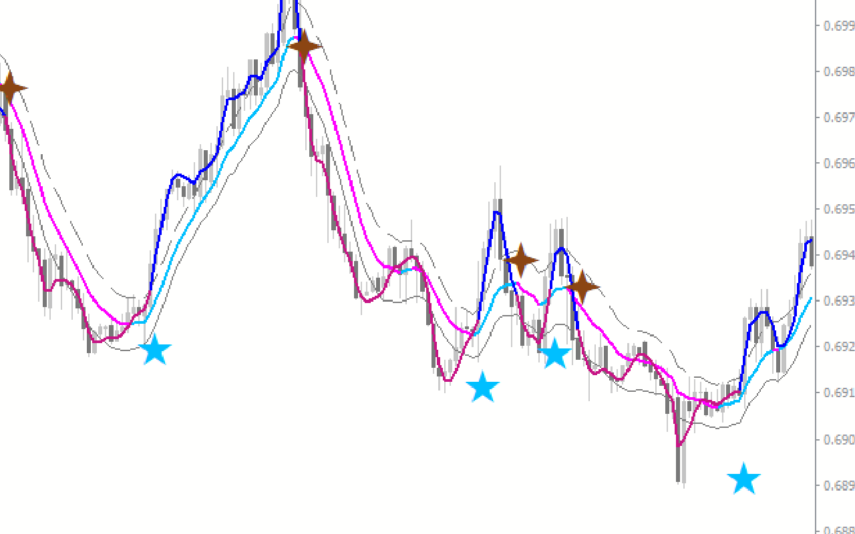
Keltner Channel With Signals
The Keltner Channel with Signals Indicator is a popular and free forex indicator that runs on the MT4 platform. This is a new and innovative tool that uses the Keltner Channel as the basis for generating trading signals, helping traders identify potential trading opportunities. Use the Keltner Channel with Signals Indicator as a powerful tool that can help traders succeed in the forex market.
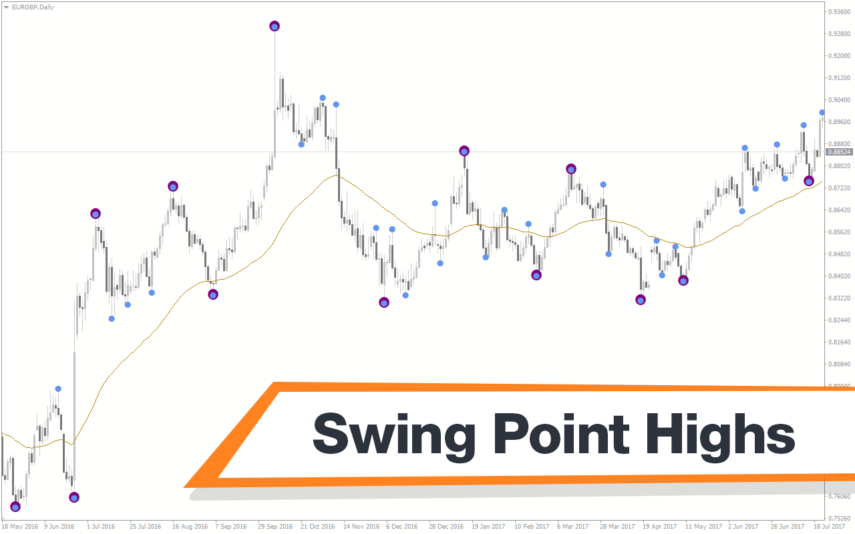
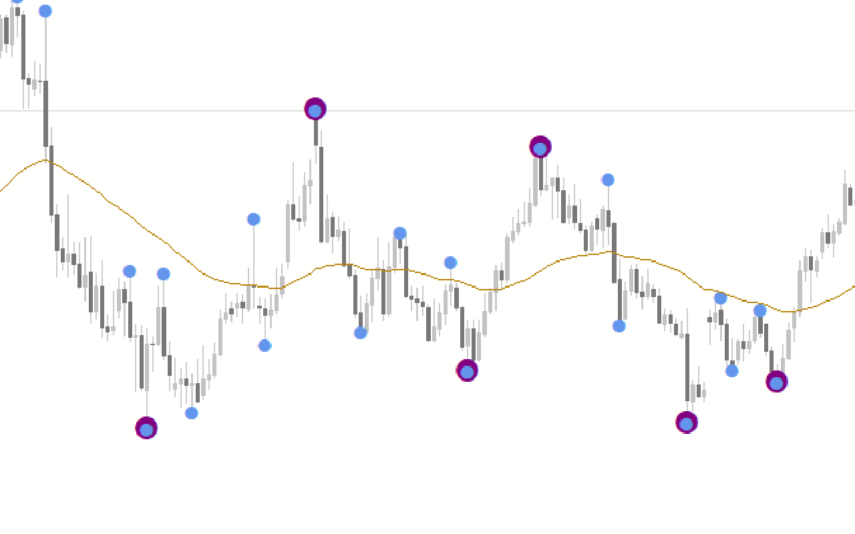
Swing Point Highs
The Swing Point Highs and Lows indicator is a new, popular and free MT4 technical analysis tool for forex traders. This indicator works by identifying swing points on a price chart and then drawing horizontal lines to indicate potential support and resistance levels. The swing point high and low indicator is a valuable tool for traders who want to identify key support and resistance levels and is suitable for both beginners and experienced traders.
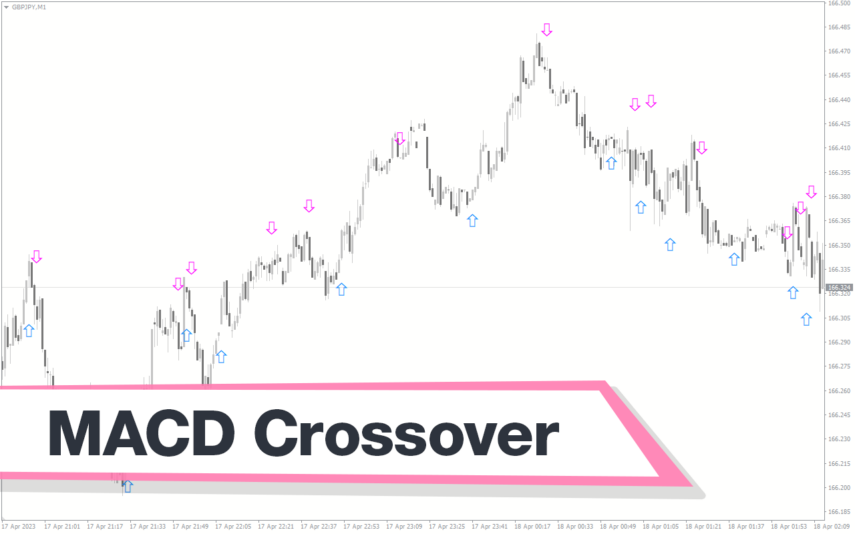
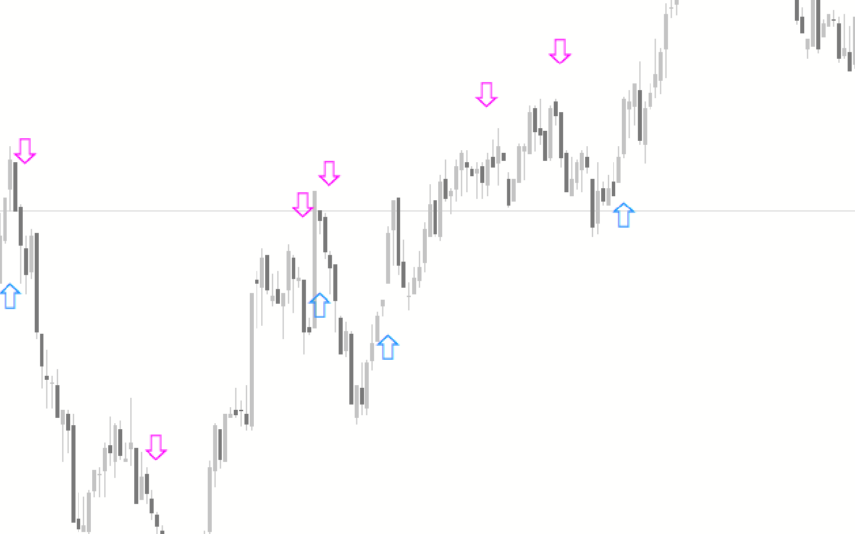
MACD Crossover Arrows & Alert
The MACD Crossover Arrows Alert indicator is a useful and free forex indicator for the MT4 trading platform. This indicator is designed to detect and signal bullish and bearish moving average convergence-divergence (MACD) indicator crossover signals. It draws arrows on the chart to indicate the direction of the trend, making it easier for traders to identify trading opportunities. The MACD Crossover Arrows Alert indicator is a popular and free tool for Forex traders of all skill levels.
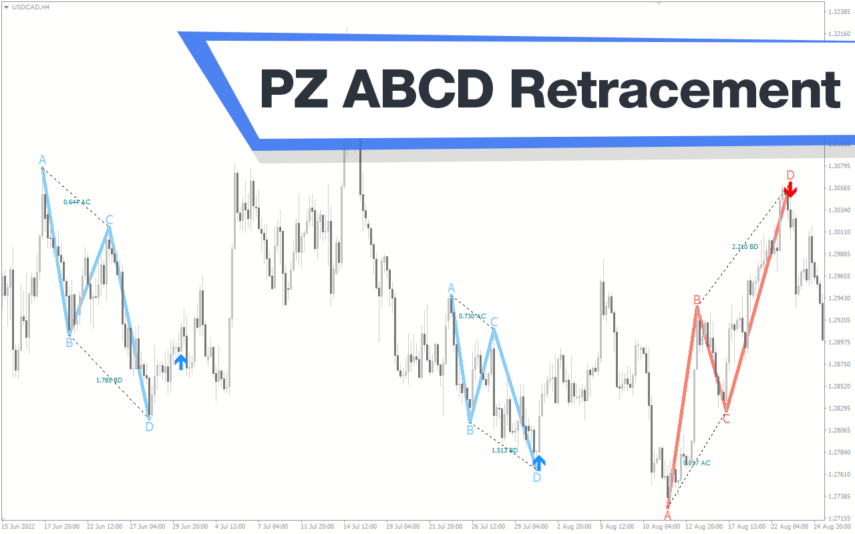
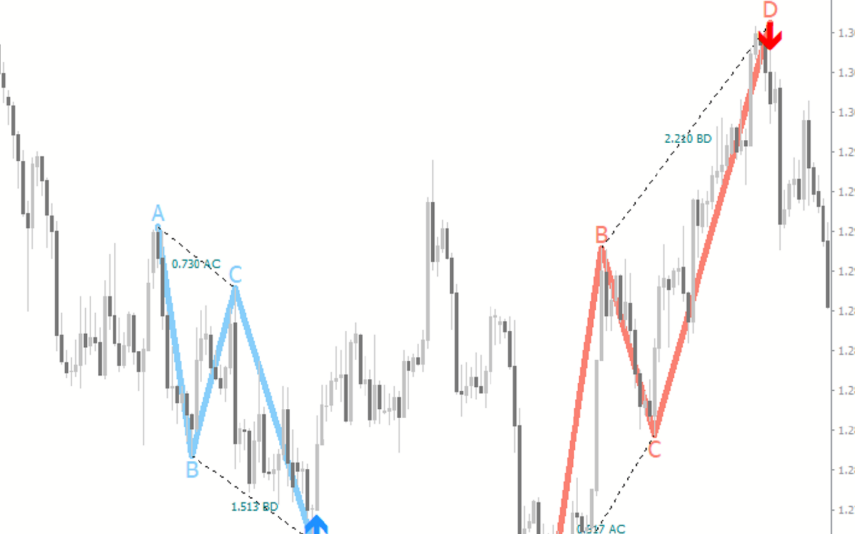
PZ ABCD Retracement
The PZ ABCD Retracement Indicator is a popular and free forex indicator for MT4 that helps traders identify potential trading opportunities by identifying the AB=CD harmonic pattern. The indicator automatically plots Fibonacci retracement levels to help traders identify entry and exit points. It works by scanning the market for the AB=CD pattern and drawing the necessary lines and levels. It can be used by both a novice and an experienced trader, making it a versatile tool for traders who want to improve their trading results.
Reviews
There are no reviews yet.