Features of the High Low Close Previous Day Indicator
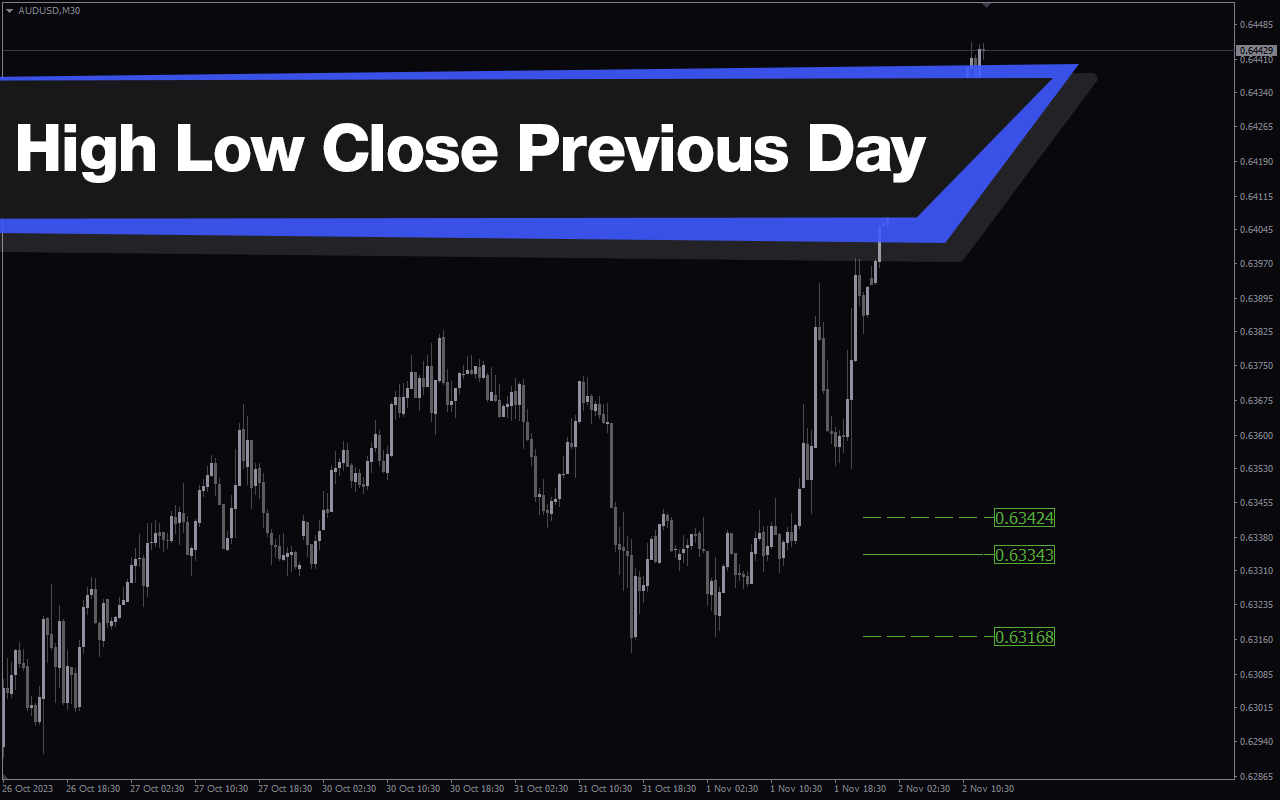
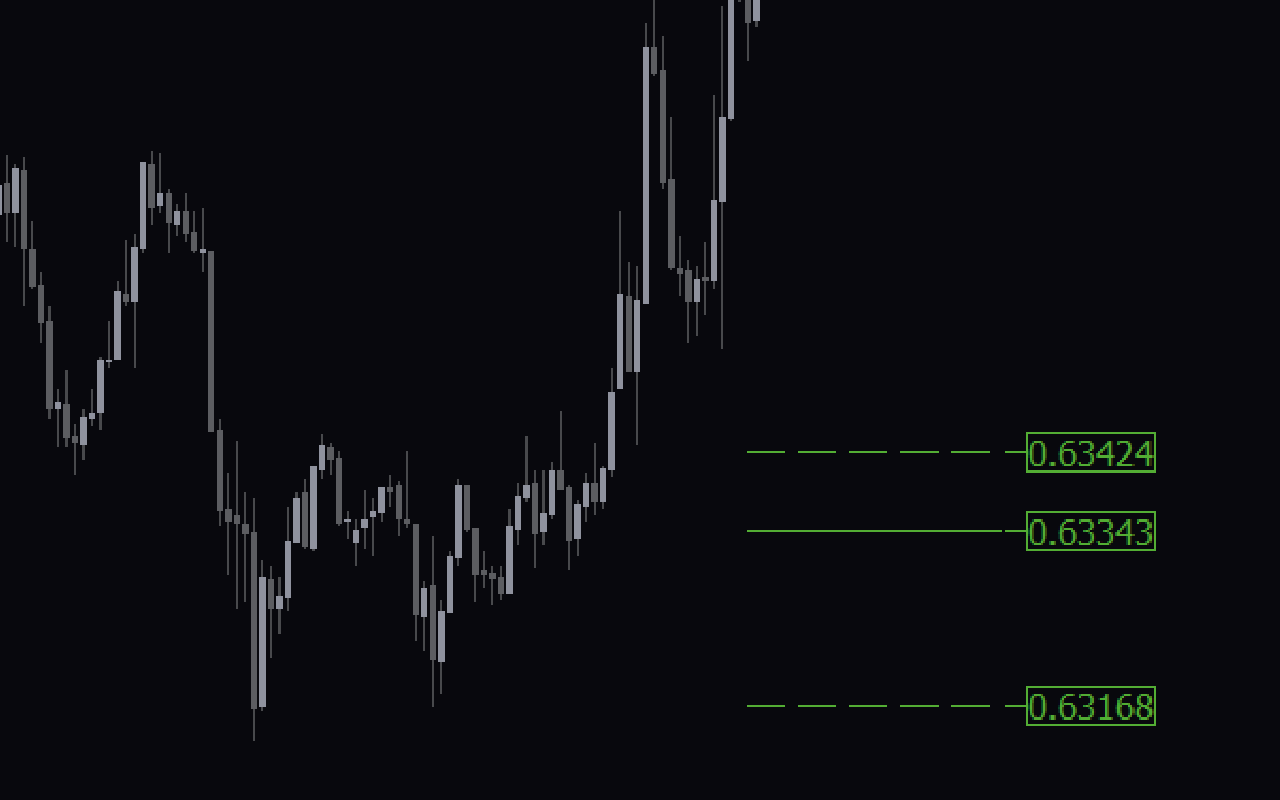
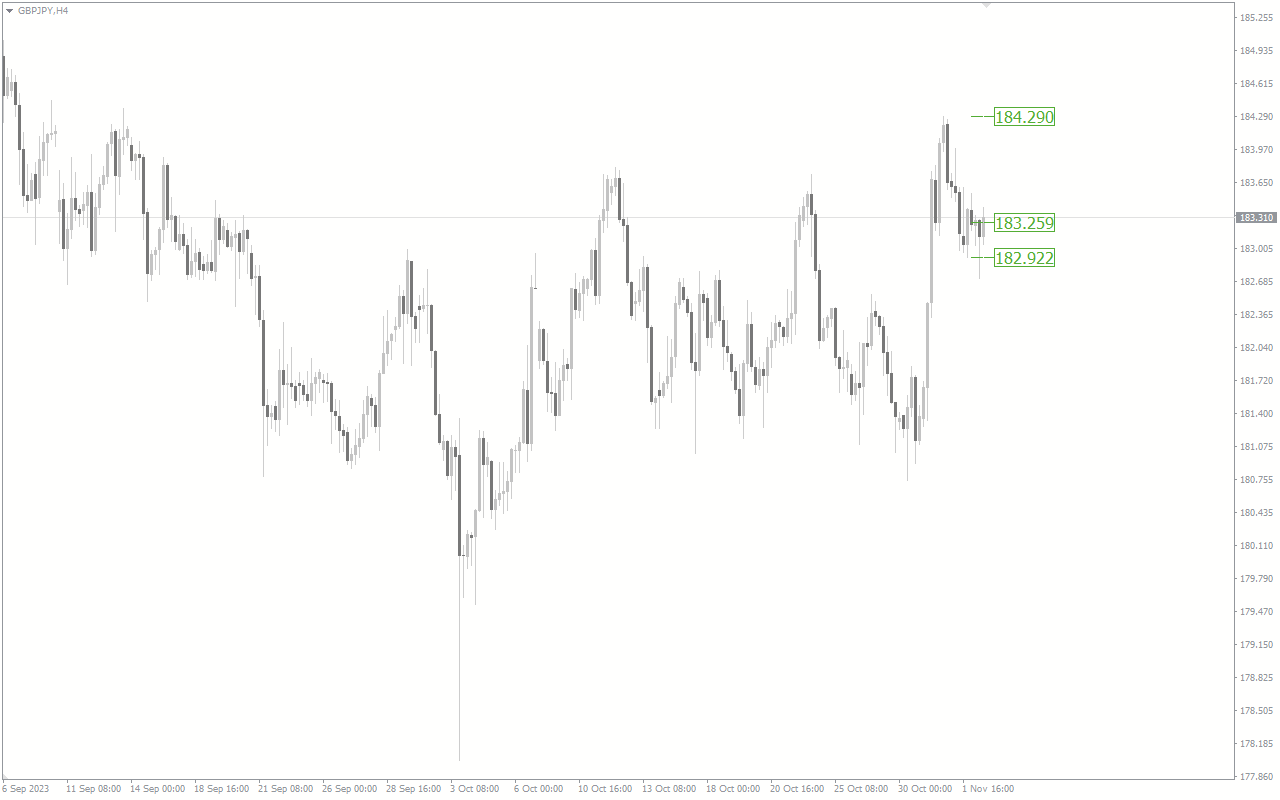
Once you install the High Low Close Previous Day Indicator, it displays three horizontal lines on your chart:
The first horizontal line shows the previous day’s high price. The second horizontal line shows the previous day’s low price. The third line represents the previous day’s close price. These lines can act as support and resistance areas.
How the Indicator Can Benefit You
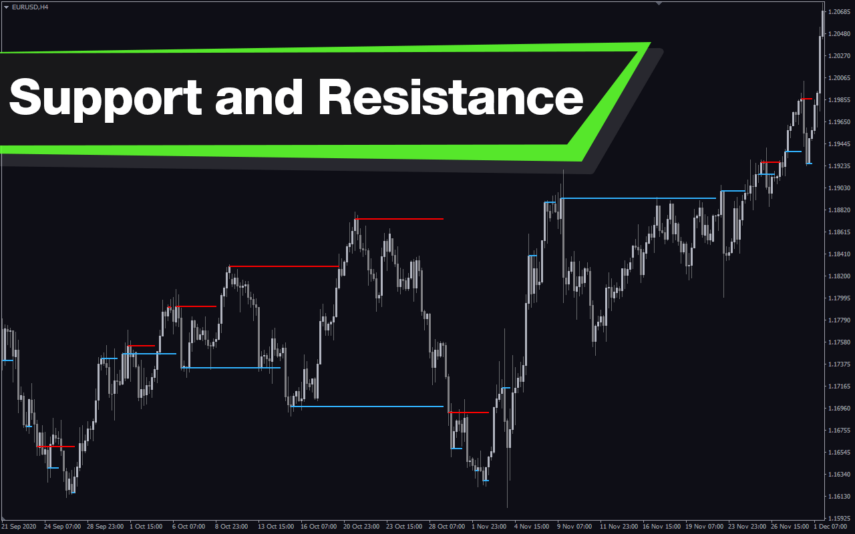
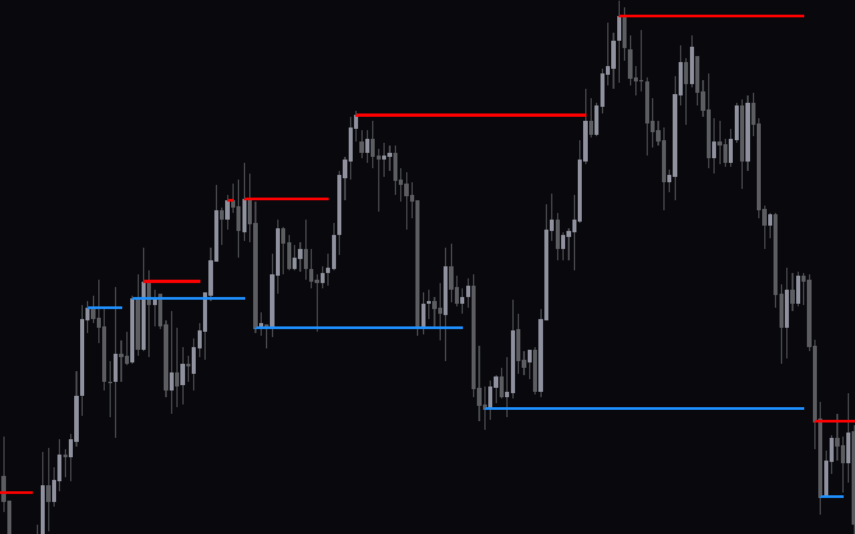
You can use the indicator to identify support and resistance areas on the chart. These areas can have a great effect on the price. Moreover, you can use these levels as profit targets or stop-loss levels.
Indicator Setting Description
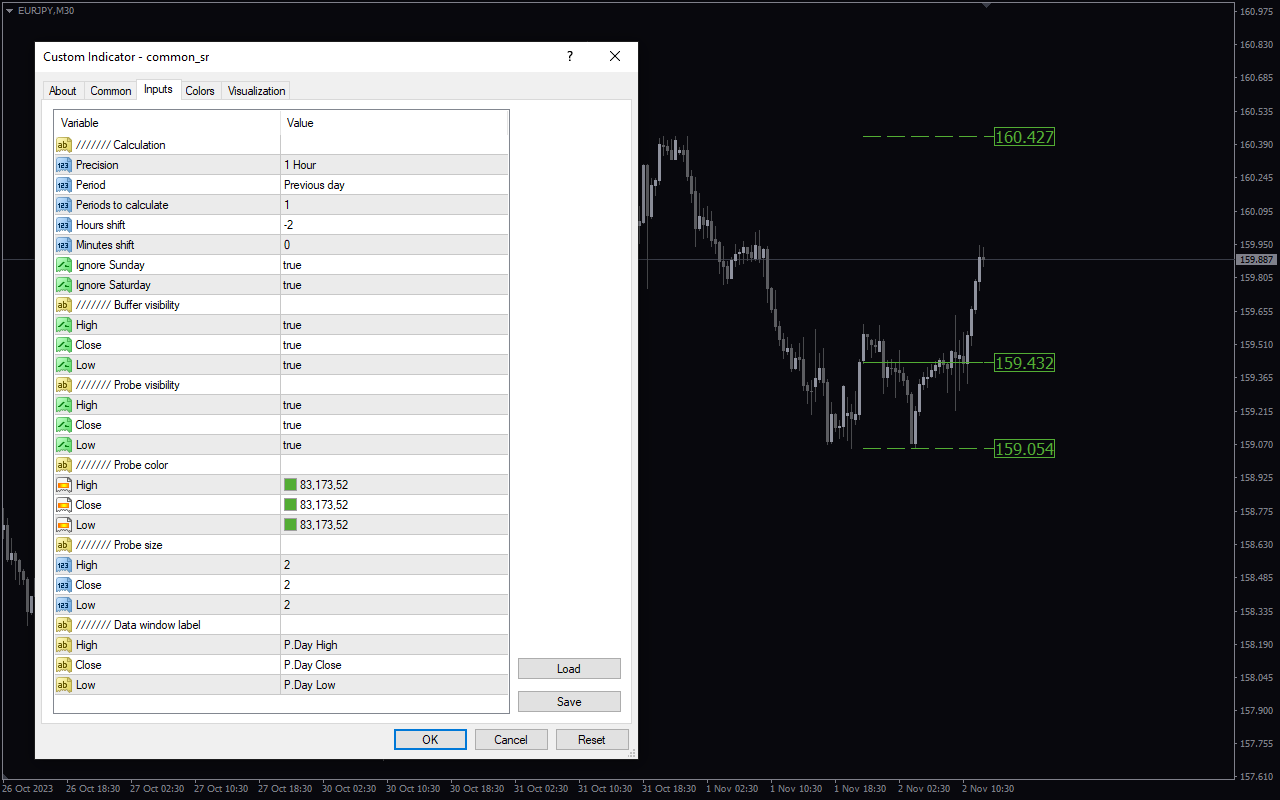
Precision: This input allows you to determine how precise the indicator is.
Period: This input allows you to choose the period the indicator will use.
Periods to calculate: This input allows you to choose the number of periods the indicator will use to calculate.
Hours shift: This input allows you to choose the hours shift.
Minutes shift: This input allows you to choose the minutes shift.
Ignore Sunday: This input enables/ disables the inclusion of Sundays.
Ignore Saturday: This input enables/ disables the inclusion of Saturdays.
Buffer Visibility: This section allows you to determine when the buffer becomes visible. Whether on the high, close or low of a candle.
Probe visibility: This section lets you determine when the probe becomes visible. Whether on the high, close or low of a candle.
Prob color: This section allows you to select the probe color on the candle’s high, low and close.
Probe size: This section allows you to select the probe size on the candle’s high, low and close.
Data window lable: This section allows you to change the data window label on the candle’s high, low and close.



Reviews
There are no reviews yet.