
The Bollinger Bands GI Stochastic Indicator is a useful and popular tool for Forex traders. It is available for free on the MT4 platform and is designed to help traders identify entry and exit points. The indicator uses Bollinger Bands, a volatility based indicator, to measure the price range of an asset and the Stochastic Oscillator to identify potential trading opportunities. The Bollinger Bands GI Stochastic Indicator is a trend-following tool that uses two lines, one representing the mid-point of the Bollinger Bands and one representing the Stochastic Oscillator. When the mid-point line crosses above the Stochastic Oscillator line, it is a signal to buy. When the mid-point line crosses below the Stochastic Oscillator line, it is a signal to sell. The Bollinger Bands GI Stochastic Indicator is a great tool for traders who are looking for an easy way to identify entry and exit points. It is especially useful for traders who are new to the Forex market and are looking for a reliable way to make profitable trades. The indicator is easy to use and can be used in combination with other technical indicators to help traders maximize their profits.
MT4


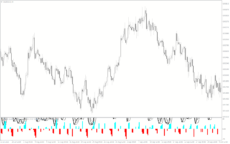
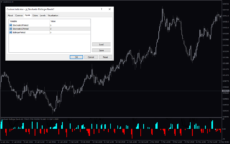
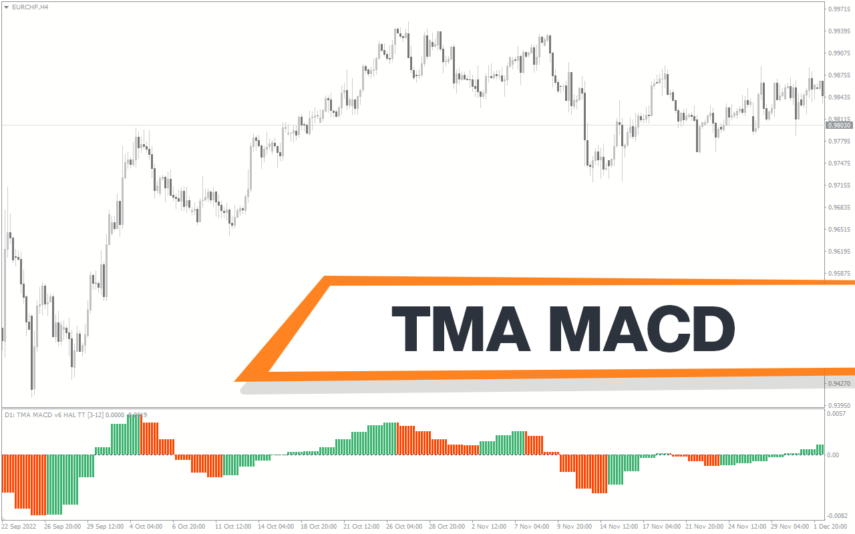
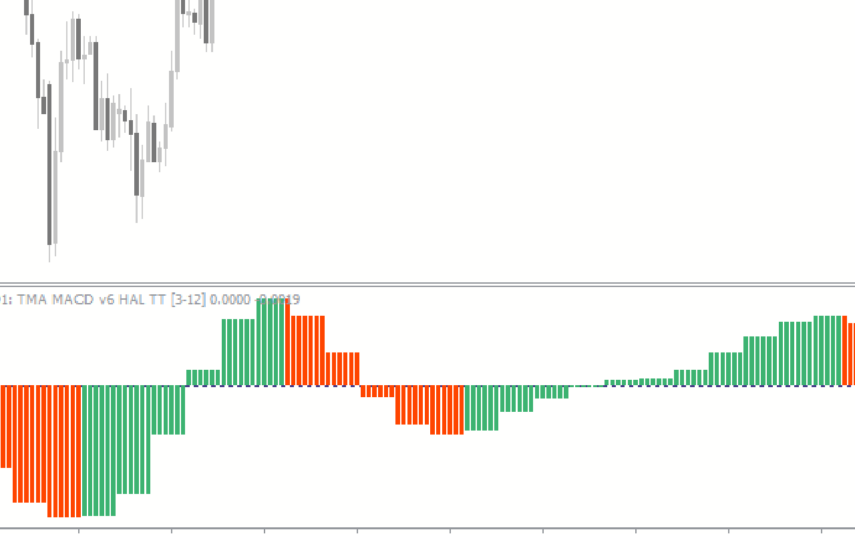
Bollinger Bands Gi Stochastic
The Bollinger Bands GI Stochastic Indicator is a powerful and useful Forex indicator for MT4 traders. It is a popular indicator that helps traders to identify market trends and potential trading opportunities. The Bollinger Bands GI Stochastic Indicator is a useful tool for any Forex trader as it helps to identify potential trading opportunities and can help to improve trading results.
| Timeframe | , |
|---|---|
| Trading Style | |
| Platform | |
| Indicator Type |
0
People watching this product now!
Downloads - 43
Description
Reviews (0)
How to Install
Related products
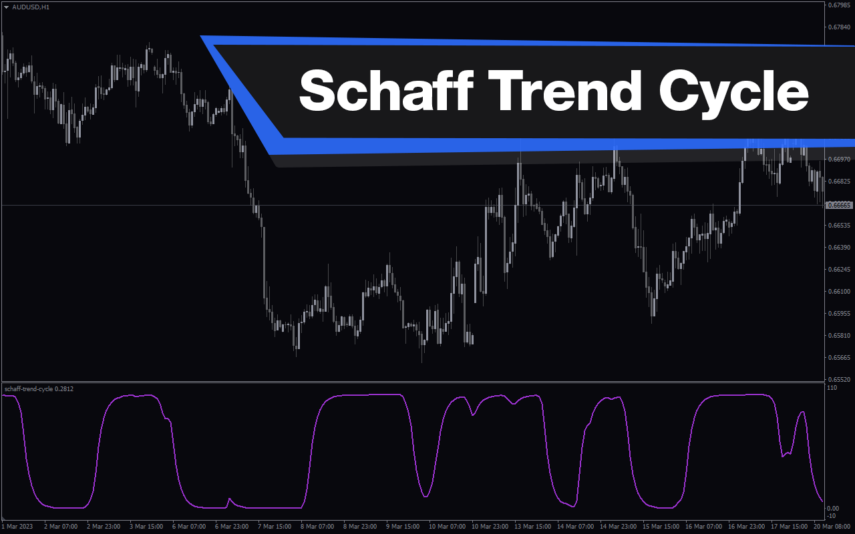
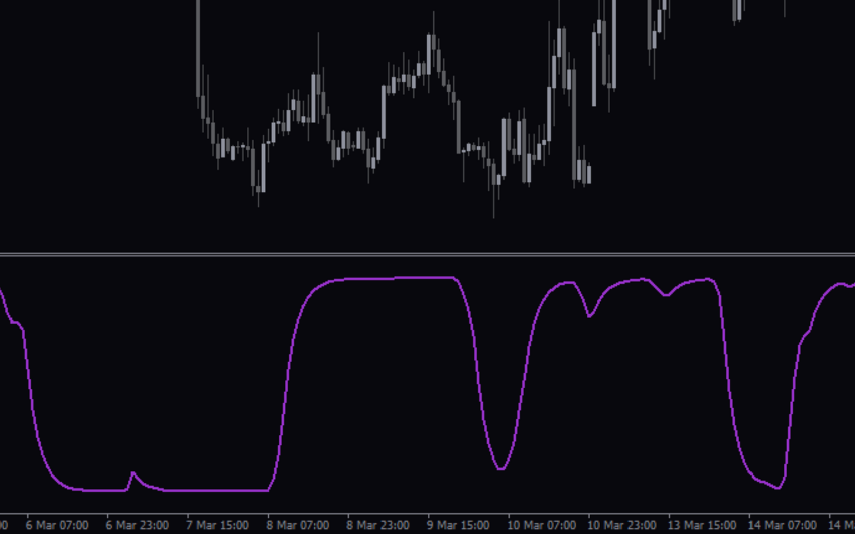
Schaff Trend Cycle
The Schaff Trend Cycle indicator is a popular forex indicator for MT4, which determines market trends with high accuracy. Its values range from 0 to 100, with values above 75 indicating overbought and values below 25 indicating oversold. Whether you are a beginner or an experienced trader, the Schaff Trend Cycle indicator will help you make better trading decisions and improve profitability.
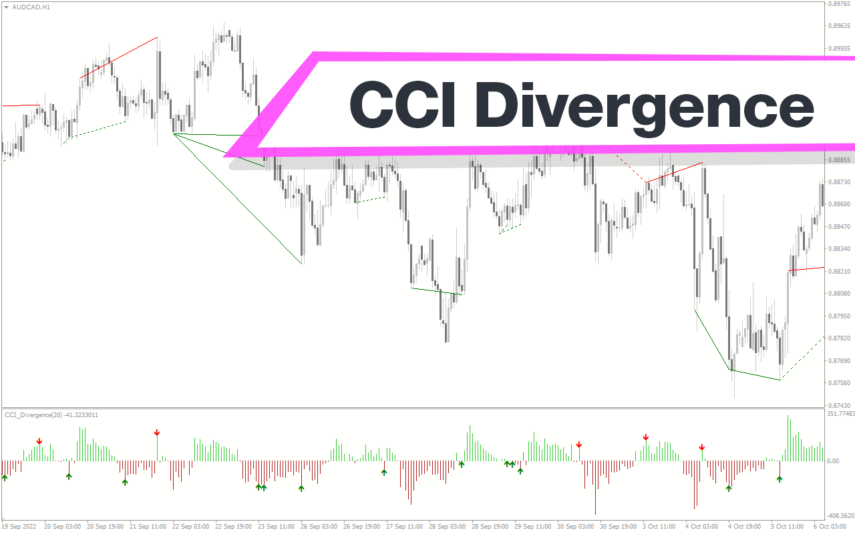
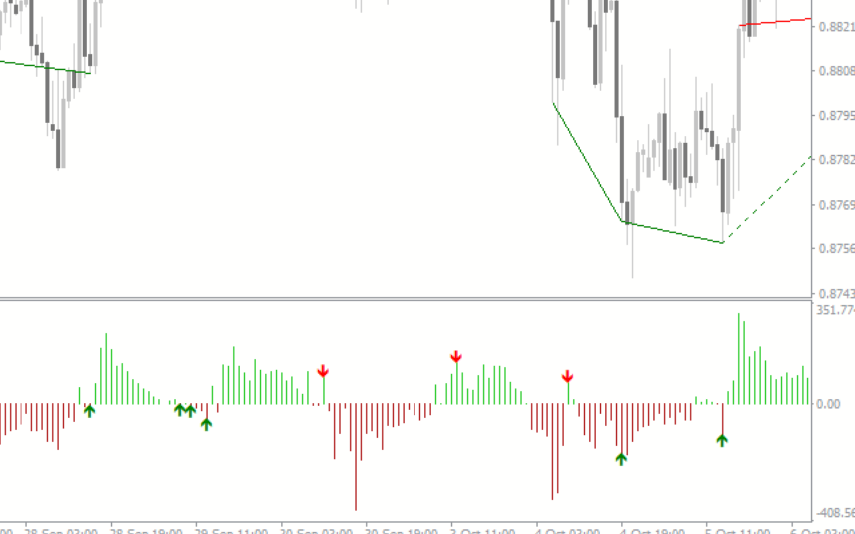
CCI Divergence
The CCI Divergence Indicator for MT4 is a useful and popular free Forex indicator. It is used to identify potential reversals in the market by looking for divergences between price and the Commodity Channel Index (CCI). The indicator uses the CCI to determine when the market is overbought or oversold and when the trend is likely to reverse. It will then plot a divergence line on the chart to indicate potential reversal points. The CCI Divergence Indicator for MT4 is a great tool for traders of all levels and can be used to help traders make more informed decisions.
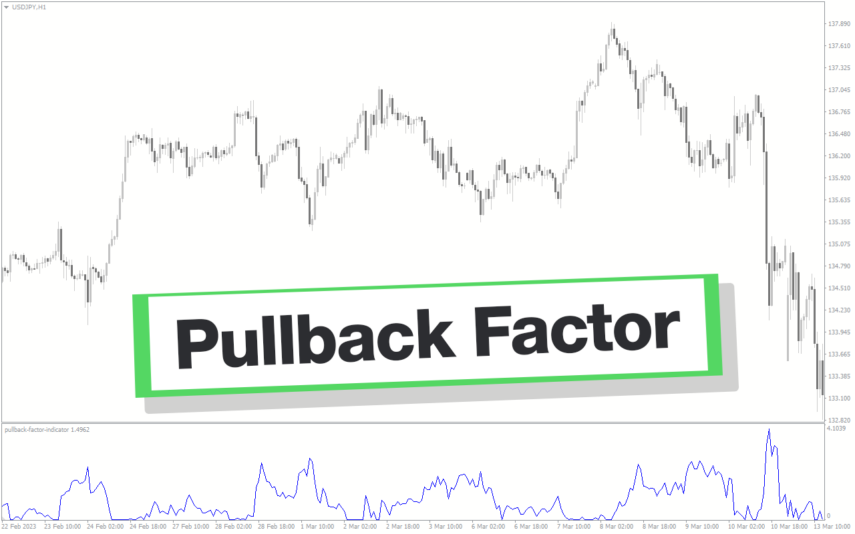
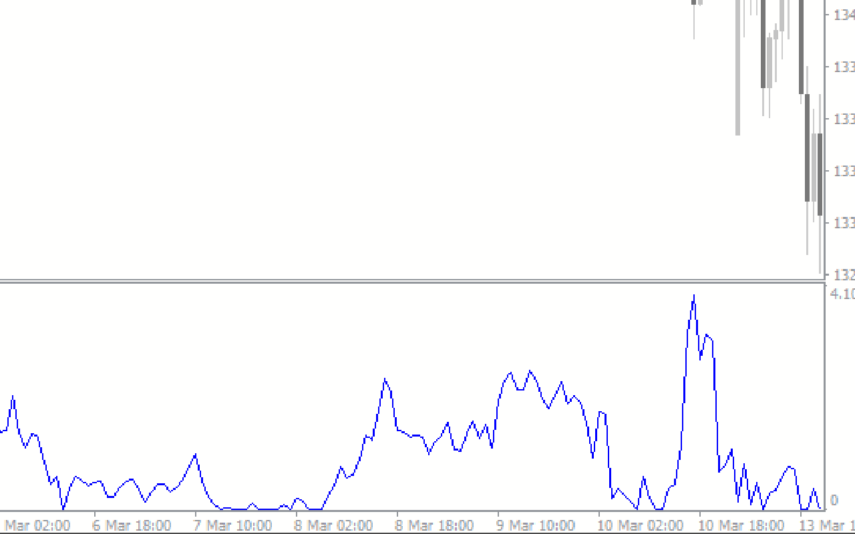
Pullback Factor
Pullback Factor Indicator is a popular and new trend-following indicator designed for use in the forex market. It helps you to identify the end of a trend retracement and the resumption of the trend. With its unique algorithm, the indicator predicts the extent of a trend pullback, enabling traders to enter the market with precision and accuracy.
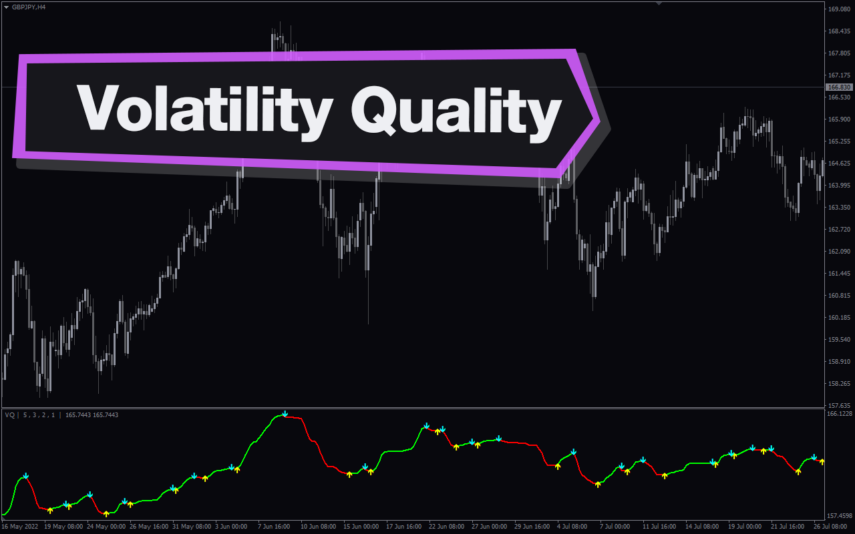
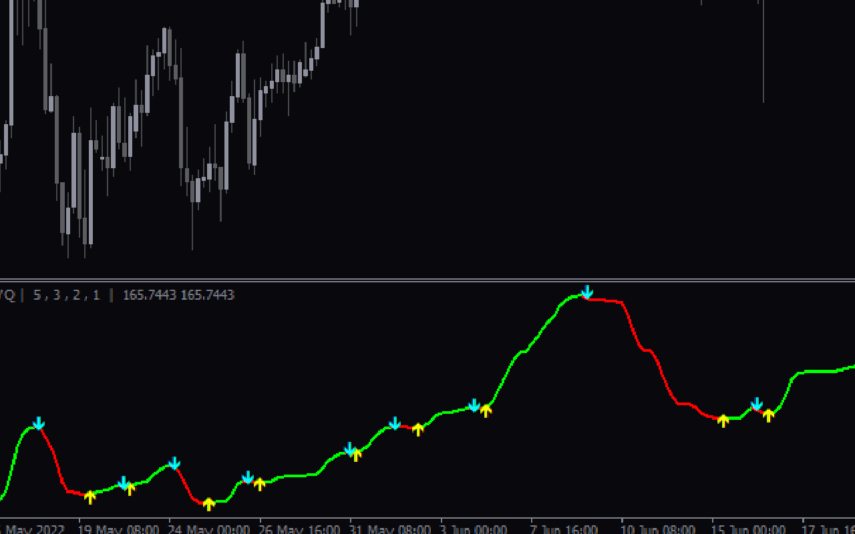
Volatility Quality
The Volatility Quality Indicator is a useful and popular free Forex indicator for MT4 that helps traders identify the best entry and exit points in the market. This indicator is based on the ratio of the price range of a given period to the average true range of the same period. It helps traders determine the quality of the volatility of a currency pair. It is also a great tool for identifying support and resistance levels. The Volatility Quality Indicator is a great way to make informed decisions when trading Forex.
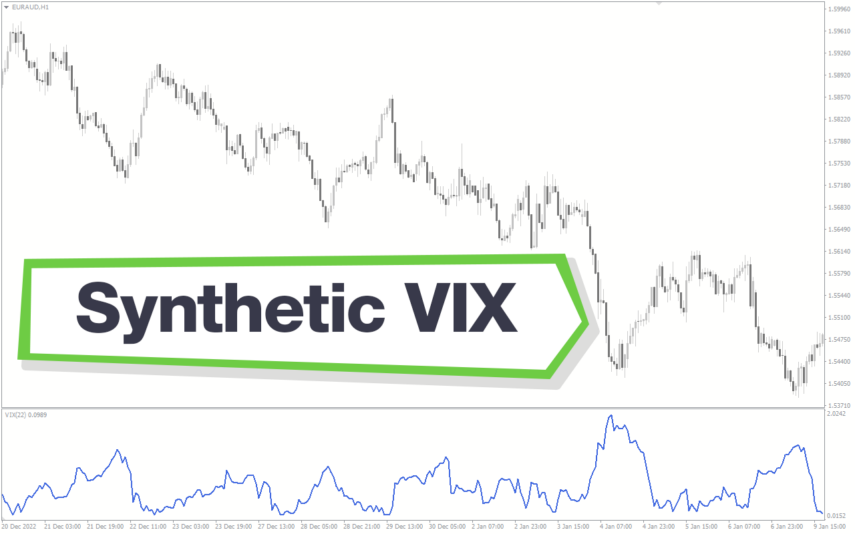
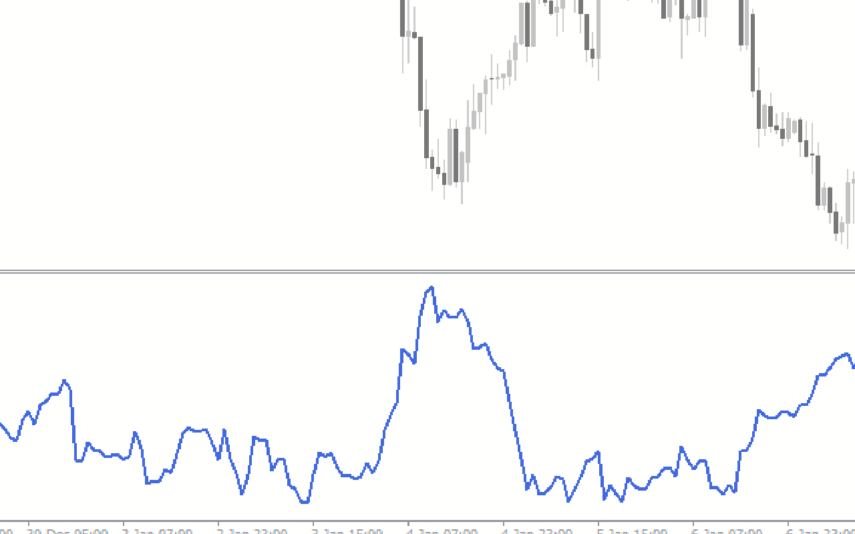
Synthetic VIX
The Synthetic VIX Indicator is a popular and free Forex indicator for the MT4 trading platform. The indicator utilizes a combination of price action and signals from multiple time frames to accurately predict market movements. The Synthetic VIX indicator can be used to identify potential entry and exit points in the market, as well as to identify trend reversals and breakouts. It is designed to provide traders with an easy to use and reliable indicator that can help them make informed trading decisions. With its accurate and reliable signals, the Synthetic VIX Indicator is a great tool for any trader looking to improve their trading performance.
Reviews
There are no reviews yet.