
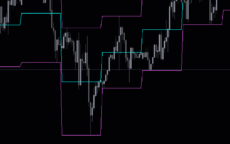
KIS Max Min Avg Indicator is a useful and popular free Forex MetaTrader 4 (MT4) indicator. It is designed to help traders identify the current market conditions and make informed trading decisions. The indicator is based on the idea of calculating the maximum, minimum and average of the price over a given period of time. This helps traders to identify the current market trend and make trading decisions. The KIS Max Min Avg Indicator is very easy to use. All you need to do is to attach the indicator to any chart on your MT4 platform and it will automatically calculate the maximum, minimum and average of the price over the specified period of time. The indicator will then display the values of the maximum, minimum and average in a separate window. This will help traders to identify the current market conditions. The KIS Max Min Avg Indicator is a great tool for traders who want to identify the current market trend and make informed trading decisions. It is a reliable indicator that helps traders to identify the current market conditions and make the right trading decisions. The indicator is available for free on the MT4 platform and can be used by traders of all levels.
MT4


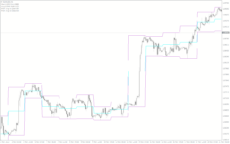
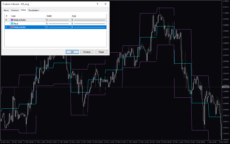
KIS Max Min Avg
The Kis Max Min Avg Indicator is a useful and popular free Forex indicator for the MT4 trading platform. It helps traders identify market trends and make better decisions when trading. The indicator then plots these values on the chart, allowing traders to quickly and easily identify the current trend. It is one of the most popular and reliable indicators available for the MT4 platform and can be used for both short and long-term trading.
| Indicator Type | |
|---|---|
| Trading Style | , |
| Timeframe | , |
| Platform |
0
People watching this product now!
Downloads - 8
Description
Reviews (0)
How to Install
Related products
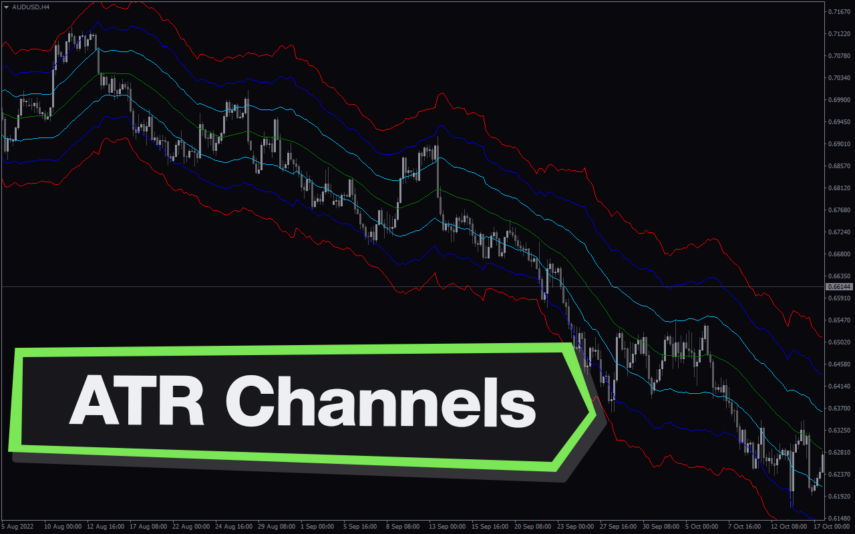
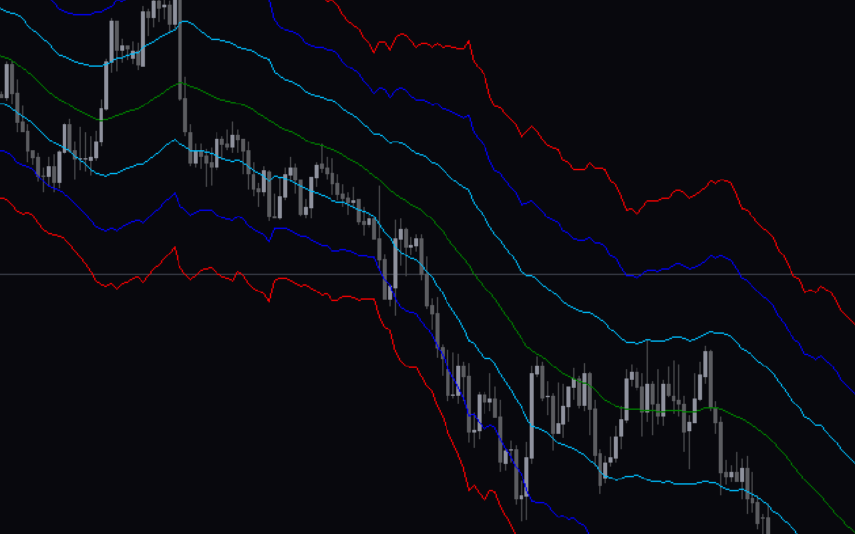
Atr Channels
The ATR Channels Indicator is a useful and popular free Forex indicator for MT4 that helps traders to identify possible areas of support and resistance. It works by plotting two channels around a moving average, with one channel above the moving average and one below. The width of the channels is based on the Average True Range (ATR) of the Forex pair, with the ATR providing an indication of the volatility of the pair. The ATR Channels Indicator is easy to use and can be quickly added to any MT4 chart, making it a popular choice for Forex traders.
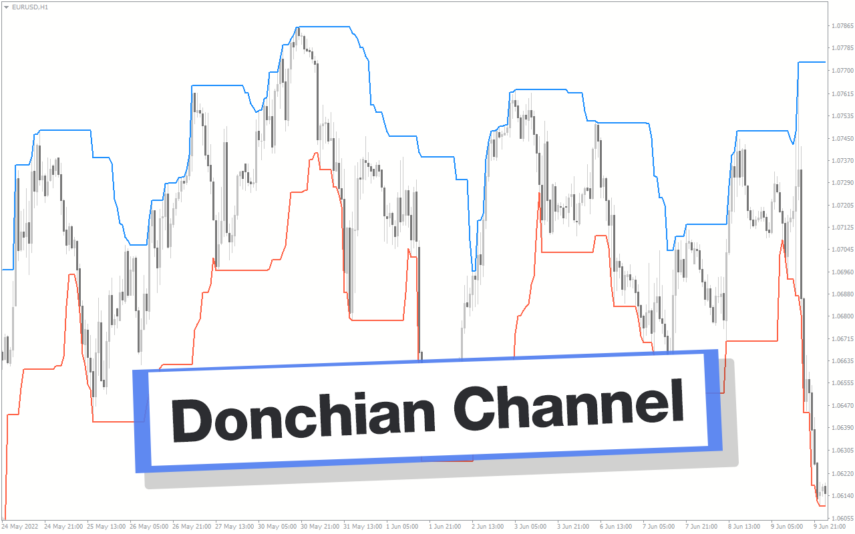
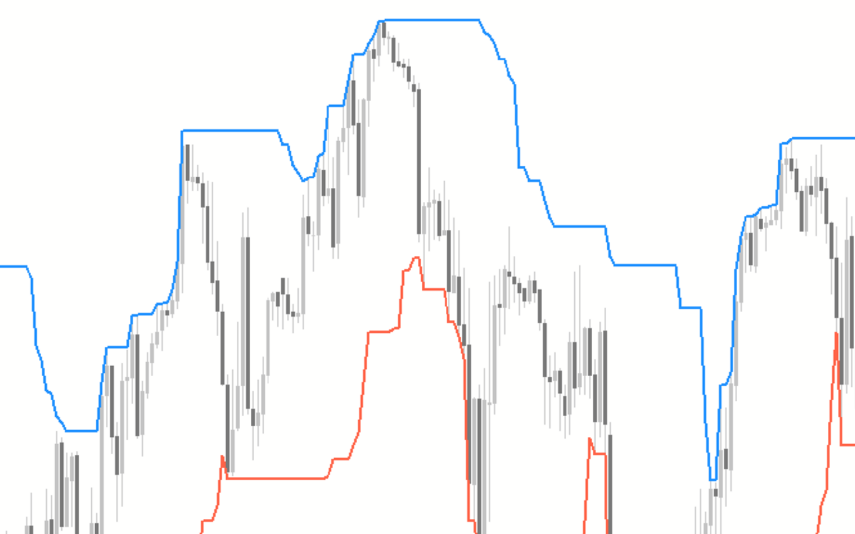
Donchian Channel
The Donchian Channel Indicator is a popular forex indicator that is widely used by forex traders to determine trend direction as well as entry and exit points designed to be used in the forex market with the MT4 platform. This indicator is very popular among traders because of its simplicity and efficiency, it works by determining the high and low of the price for a certain period and plotting a channel based on these values. The Donchian Channel Indicator is a popular and effective forex indicator that gives clear market entry and exit signals, making it an essential tool in a successful forex trader's toolbox.
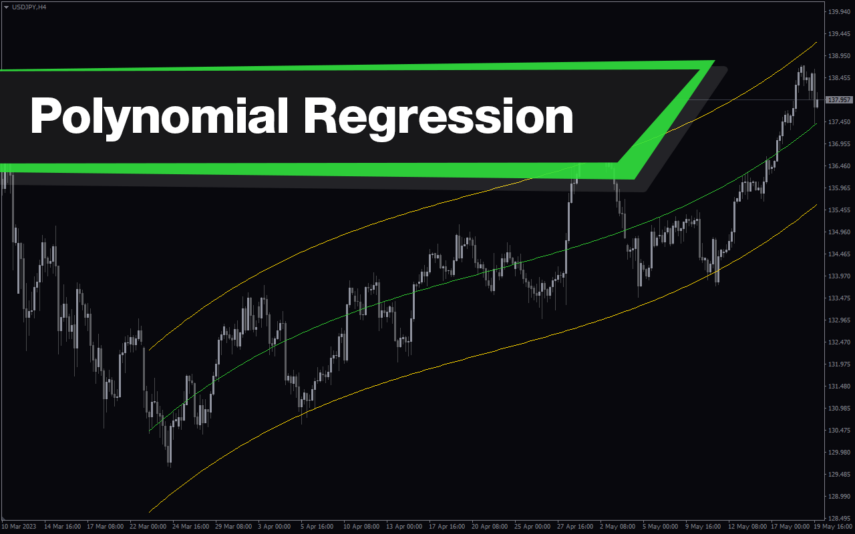
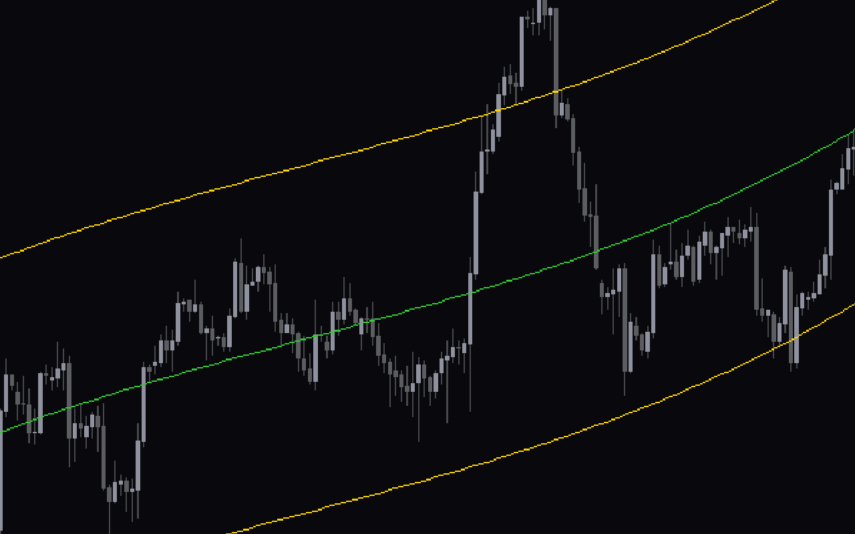
Polynomial Regression Channel
The Polynomial Regression Channel Indicator is a useful and popular free Forex indicator for MT4 (MetaTrader 4) that helps traders to identify trends and potential entry and exit points. It works by creating a channel around the price movements of an asset, which is determined by the polynomial regression line. The indicator then plots lines above and below the regression line to form the channel. With the Polynomial Regression Channel Indicator, traders can easily identify trends and potential entry and exit points, making it a popular and useful free Forex indicator for MT4.
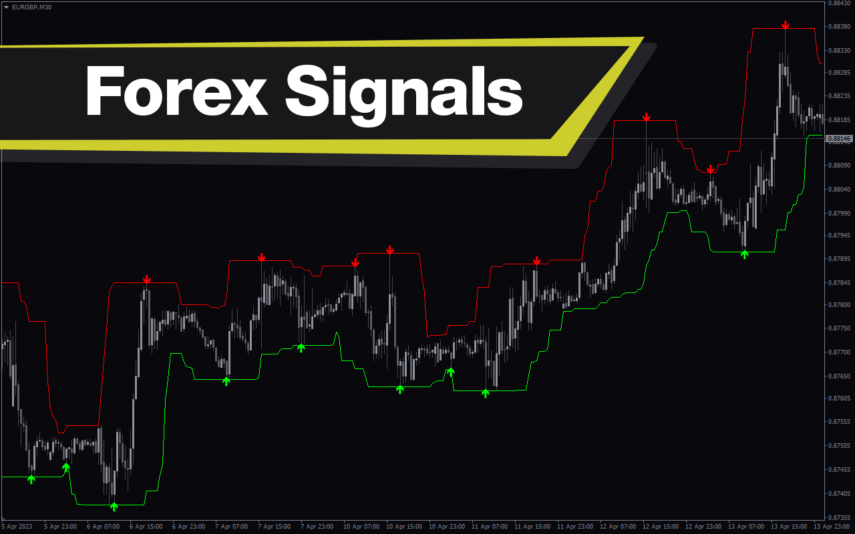
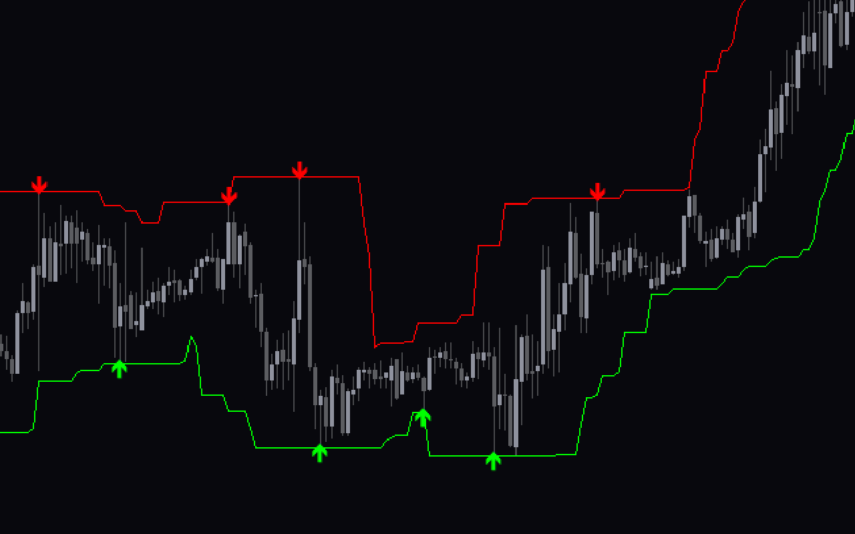
Forex Signals
The Forex Signals Indicator is a powerful technical tool for Forex traders. It uses advanced algorithms to analyze the market and identify buy/sell signals. This new and popular MT4 indicator is designed to give traders accurate signals with minimum lag time. With this indicator, traders can improve their trading strategies and make more informed trading decisions.
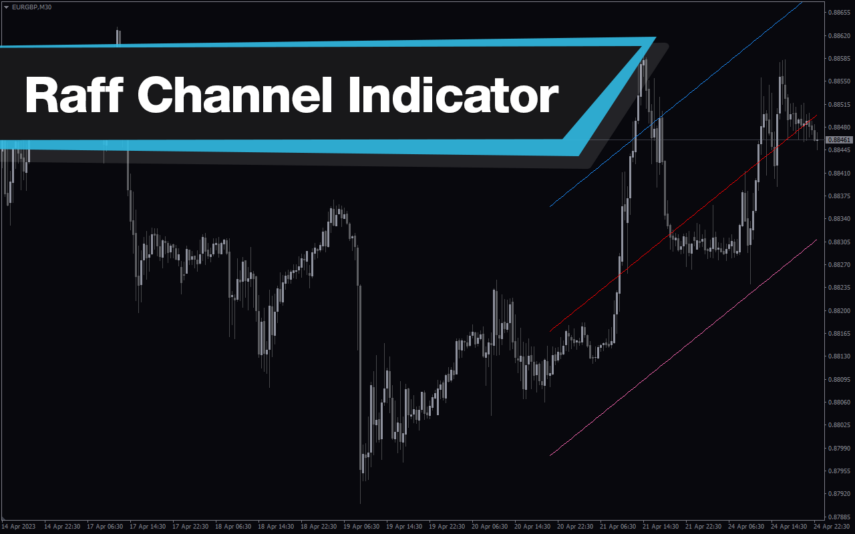
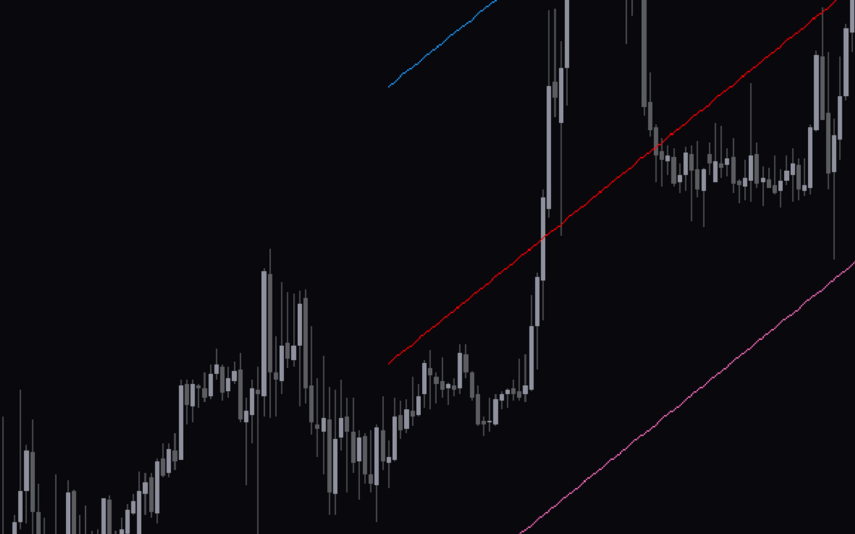
Raff Channel
The Raff Channel Indicator is a useful and popular free Forex indicator for MT4. It is designed to help traders identify and take advantage of trends in the market. The indicator works by plotting two parallel lines on a chart, one above the other. These lines represent the upper and lower boundaries of the current price trend. The Raff Channel Indicator is easy to set up and use, making it a popular choice for traders of all levels.
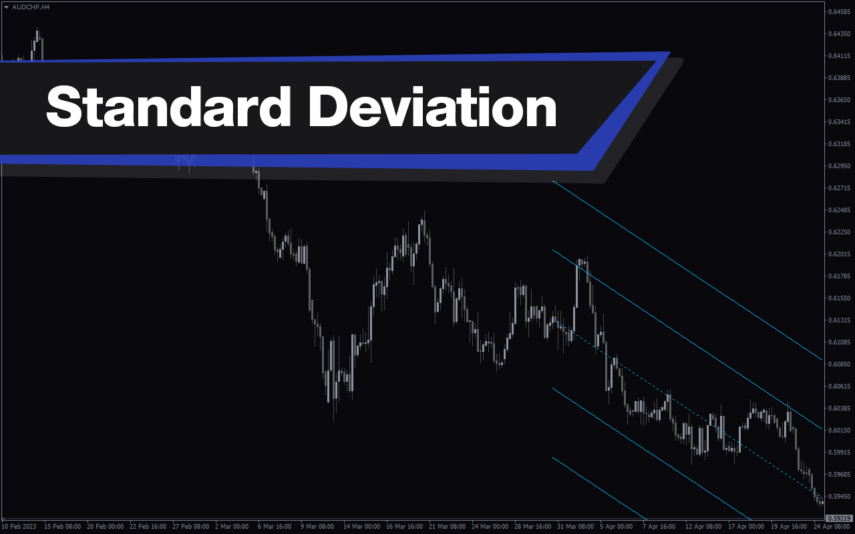
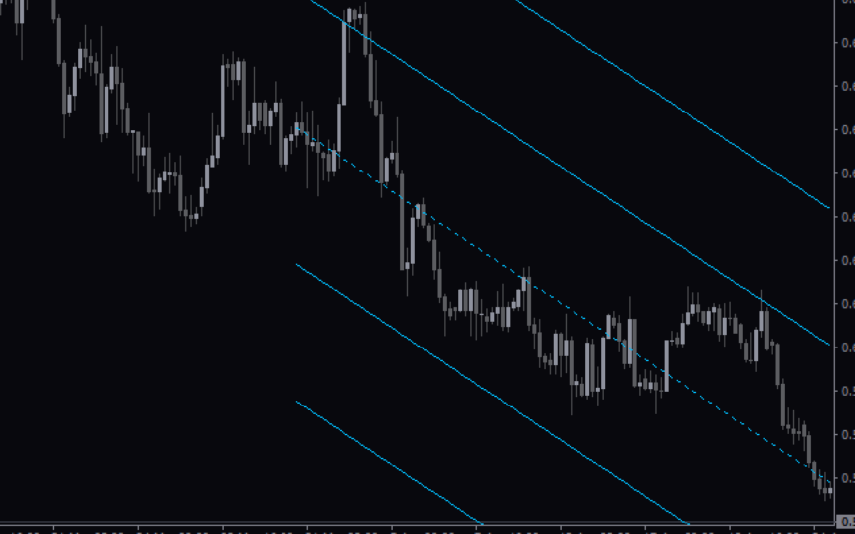
Standard Deviation Channel
The Standard Deviation Channel Indicator is a powerful and useful tool for Forex traders. It is a popular indicator for MT4 that is free to use and can be easily installed. The two lines represent the upper and lower bounds of the standard deviation, and they act as support and resistance levels. Traders can use these lines to identify potential entry and exit points when trading. This makes it an invaluable tool for traders who want to make informed and profitable trades.
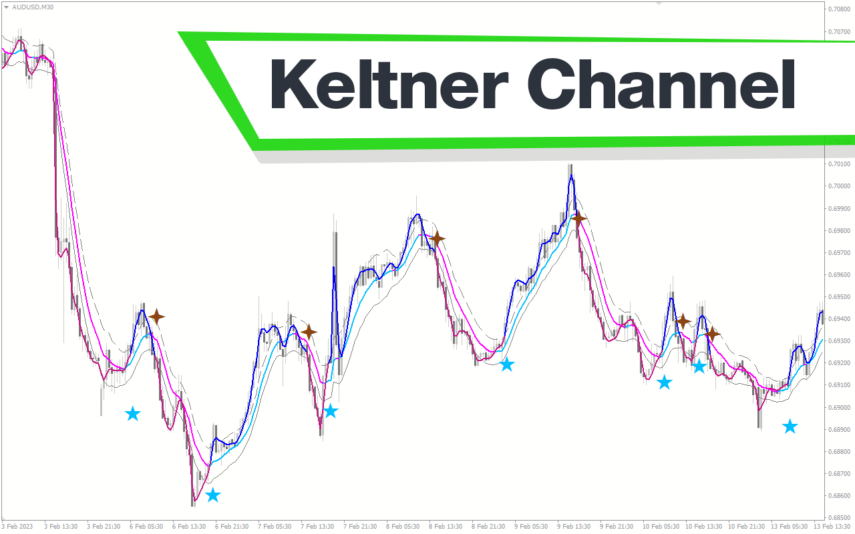
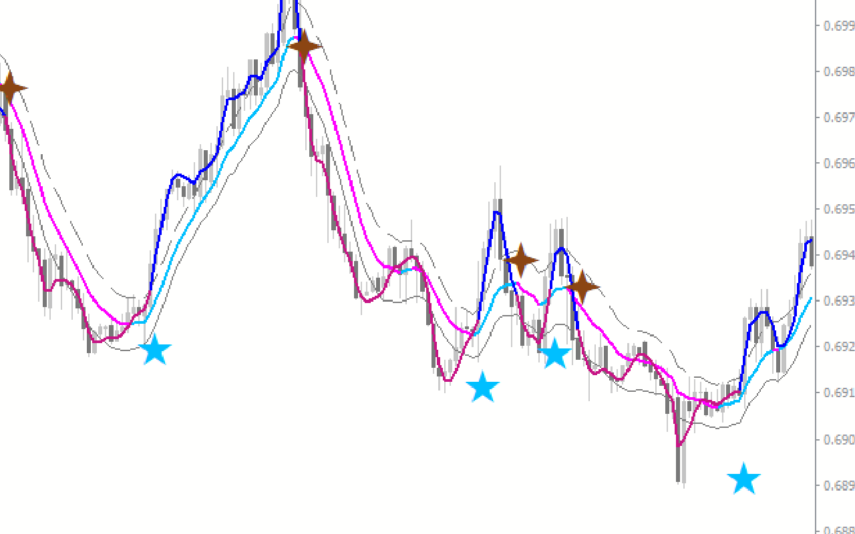
Keltner Channel With Signals
The Keltner Channel with Signals Indicator is a popular and free forex indicator that runs on the MT4 platform. This is a new and innovative tool that uses the Keltner Channel as the basis for generating trading signals, helping traders identify potential trading opportunities. Use the Keltner Channel with Signals Indicator as a powerful tool that can help traders succeed in the forex market.
Reviews
There are no reviews yet.