
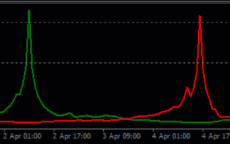
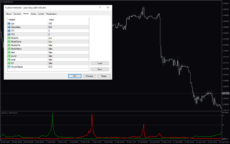
Peak Buy Sell Indicator is a useful forex indicator for MT4 that has become popular among traders. This indicator is available for free and provides valuable buy and sell signals based on market trends. The indicator works by detecting peak points in the market where buying or selling pressure is at its highest, making it easier for traders to make informed decisions about when to enter or exit trades. To use the Peak Buy Sell Indicator, simply install it on your MT4 platform and attach it to your chart. The indicator will then display buy and sell arrows on the chart, indicating potential entry and exit points. Traders can use these signals along with other technical analysis tools to improve their trading strategy and increase profitability. Overall, the Peak Buy Sell Indicator is a powerful tool for forex traders looking to enhance their trading experience.
MT4


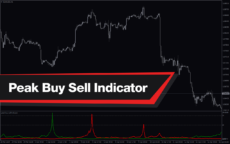
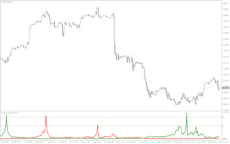
Peak Buy Sell
Peak Buy Sell indicator for MT4 is a useful forex indicator that is popular among traders for its accuracy in detecting buy and sell signals. It is a free indicator that works by analyzing price trends and identifying market peaks for potential entry and exit points. Traders can use this indicator to make informed trading decisions and improve their overall trading strategy.
| Indicator Type | |
|---|---|
| Trading Style | , |
| Timeframe | , |
| Platform |
0
People watching this product now!
Downloads - 57
Description
Reviews (0)
How to Install
Related products
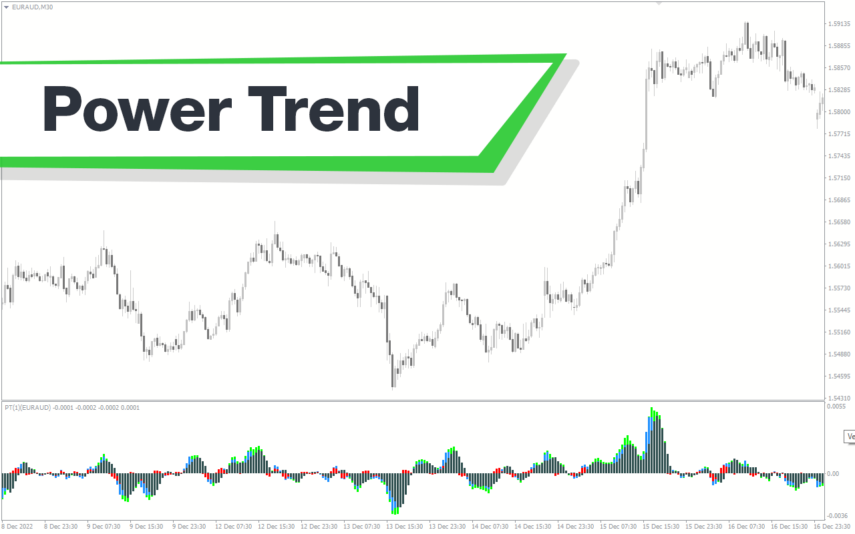
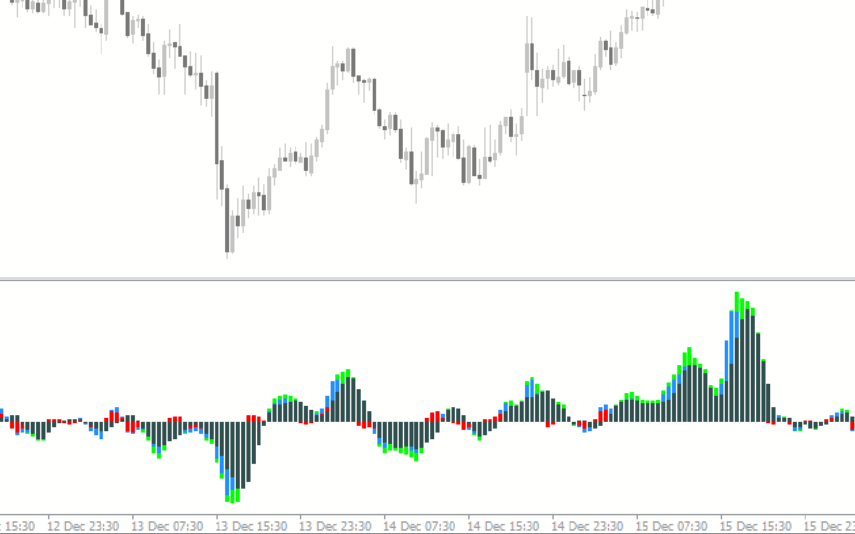
Power Trend
The Power Trend indicator for MT4 is a new and free popular forex technical analysis tool that helps traders identify trends, their direction, and strength visually in different colors. The colored histogram of the Power Trend indicator helps traders plan their trading strategies by providing insights into the trend's strength and maturity level. The indicator changes color to indicate weak or strong trends, allowing traders to maximize their profits and exit the trade at the right time. Download the Power Trend indicator for free and enhance your trading experience.
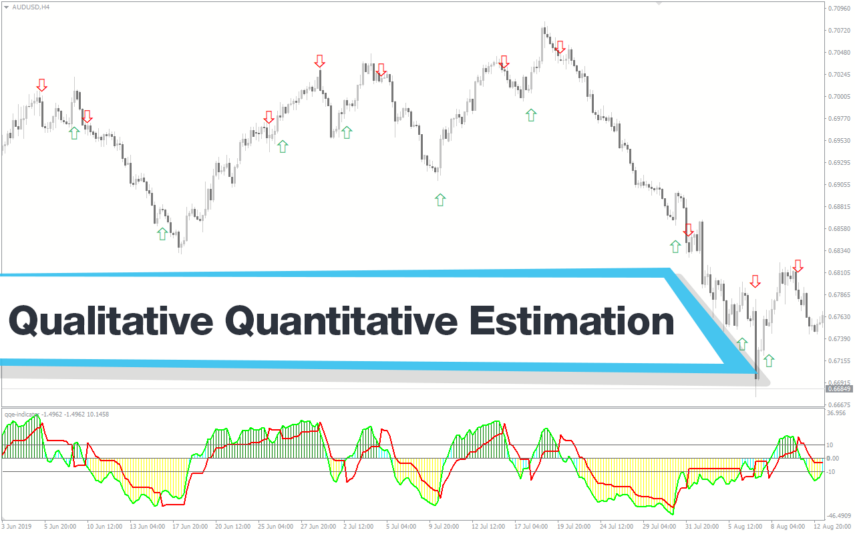
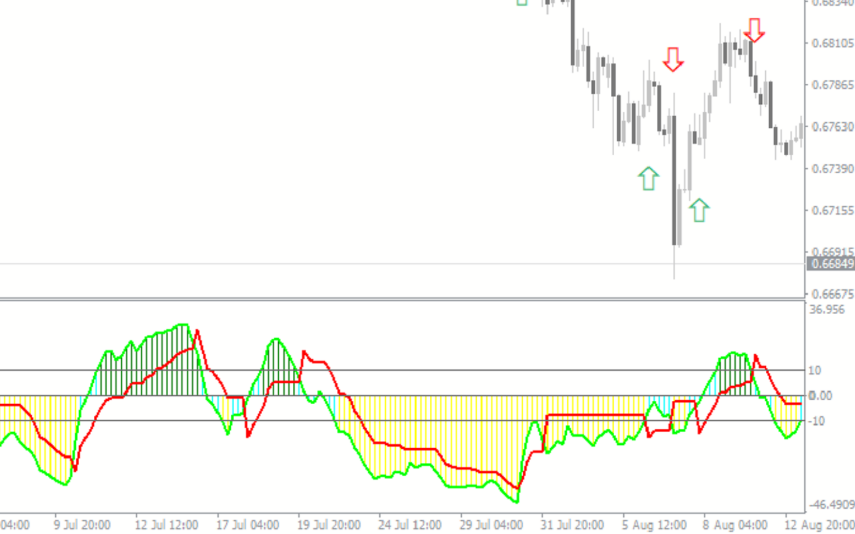
Qualitative Quantitative Estimation
The Qualitative Quantitative Estimation Indicator is a powerful tool for traders in the Forex market. It's a new and popular indicator that works with the MT4 platform. The QQE Indicator is used to determine market trends, identify overbought and oversold positions, and detect divergence in prices and momentum.
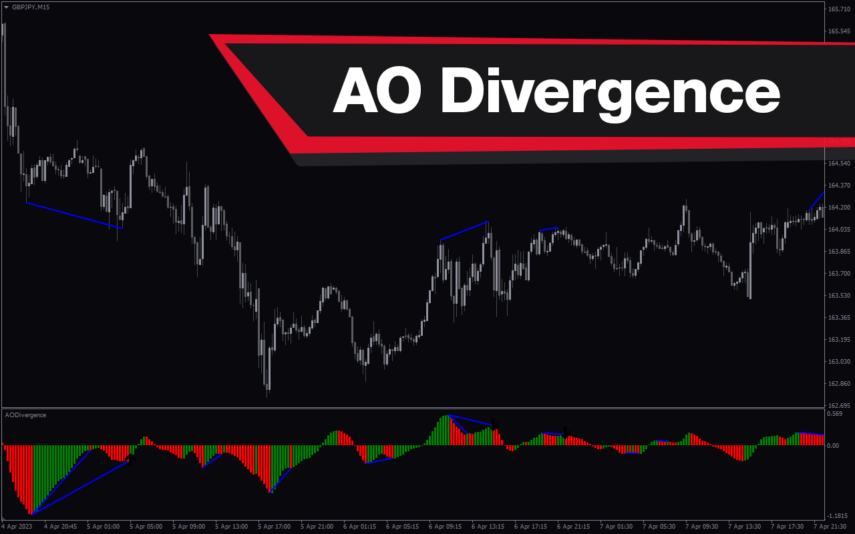
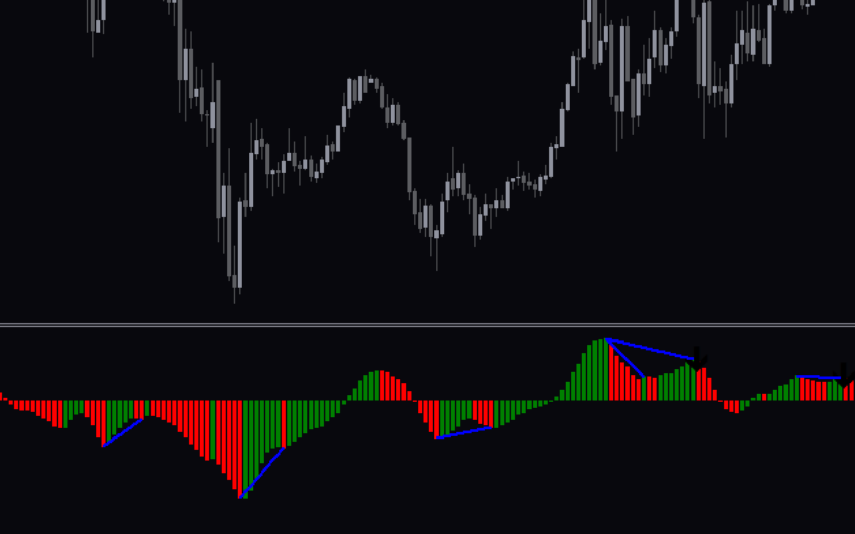
AO Divergence
The AO Divergence Indicator is a useful BE4 tool for forex traders who want to identify divergence patterns in the market. This new MT4 indicator is popular with traders due to its effectiveness in spotting divergence patterns and predicting potential price reversals. It works by analyzing the Awesome Oscillator (AO) and highlighting divergence patterns that may indicate possible trend changes. The AO Divergence Indicator is easy to use and can be a valuable addition to any trader's toolbox.
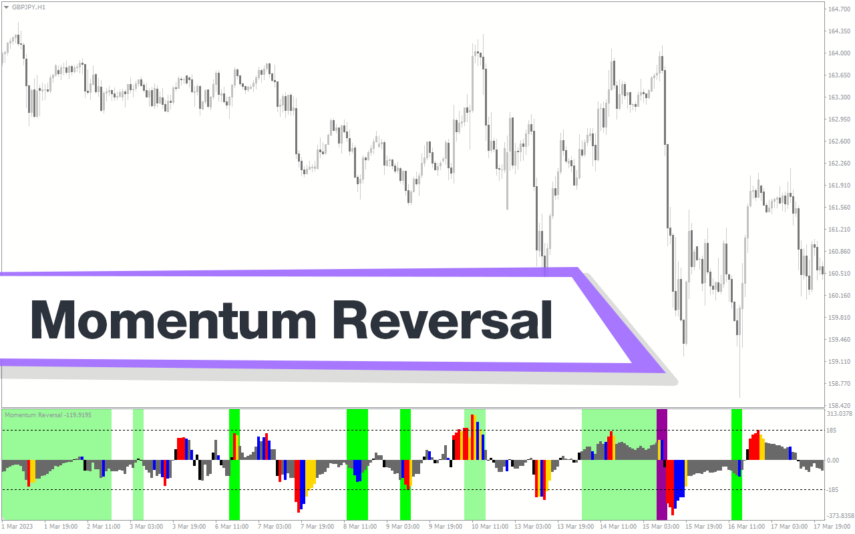
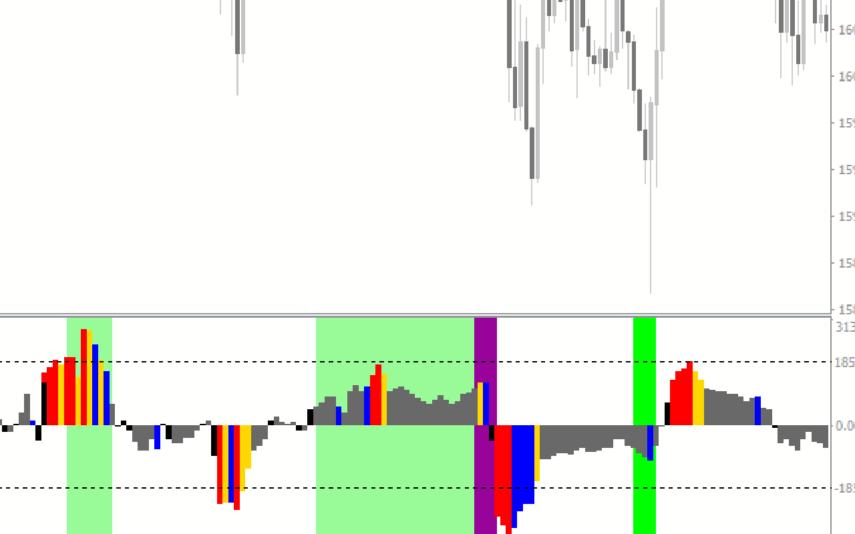
Momentum Reversal Detector
The Momentum Reversal Detector Indicator is a useful and popular free Forex indicator for MT4. It is designed to help traders identify potential reversals in market momentum. The indicator uses a combination of moving averages, oscillators, and price action to generate signals when a reversal is likely. The Momentum Reversal Detector Indicator is a great tool for any Forex trader looking to capitalize on short-term reversals.
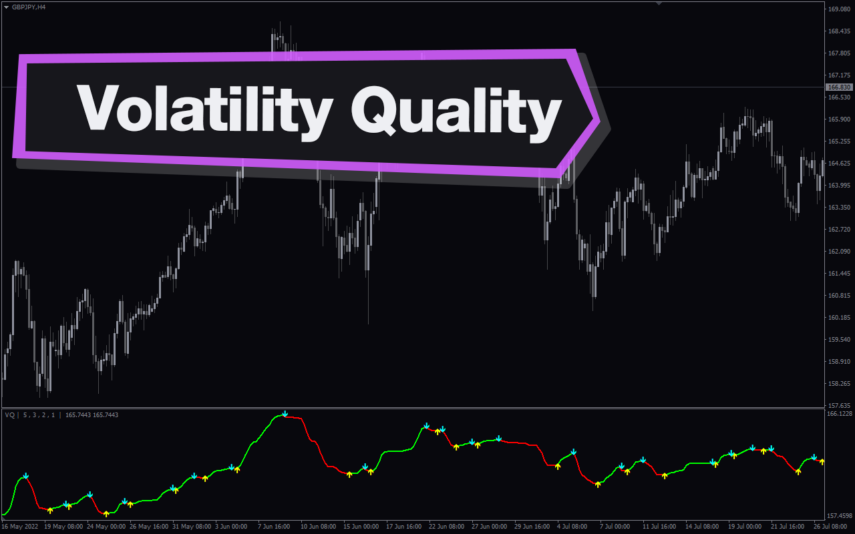
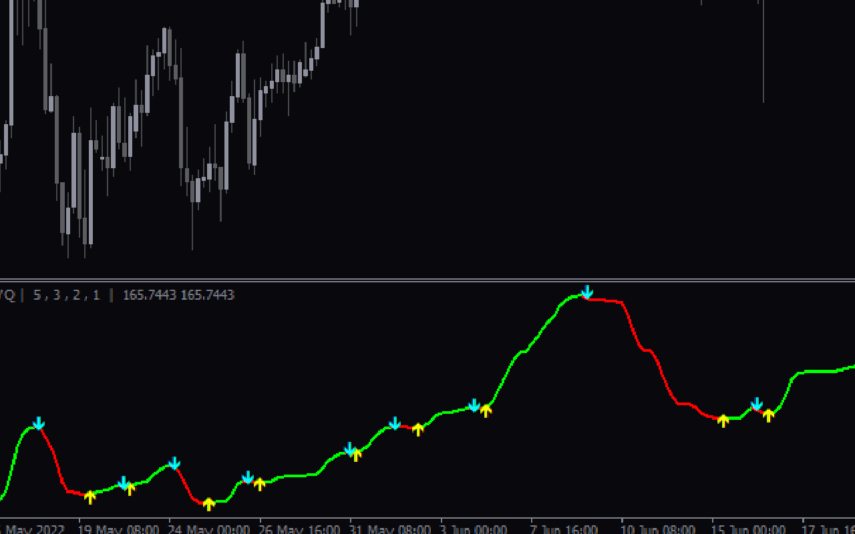
Volatility Quality
The Volatility Quality Indicator is a useful and popular free Forex indicator for MT4 that helps traders identify the best entry and exit points in the market. This indicator is based on the ratio of the price range of a given period to the average true range of the same period. It helps traders determine the quality of the volatility of a currency pair. It is also a great tool for identifying support and resistance levels. The Volatility Quality Indicator is a great way to make informed decisions when trading Forex.
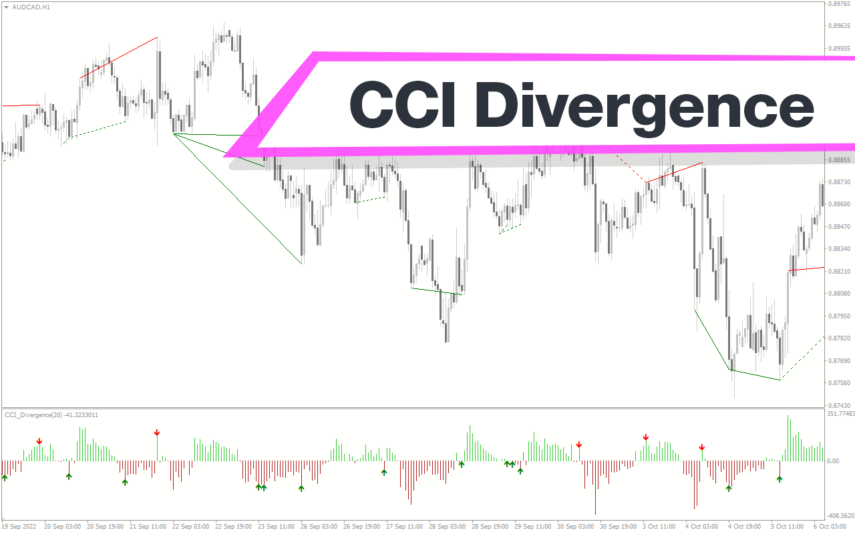
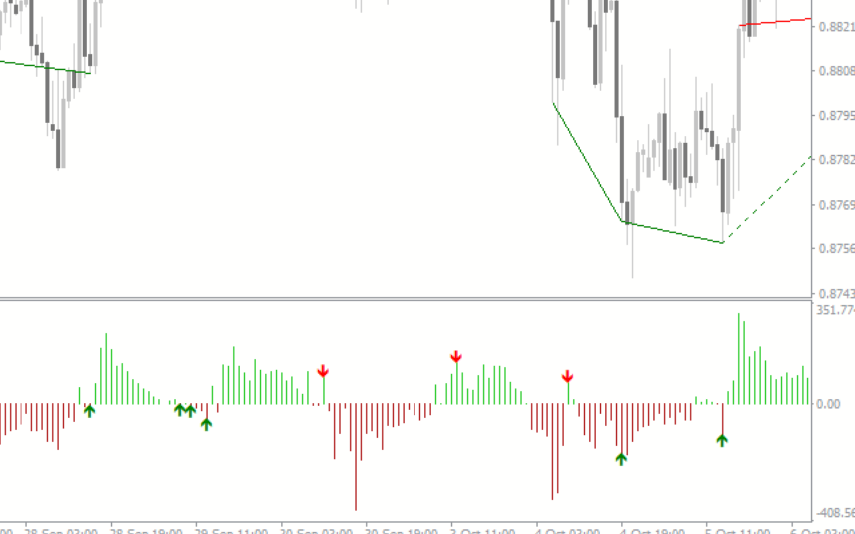
CCI Divergence
The CCI Divergence Indicator for MT4 is a useful and popular free Forex indicator. It is used to identify potential reversals in the market by looking for divergences between price and the Commodity Channel Index (CCI). The indicator uses the CCI to determine when the market is overbought or oversold and when the trend is likely to reverse. It will then plot a divergence line on the chart to indicate potential reversal points. The CCI Divergence Indicator for MT4 is a great tool for traders of all levels and can be used to help traders make more informed decisions.
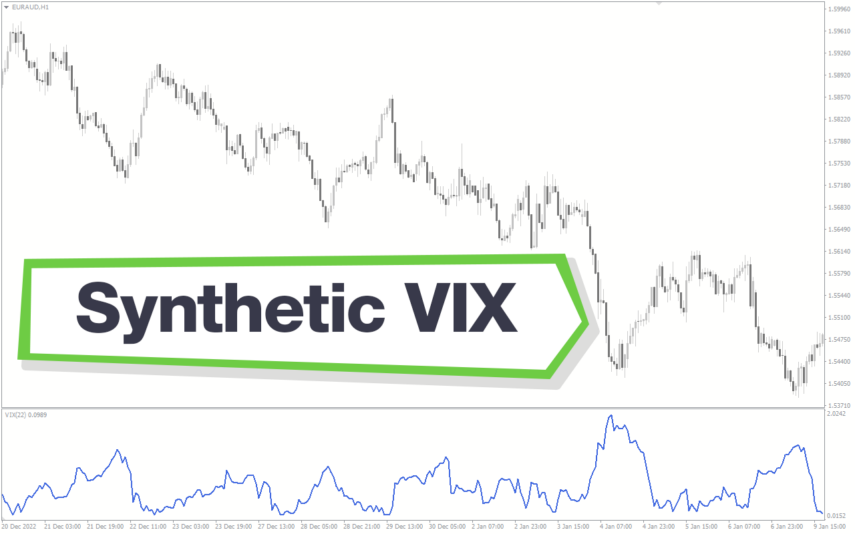
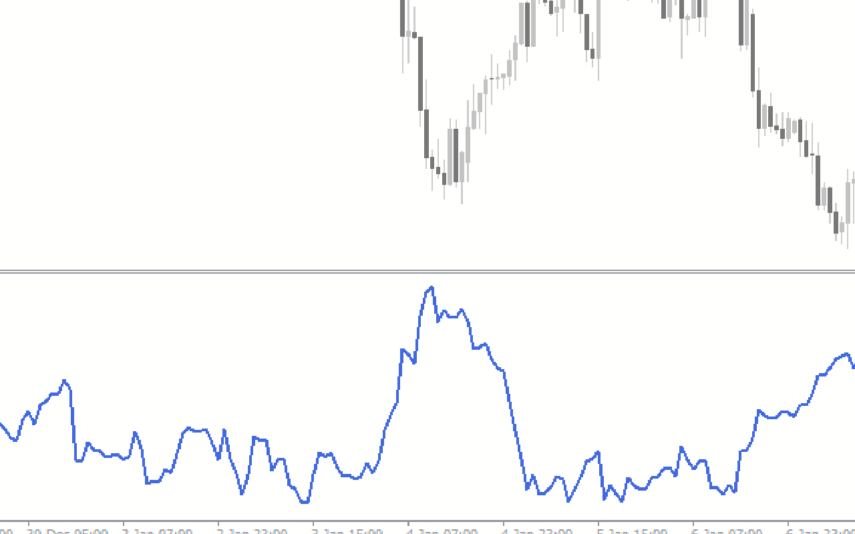
Synthetic VIX
The Synthetic VIX Indicator is a popular and free Forex indicator for the MT4 trading platform. The indicator utilizes a combination of price action and signals from multiple time frames to accurately predict market movements. The Synthetic VIX indicator can be used to identify potential entry and exit points in the market, as well as to identify trend reversals and breakouts. It is designed to provide traders with an easy to use and reliable indicator that can help them make informed trading decisions. With its accurate and reliable signals, the Synthetic VIX Indicator is a great tool for any trader looking to improve their trading performance.
Reviews
There are no reviews yet.