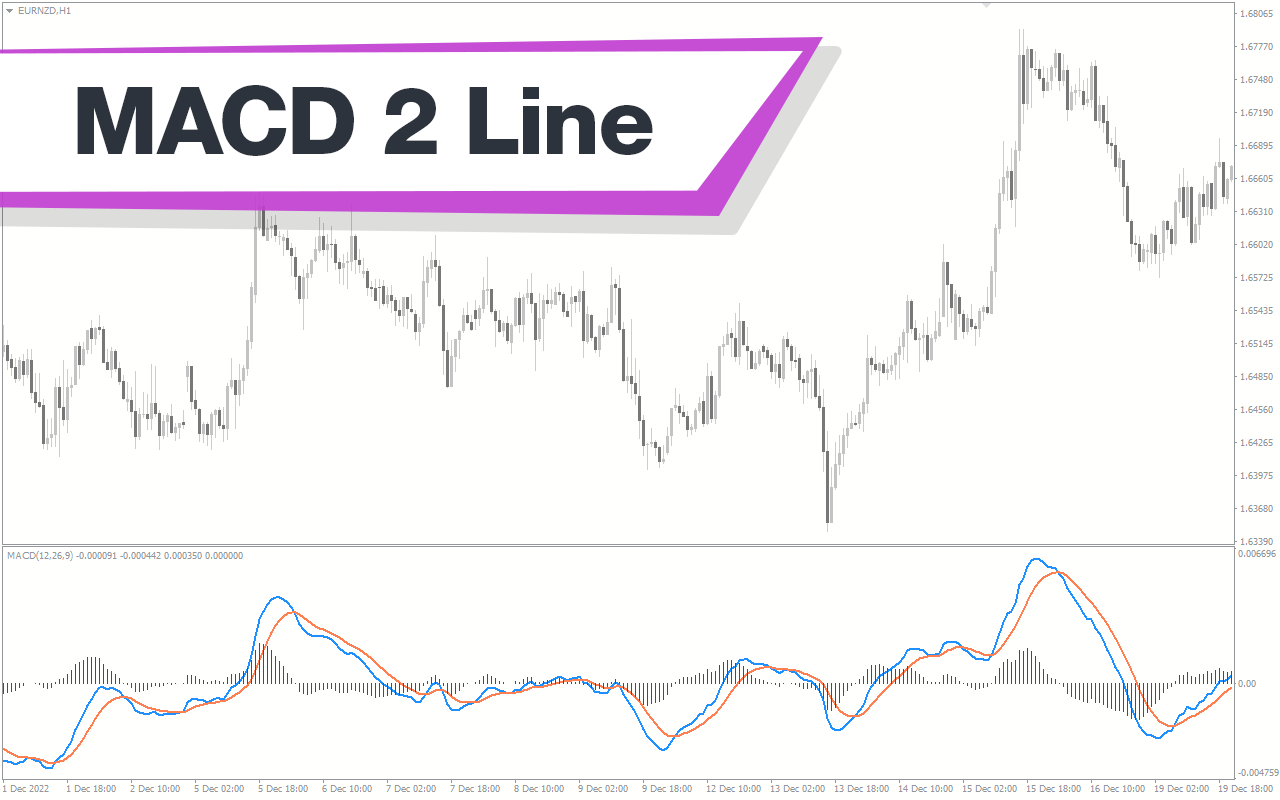
The MACD 2 line indicator plots two indicator lines and a multicolor histogram. The underlying calculation of the classic MACD and the MACD 2 line indicator are same. However, the MACD 2 line indicator offers more practical benefits to the forex trader in terms of identifying the entry and exit points and trend direction.
Features of MACD 2 Line MT4 Indicator
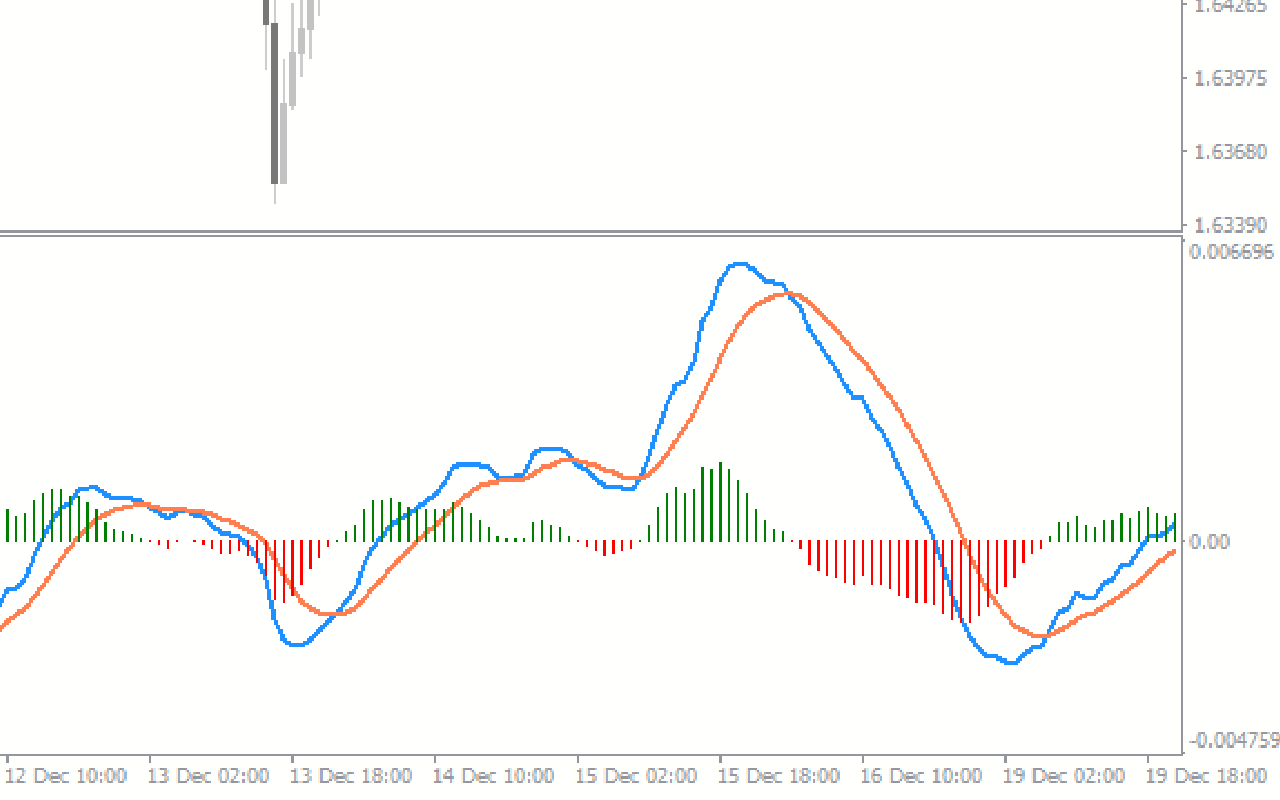
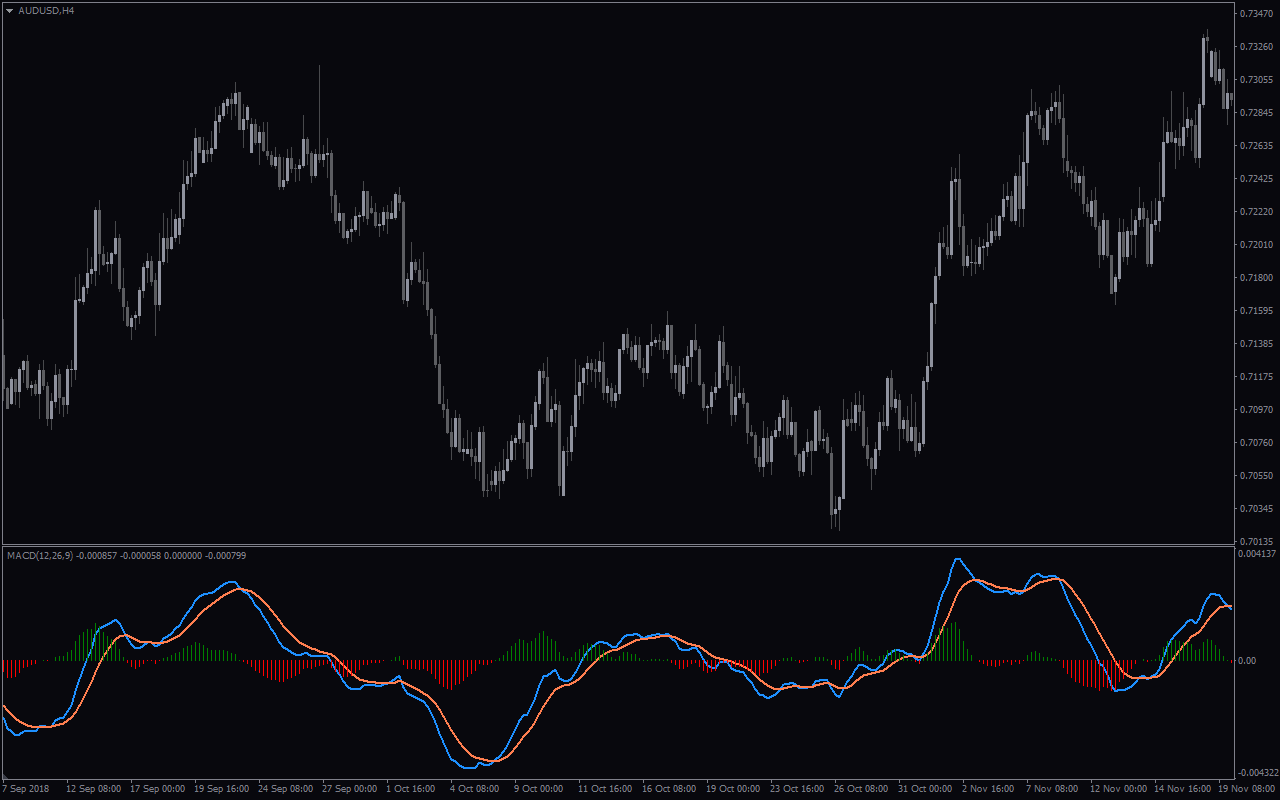
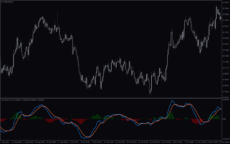
The MACD 2 line indicator histogram turns red in a bearish trend and green in a bullish trend. Furthermore, it plots a blue MACD line and red signal line. If the histogram or indicator lines move above the Zero line market is considered bullish. Similarly, in a bearish condition the indicator line or histogram is below the Zero line.
Traders can enter the market with a buy trade if the red line crosses above the blue line. Additionally, the green histogram should be above the zero line. Traders can place a stop below the previous swing low and book profits at an opposite trading signal. Similarly, traders can follow similar strategy in a bearish market condition.
Benefits of Using the Indicator
The MACD 2 line provides a two colored histogram that differentiates the bullish and bearish markets. It is important to note that in the classic MACD the histogram is in a single color. Another important benefit is the two indicator lines against a single MACD line in the classic indicator. As a result, traders can enter and exit the market using the crossover of these lines.
A trend reversal is highly likely as the indicator lines moves far from the zero line. So traders can anticipate pull backs or a trend reversal or look for forex counter trend trading strategies.
Indicator Settings Description
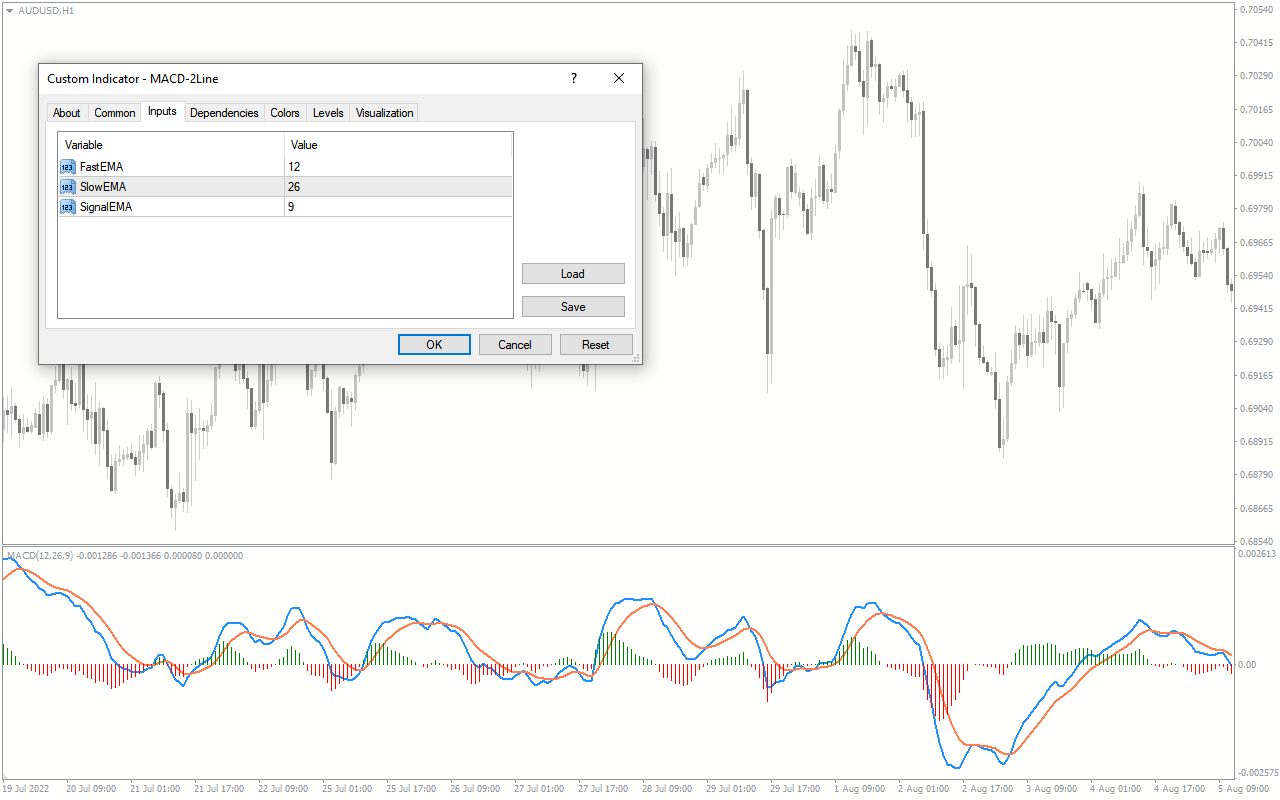
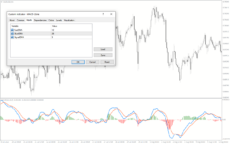
FastEMA:, SlowEMA:, SignalEMA: Input for fast, slow and signal line moving average periods.

Reviews
There are no reviews yet.