One of the most important aspects of trading is identifying the current trend. As a general rule, traders trade with the trend. The Keltner Channel indicator shows you the current trend on a price chart.
Features of the Keltner Channel Indicator
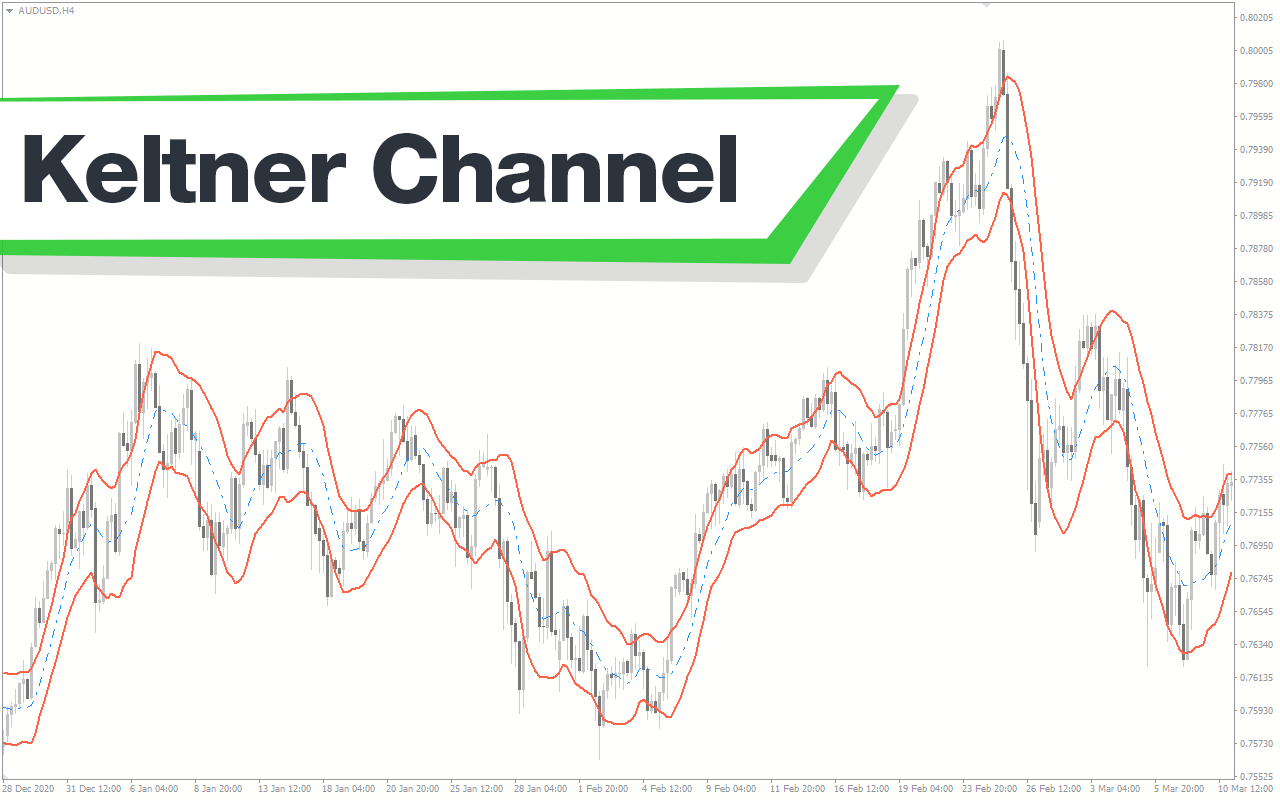
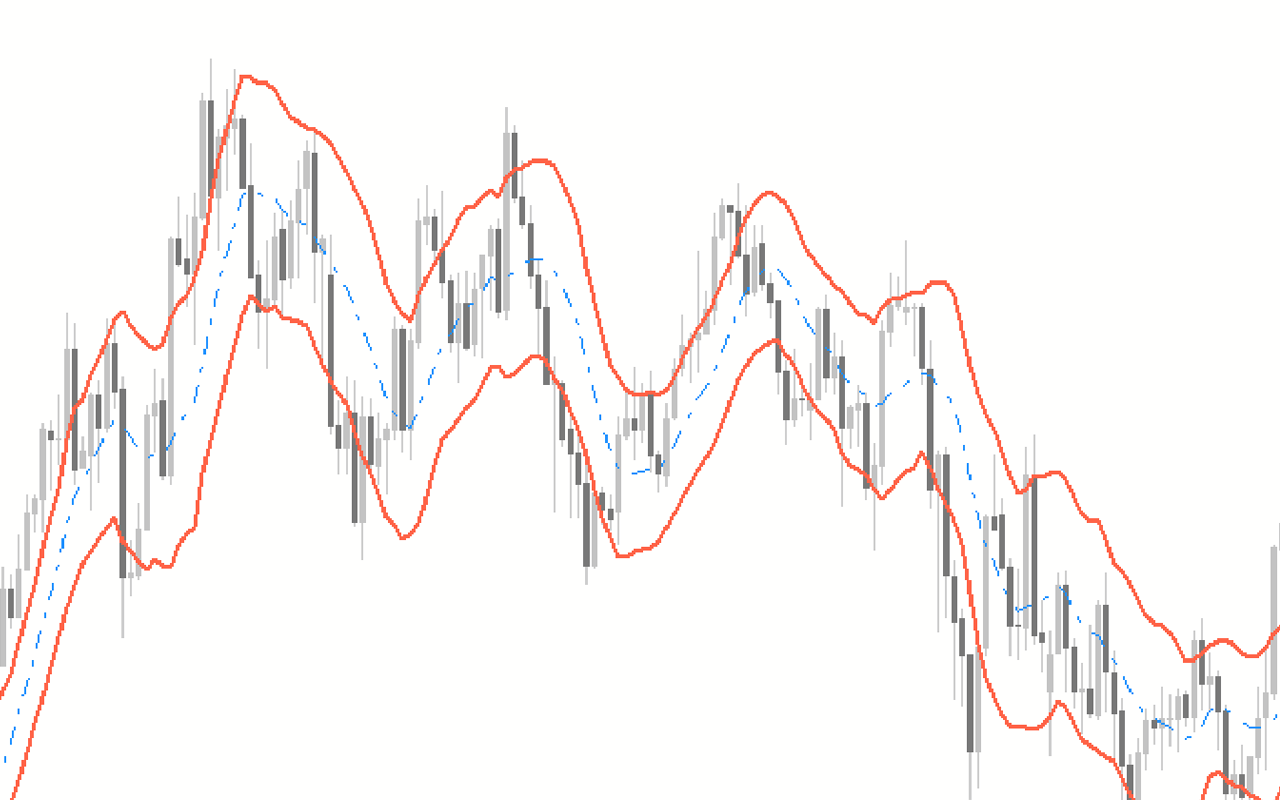
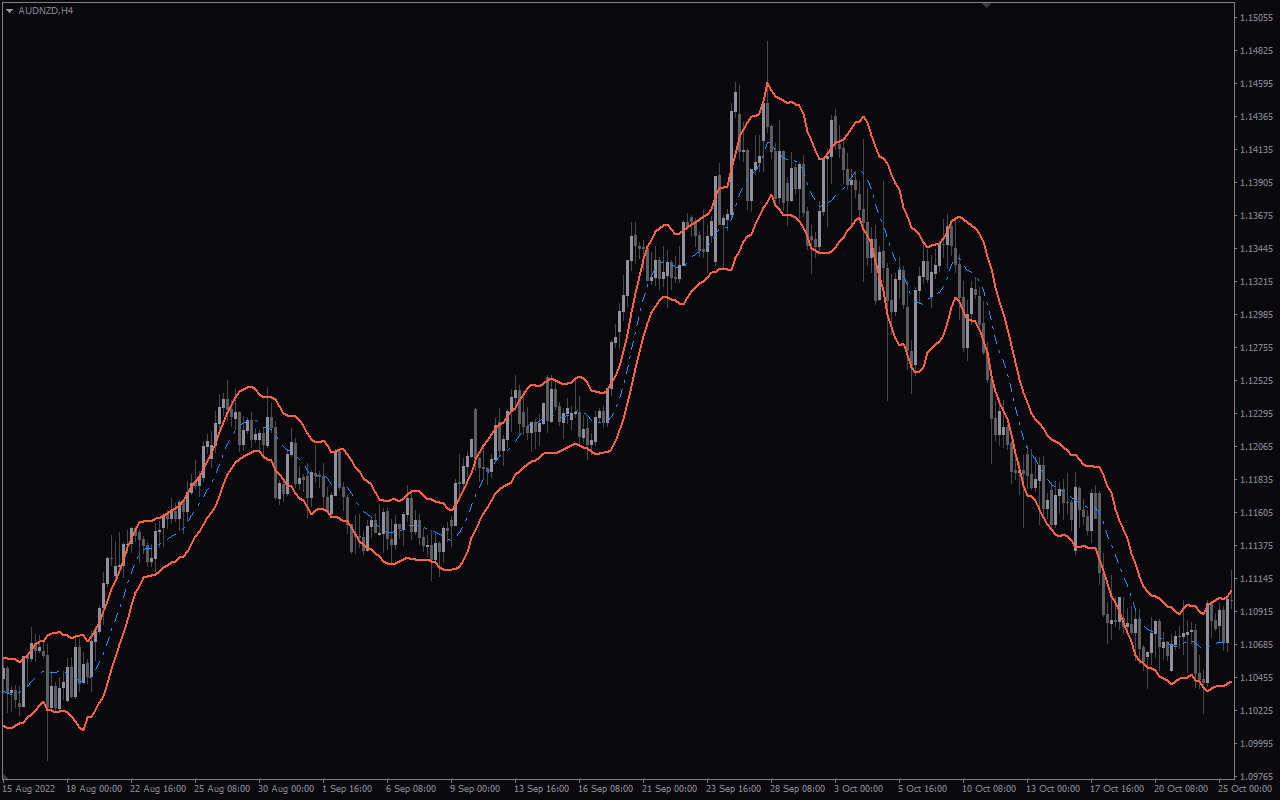
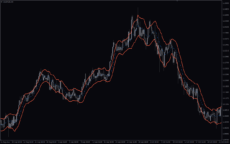
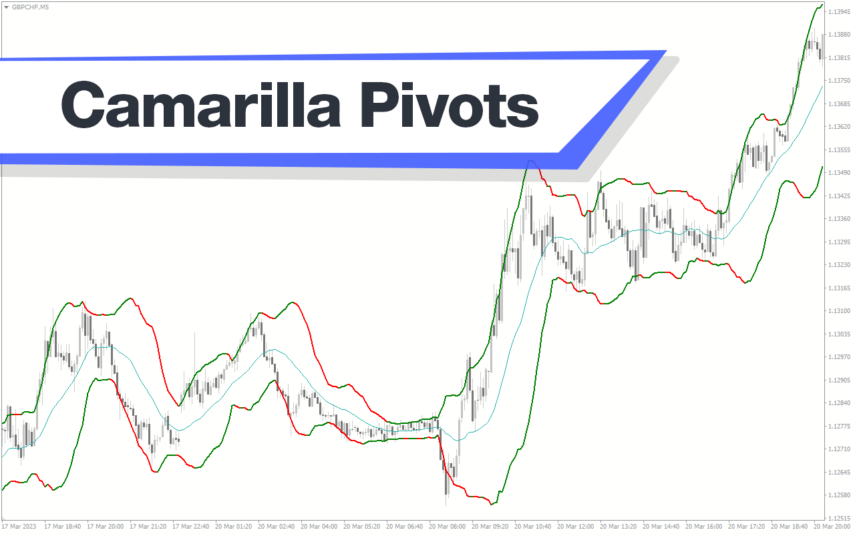
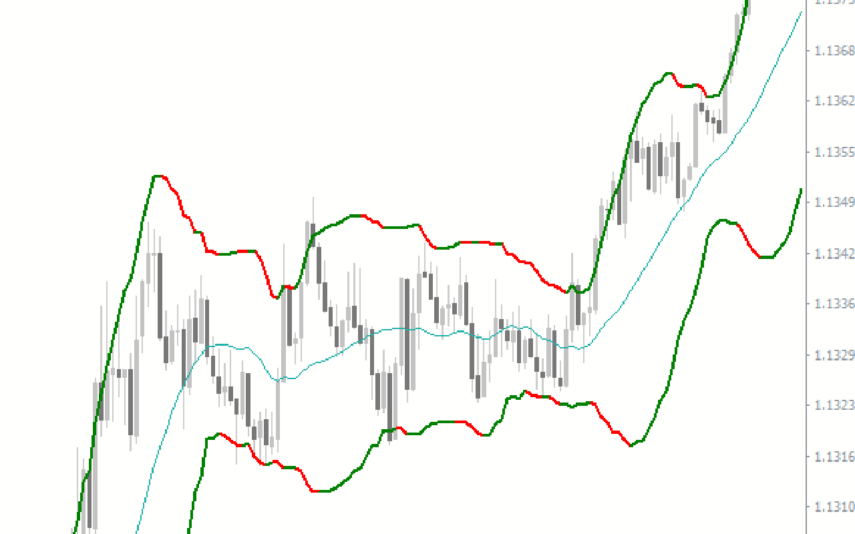
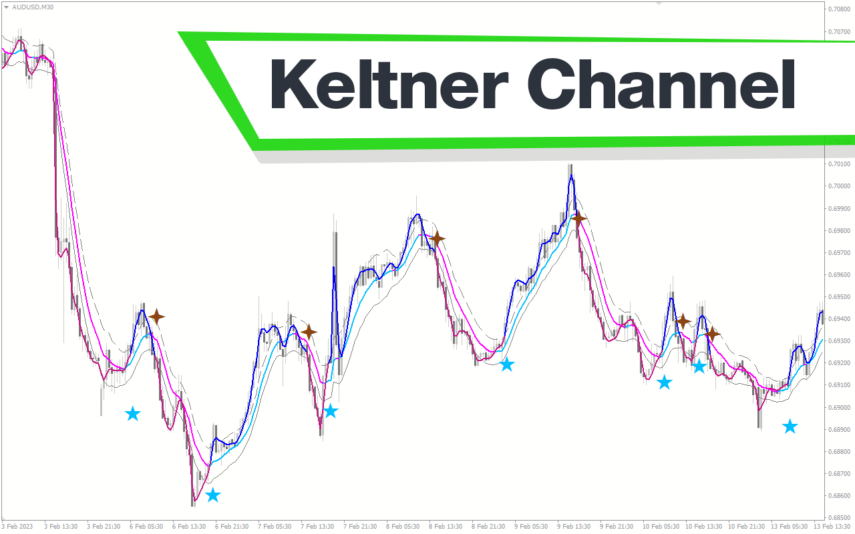
The Keltner channel indicator consists of three bands, of which two are the upper and lower bands. The third band is in the middle of the other two lines. Generally, the price oscillates within the bands, depending on the indicator’s parameters.
How the Indicator Can Benefit You
You can use the Keltner Channel indicator in numerous ways, some of which we shall see below.
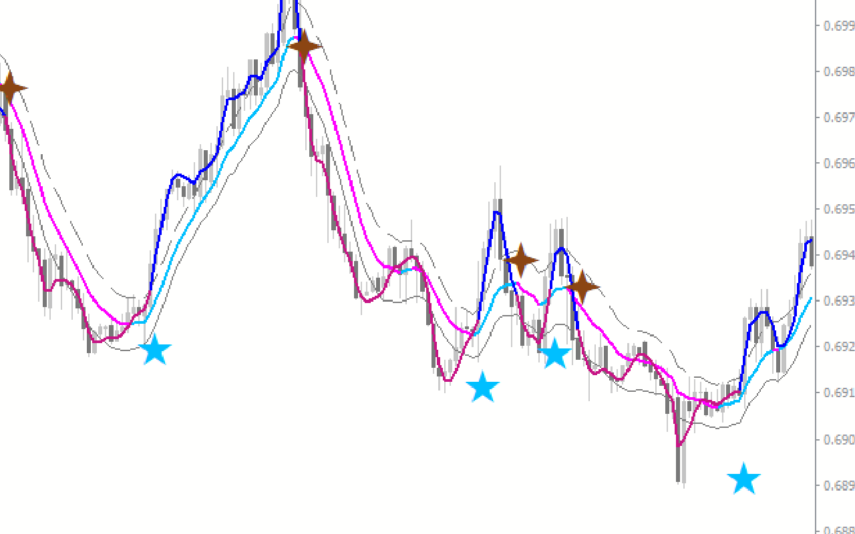
Dynamic Support and Resistance in Trends. You may identify market trends and trade with them using this method. The channel’s angle shows the market trend. A sinking channel indicates a downtrend in the market, and an upturned channel indicates an uptrend. The Keltner Channel indicator indicates an upward trend when the price trades in the top half of the channel. At times, the price oscillates continuously between the top and middle bands.
During a downtrend, the price trades within the bottom half of the channel. The price oscillates between the lower and mid bands. These bands are dynamic support and resistance levels. You can use them to enter and exit trades.
Breakouts. Additionally, the Keltner channel indicator is an excellent source of breakout signals. When Price opens within the channel and closes outside it, it is called a breakout. When this occurs, it implies that the price will stay moving in for some time. Most of the time, these breakouts mark the start of significant market trend movements.
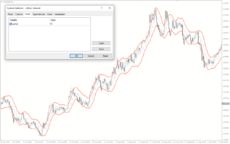
Indicator Setting Description
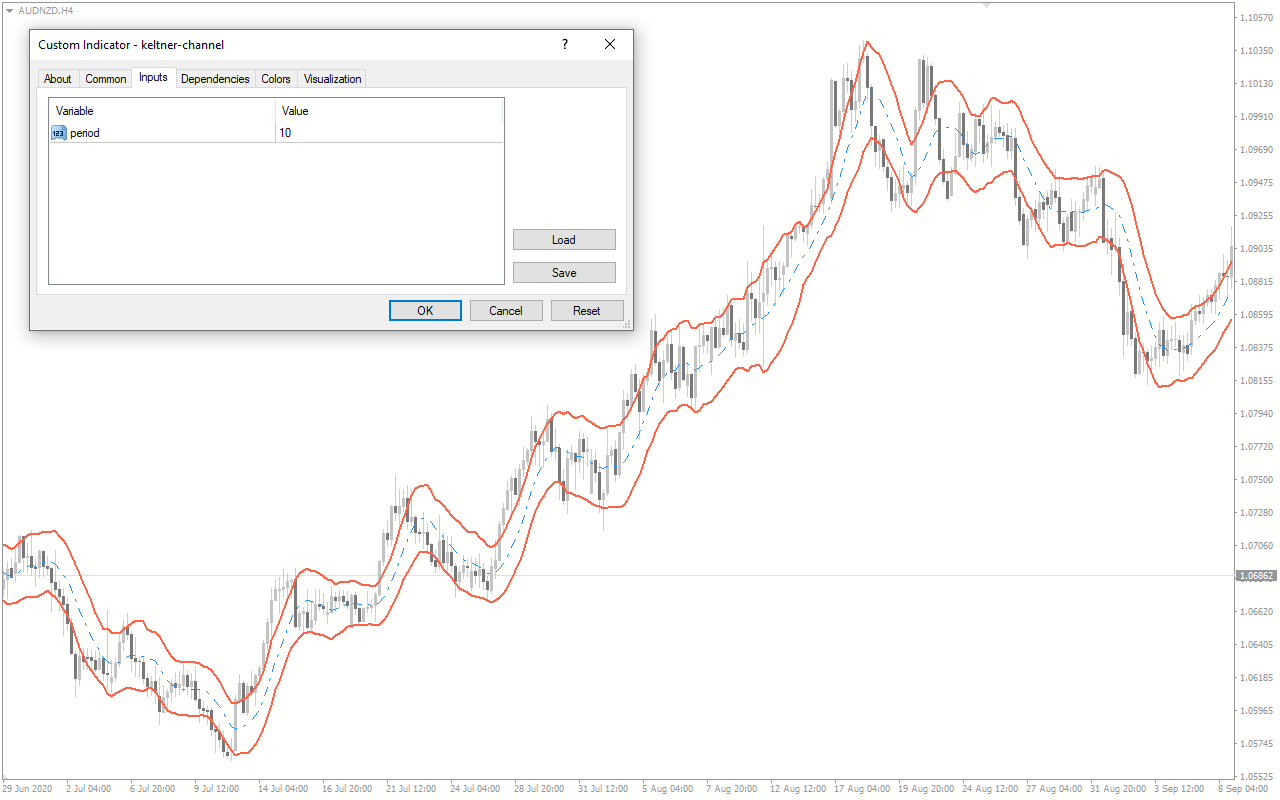
Period: This option enables you to edit the EMA to determine the sensitivity of the Keltner Channel.

Reviews
There are no reviews yet.