Features of The Indicator
The Relative Strength Index assesses price changes and determines whether the market is overbought or oversold. One of the primary challenges traders encounter when using an indicator is the lack of signals, particularly as this indicator rarely reaches extreme overbought or oversold levels.
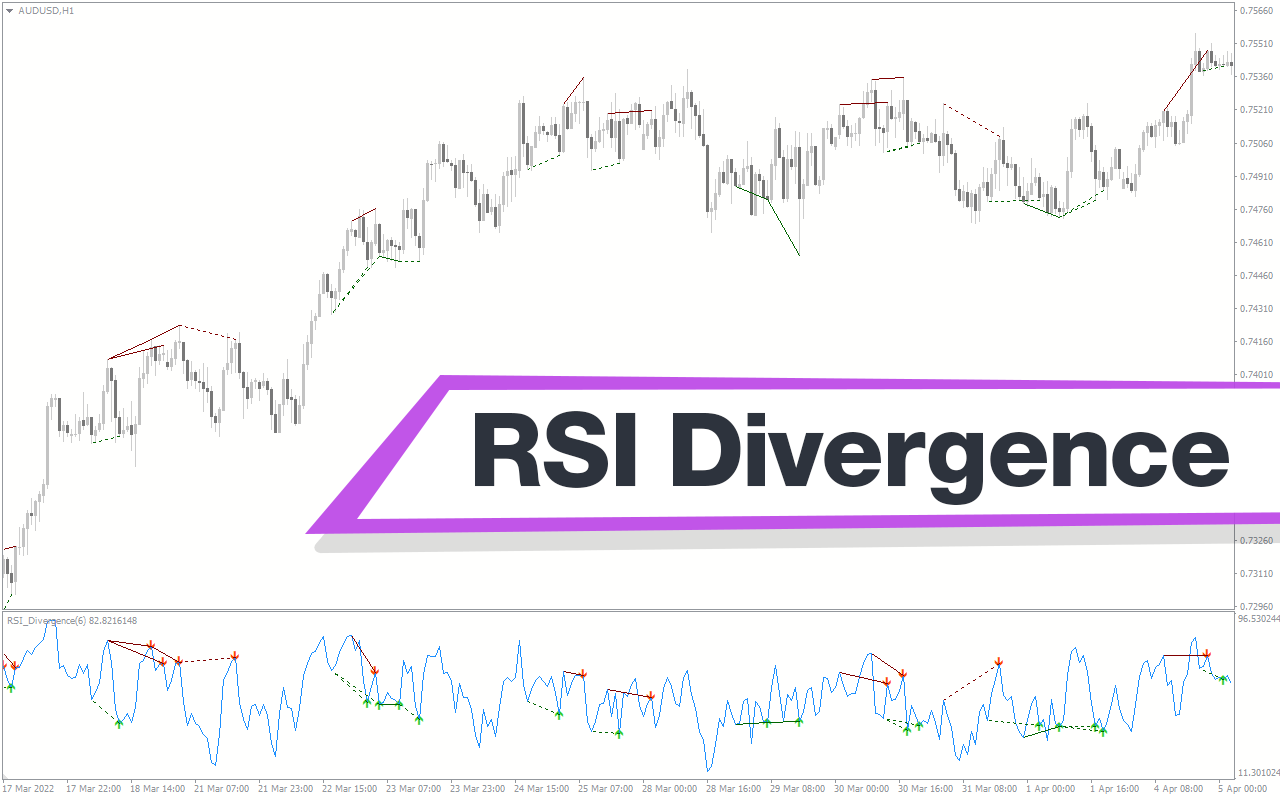
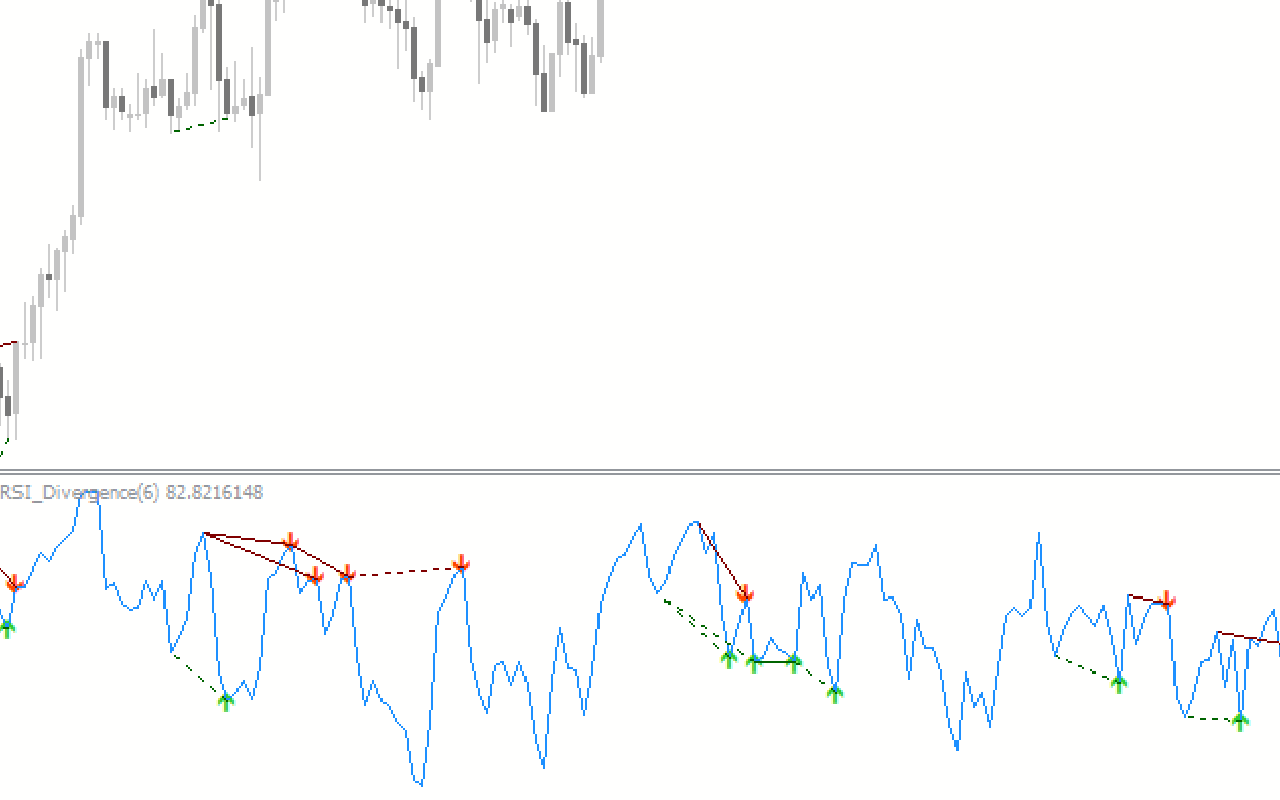
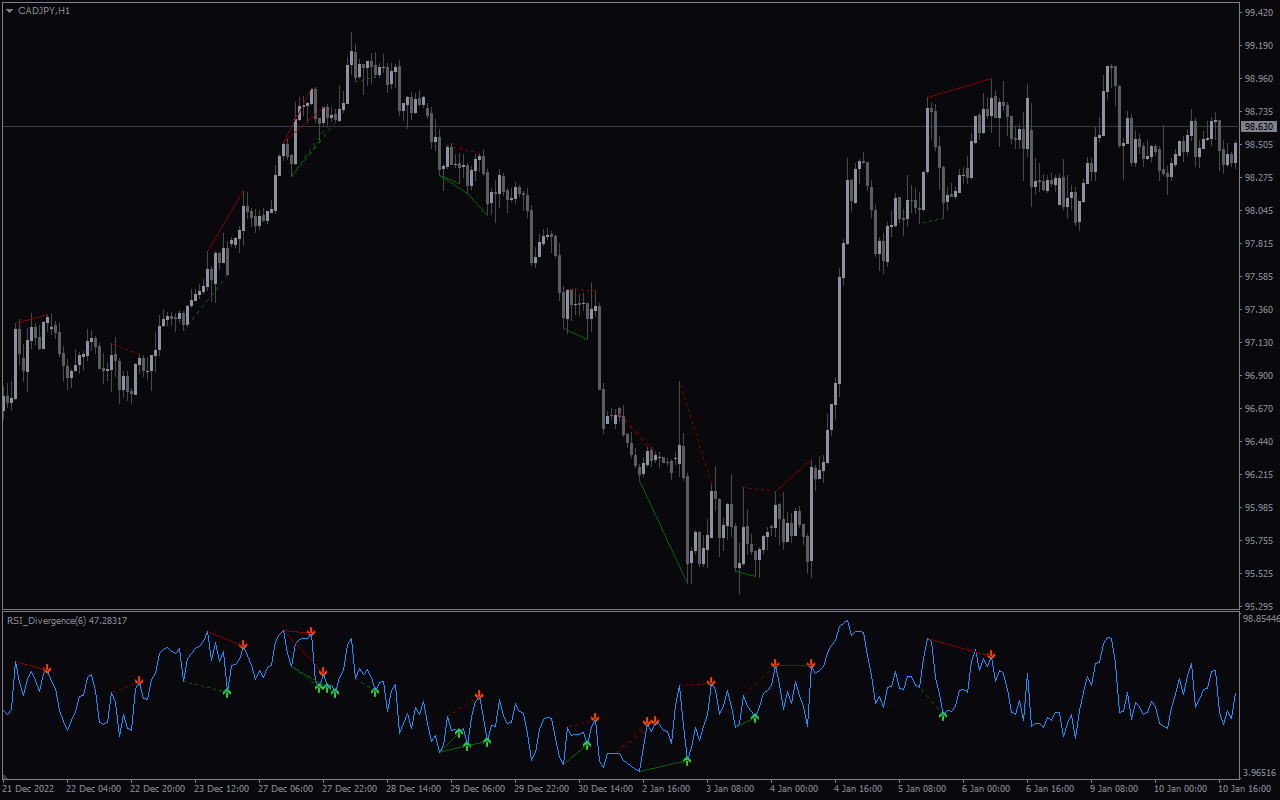
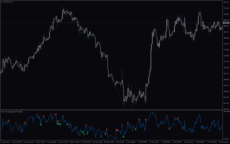
To address this issue, divergence in the standard indicator is an important signal. Using divergence can help identify potential points when the market will likely reverse or continue its trend after a temporary pullback. The RSI divergence v2 indicator draws lines in a separate window on the price chart to represent divergence. The lines are color-coded. The green lines represent a bullish divergence, while the red lines represent a bearish divergence.
How the RSI Divergence Indicator Can Benefit You
An RSI divergence occurs when the indicator moves in the opposite direction to the price at a given time. For example, the indicator makes higher highs while the price makes lower lows. Such a divergence indicates that the current trend is losing momentum. This observation may act as a signal and a potential opportunity to anticipate a market price reversal. Therefore, it’s a good indicator of when to enter a new trend.
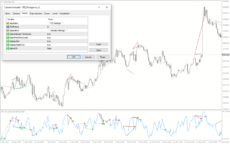
Indicator Setting Description
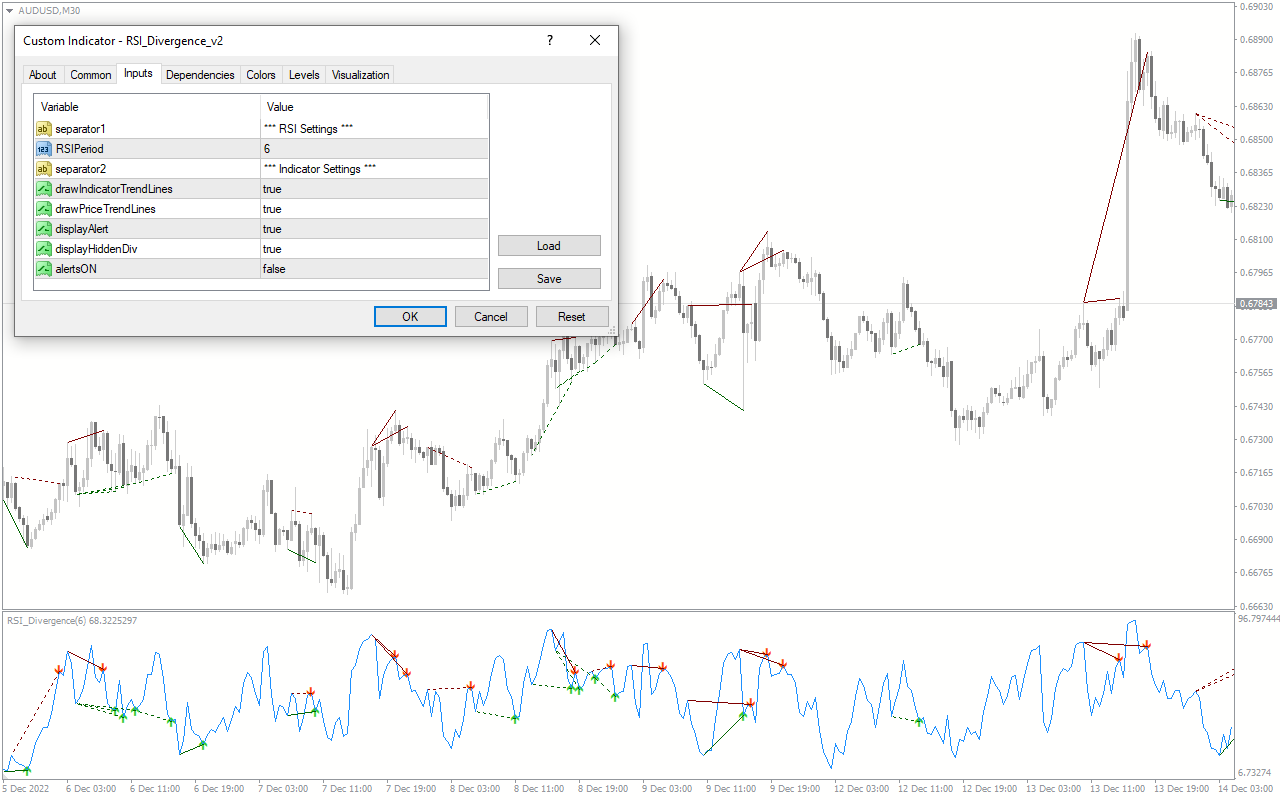
Separator1: This is the RSI settings section.
RSI period: You can change the RSI period value.
Separator 2: This is the indicator settings section.
Draw indicator trendlines: Enables/Disables the indicator to draw trendlines on the chart.
Draw price trendlines: Enables/Disables the indicator to draw price trendlines on the chart.
Display alert: Enables/Disables the indicator to send display alerts.
Display hidden div: Enables/Disables the indicator to display hidden divergence.
Alerts on: Enables/Disables the indicator to send alerts.

Reviews
There are no reviews yet.