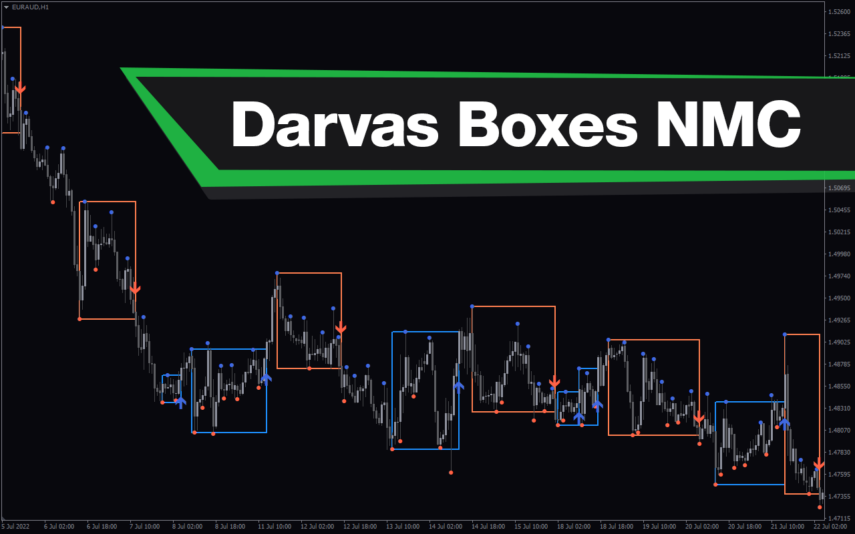
If you use a breakout strategy, this indicator is your greatest asset. The indicator plots support and resistance levels by combining many tools and giving clear breakout signals.
Features of the Indicator
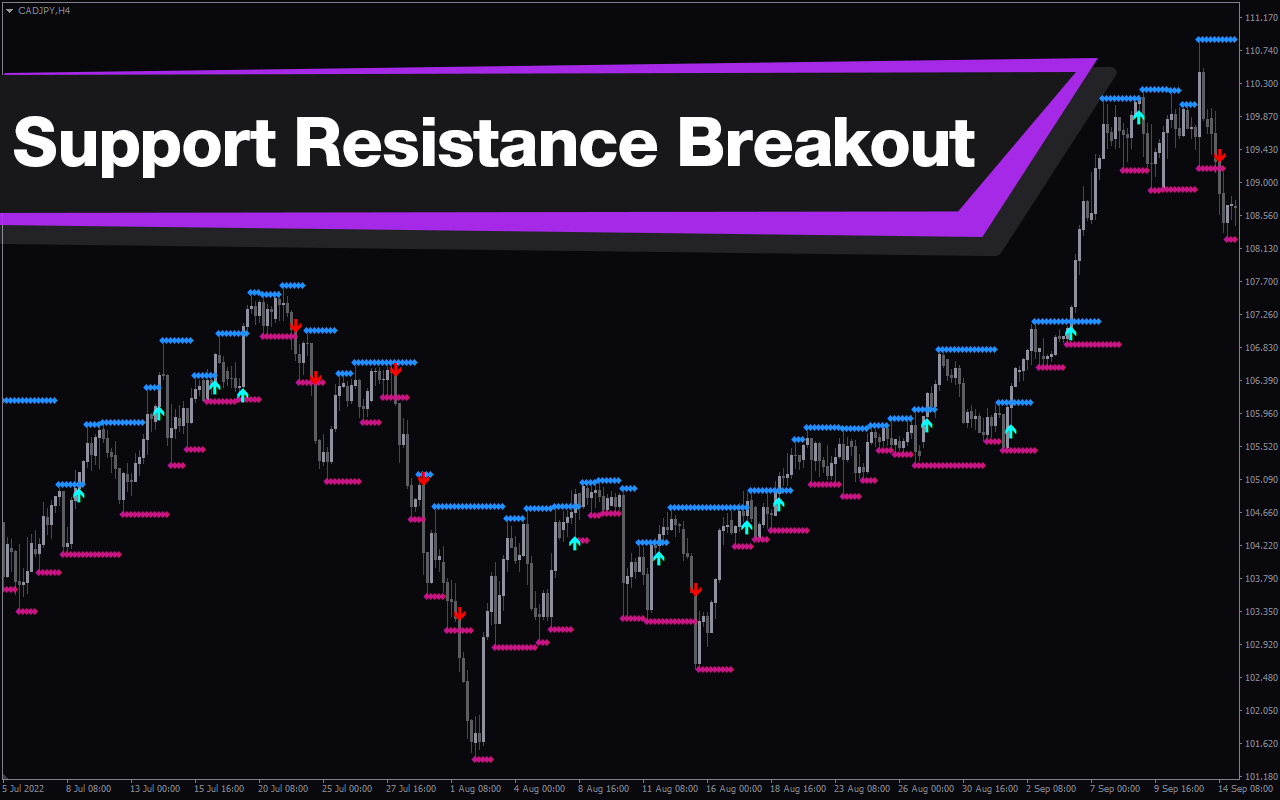
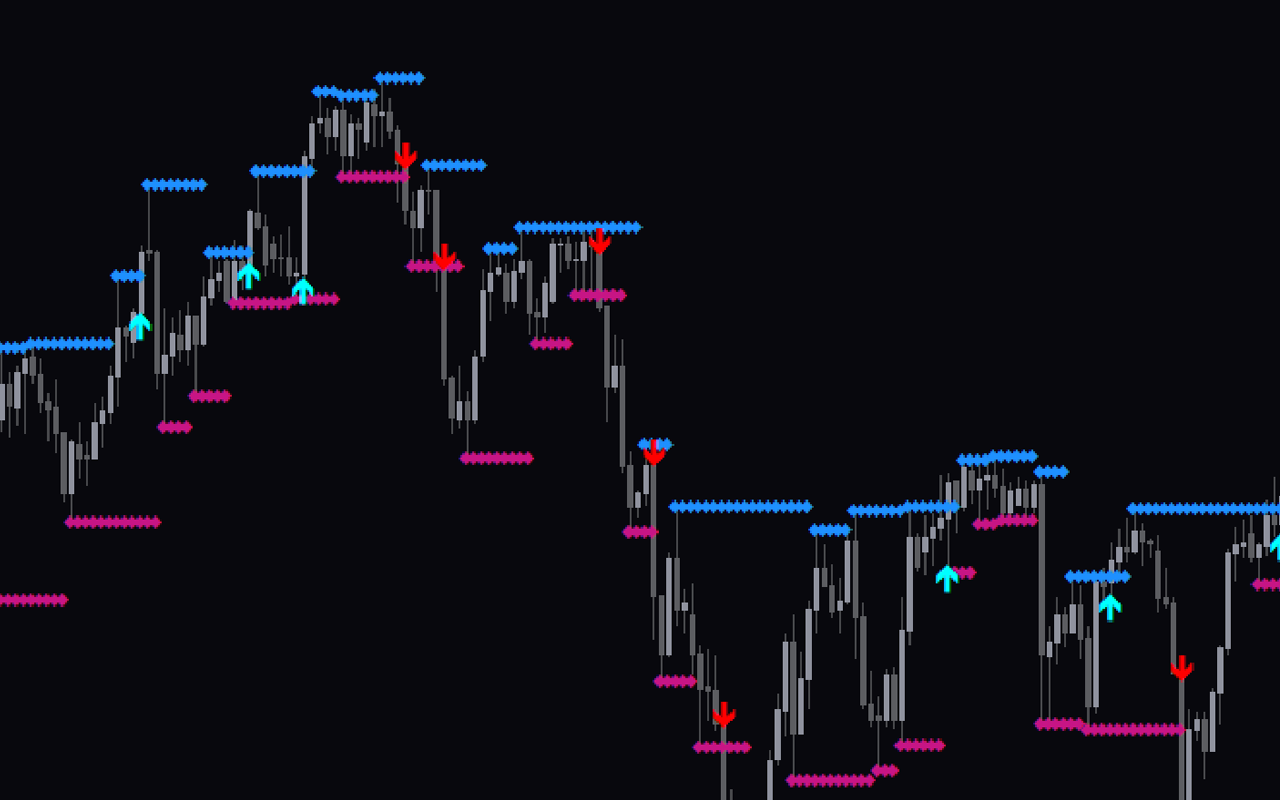
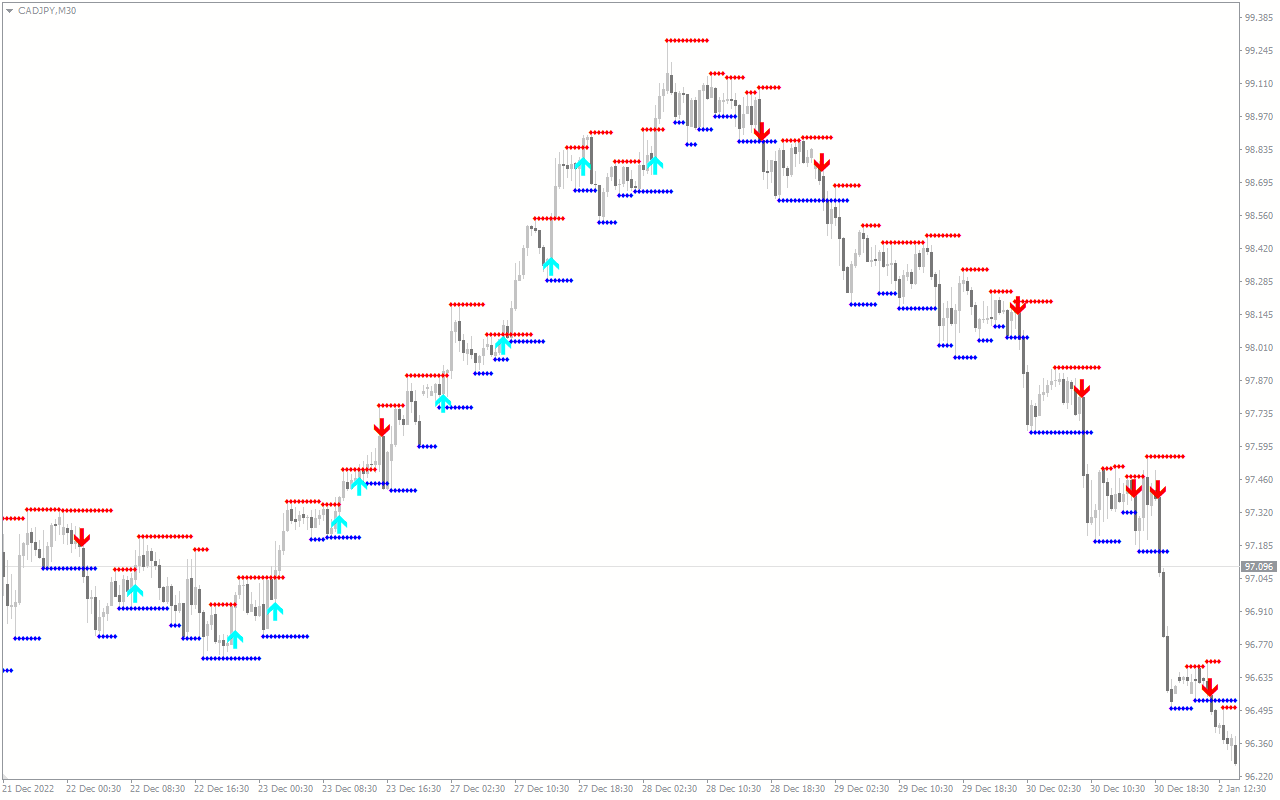
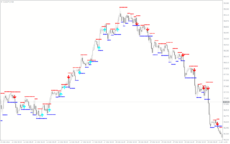
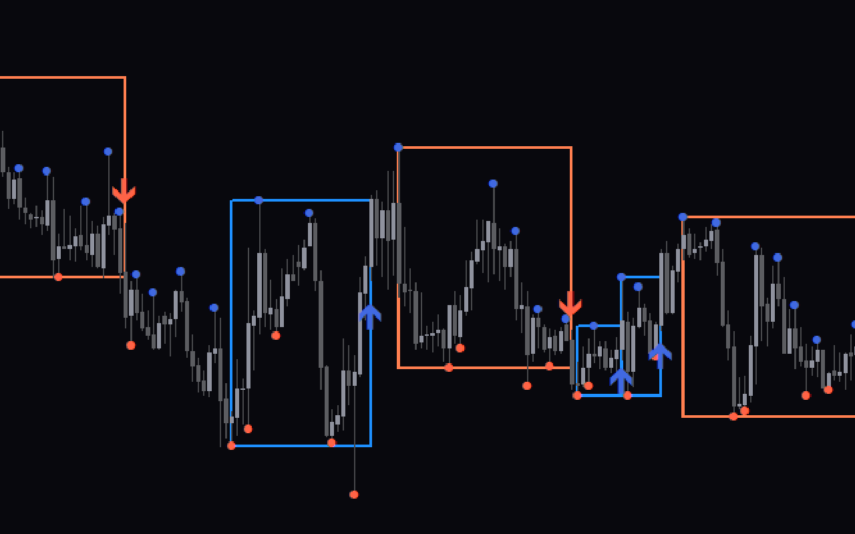
The Support Resistance Breakout Arrows Indicator For MT4 uses Fractal, CCI, and RSI to generate buy and sell arrow signals for traders. Additionally, the indicator automatically plots significant support and resistance levels. Traders can use these lines to add positions during a robust trend.
Importantly, this Metatrader 4 indicator ensures that the signal arrow and the support and resistance lines remain unchanged once indicated. Additionally, the indicator is effective across various time frames, though best suited for day trading. However, traders with a longer-term approach can use the H4, Daily, and Weekly chart timeframes.
Moreover, the indicator doesn’t rely on pivot levels but identifies Support and Resistance lines and zones through Fractals, CCI, and RSI. Traders can filter signals by adjusting CCI levels and setting RSI thresholds for overbought and oversold conditions using the indicator settings.
How the Indicator Can Benefit you
The Support Resistance Breakout Arrows indicator has numerous benefits. Here are some ways you can use the indicator.
- The indicator plots significant support and resistance levels automatically. These levels remain on the chart after you use them. Support and resistance levels are important in trading. When the indicator automatically plots these levels, it lets you focus on other aspects of your trading strategy.
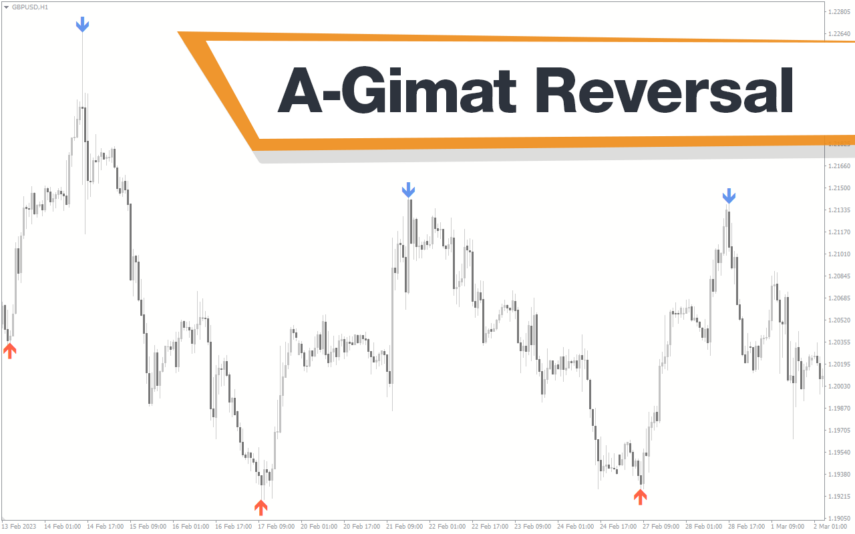
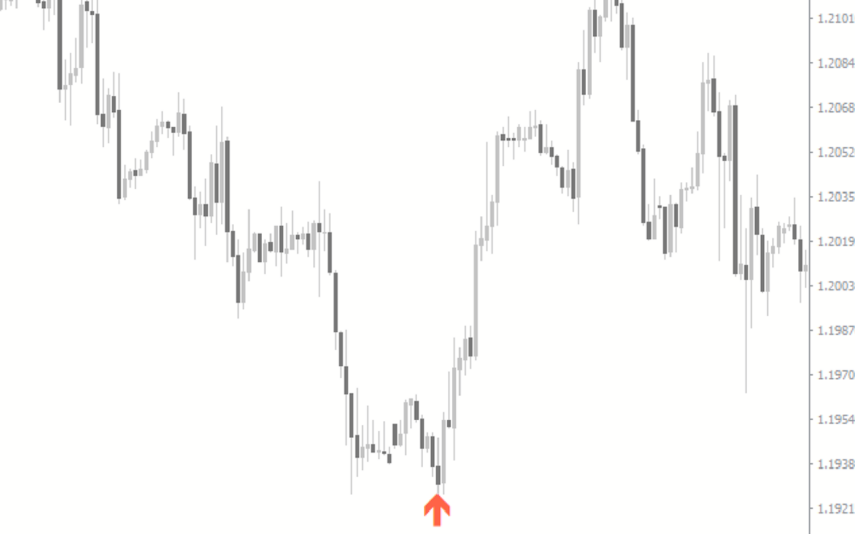
- The indicator provides clear trade entry signals. They are in the form of either blue or red arrows. Blue arrows indicate a buy signal, while red signals represent a sell signal.
- The arrows that the indicator draws on the charts represent breakouts. These breakouts are important as they indicate the start of a new trend. This feature is important for trend-following strategies.
Indicator Settings Description
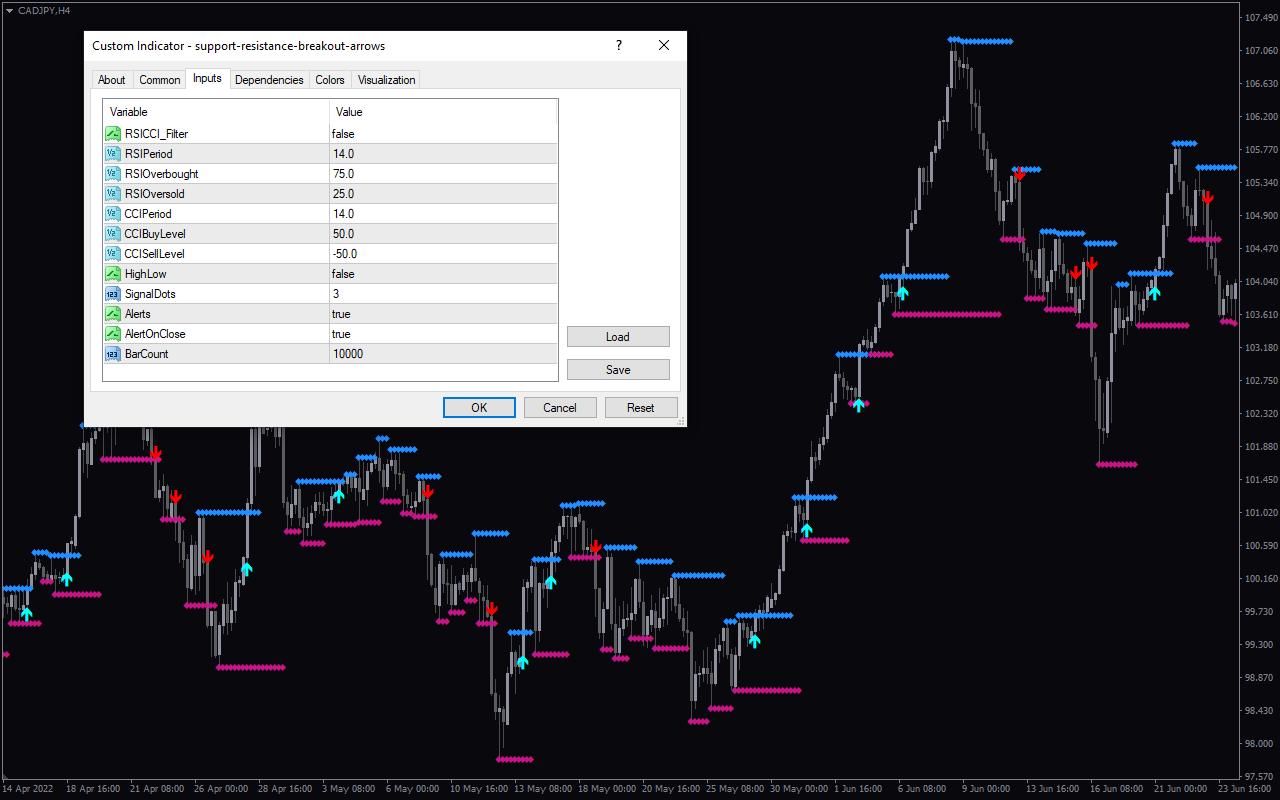
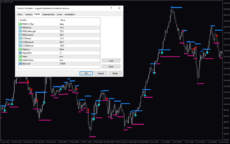
The indicator has settings that you can customize depending on your trading strategy.
RSICCI_Filter: You can enable RSICCI filter.
RSI Period: You can change the RSI period.
RSI Overbought: You can edit the RSI overbought threshold.
CCI Period: You can change the CCI period.
CCI Buy level: You can change the level at which the CCI shows a buy signal.
CCI Sell level: You can change the level at which the CCI shows a sell signal.
High low: You can enable or disable this alert, which informs you when a high or low is broken.
Signal Dots: You can change the number of dots that validate the signal.
Alerts: You can enable or disable alerts from the indicator.
Alert on close: You can enable the indicator to send you alerts when a candle closes during a breakout.
Bar count: You can change the number of bars to display the indicator.

Reviews
There are no reviews yet.