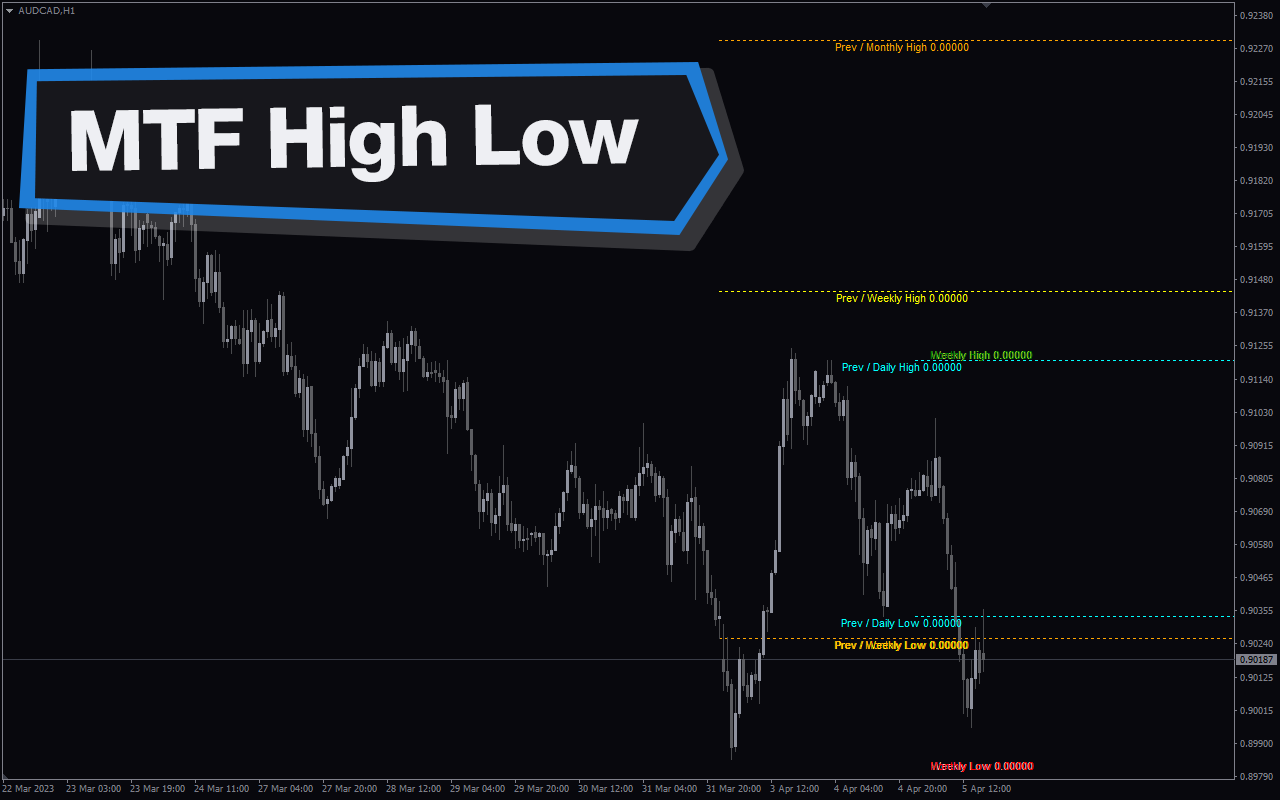
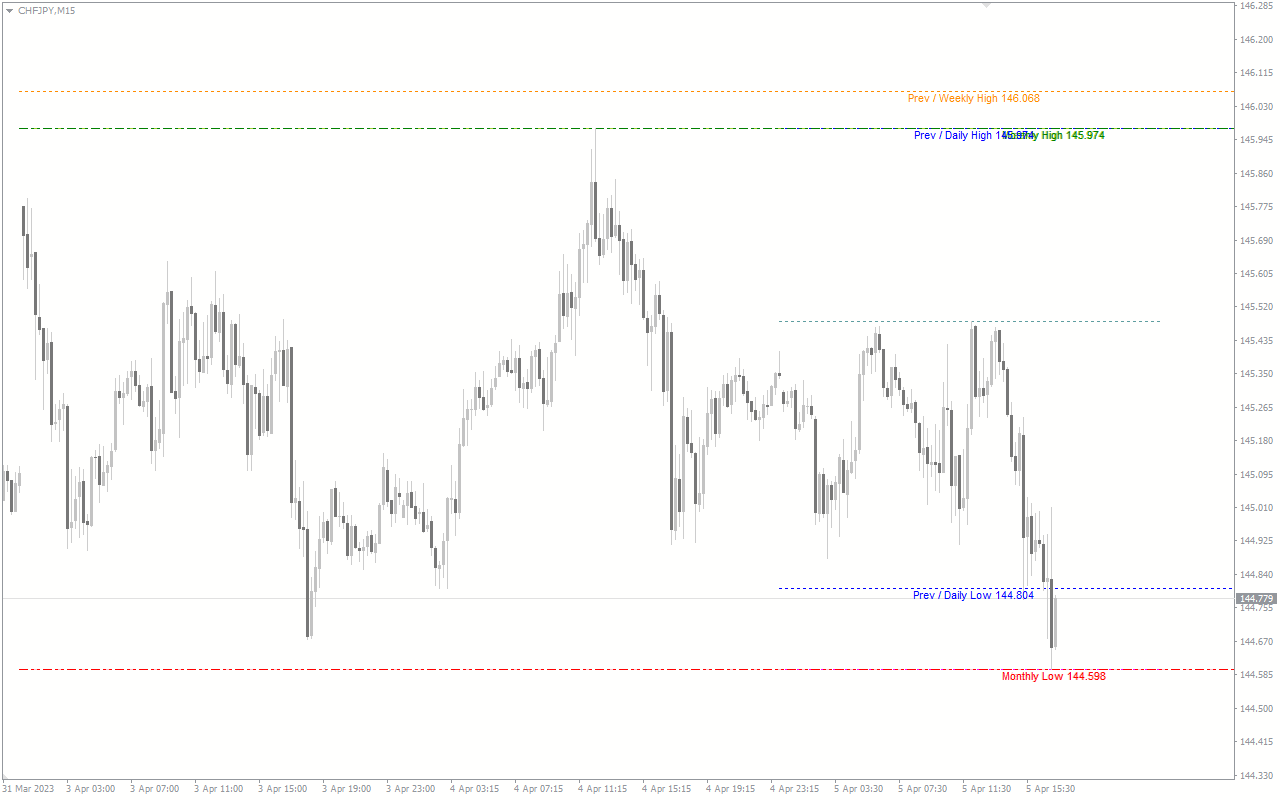
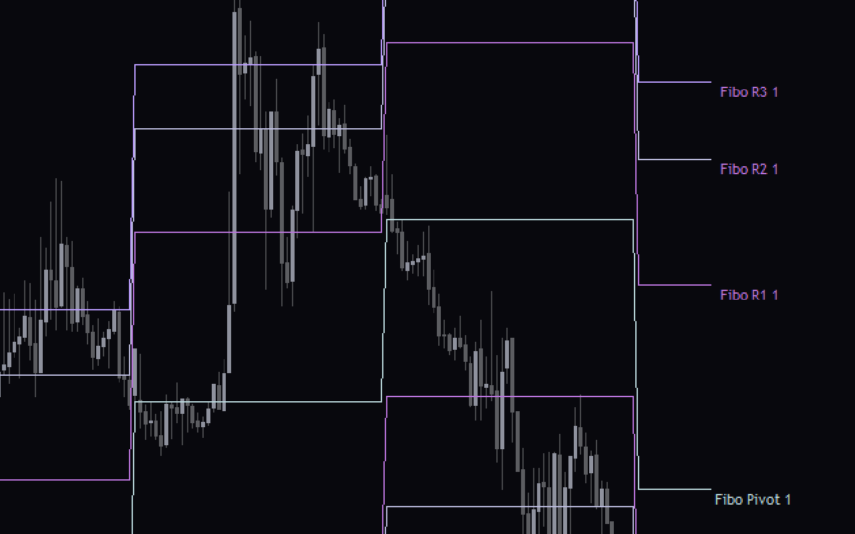
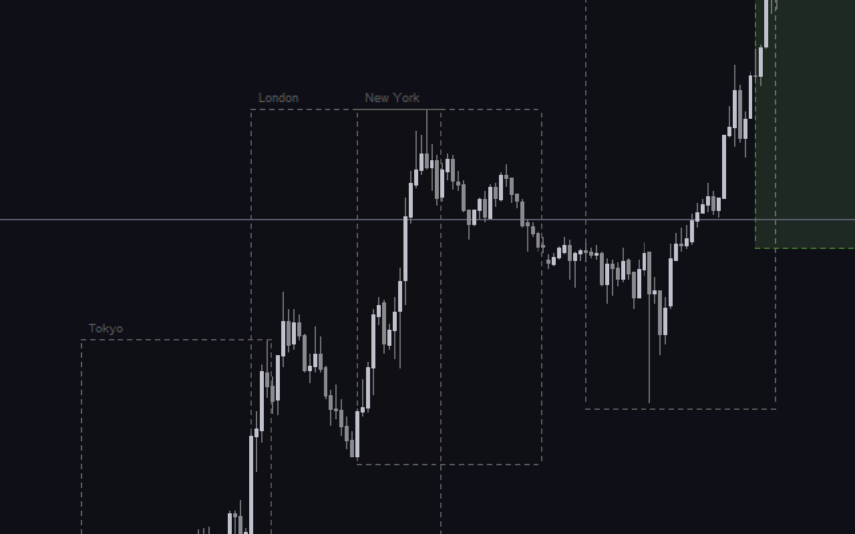
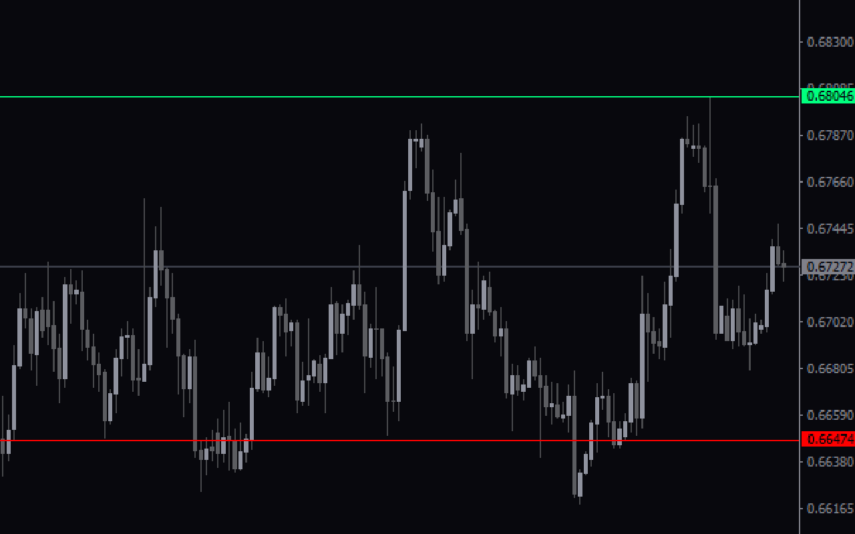
The MTF High low MT4 indicator plots multiple high and low levels on the current chart time frame. It includes an exhaustive list of current and previous day, current and previous week, current and previous monthly high and low. Furthermore, it shows the daily, weekly and monthly pivots on the current chart time frame.
Features of MTF High Low MT4 Indicator
The MTF high low indicator as its name suggests plots the high and low prices of multiple chart time frames on the current chart. The high and low of these levels act as support and resistance levels. So, forex traders can be well aware of these levels and enter the markets accordingly using this indicator.
The indicator extends and draws the high and low levels of the previous day, week or month well into the current time frame. As a result, traders can keep tab of the current and previous day, week or monthly level continuously.
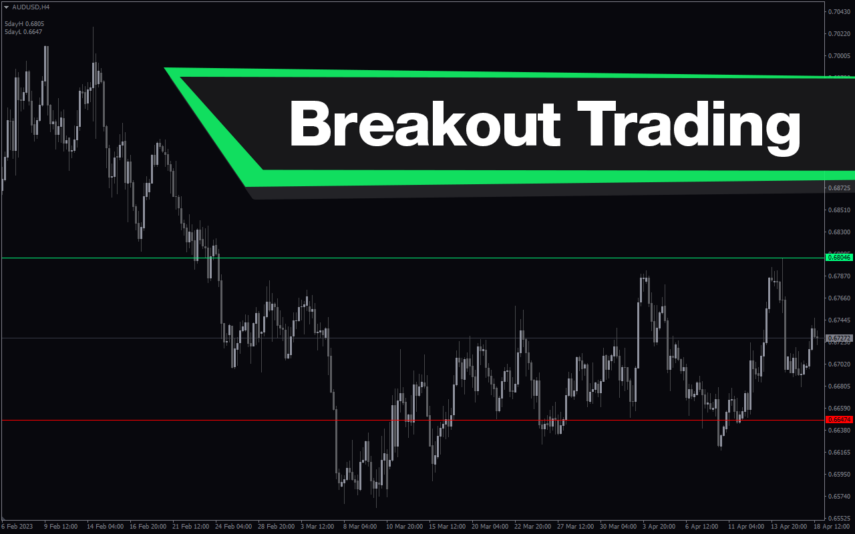
A simple trading strategy is to enter the markets upon the breakout or a breakout failure of these important support and resistance levels. Traders can enter buy position upon the breakout of resistance lines and open sell trades if a support is broken. Support and resistance levels are susceptible to breakout failure. So, traders should confirm breakout or breakout failures using price action before entering a trade.
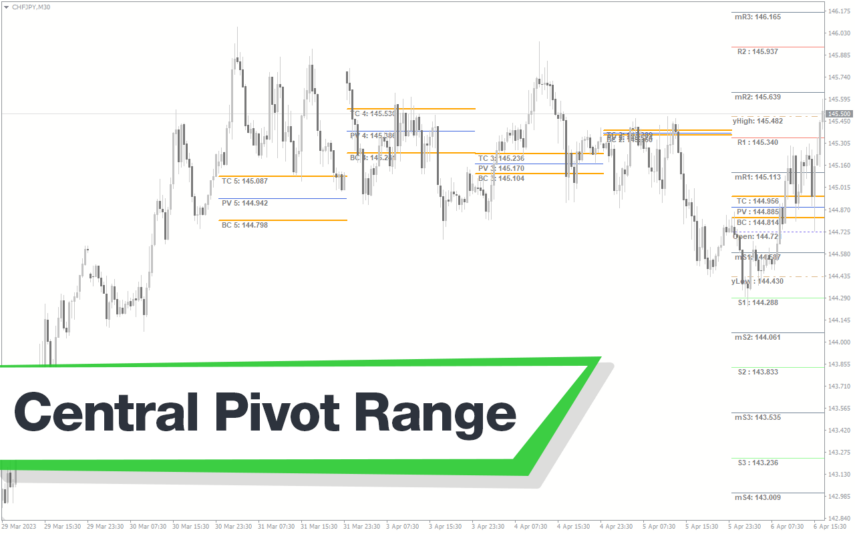
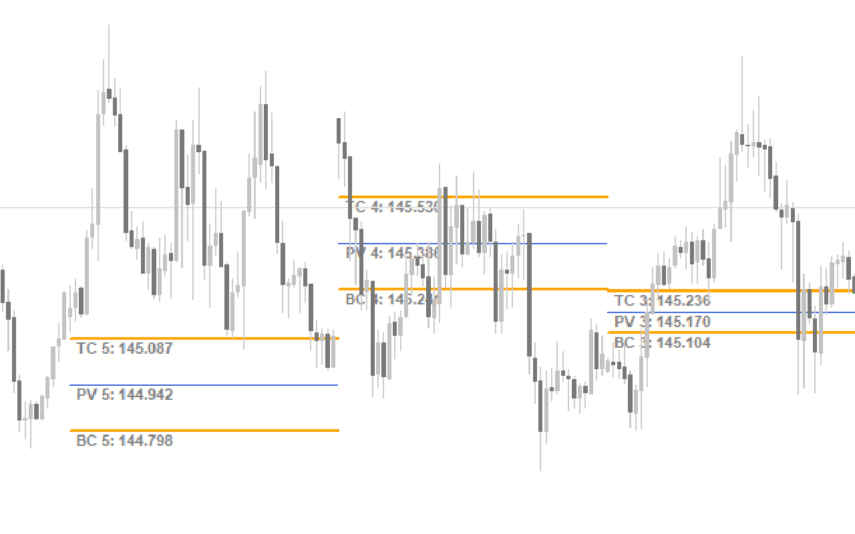
Another important feature is the inclusion of daily, weekly and monthly pivots which act as strong support or resistance. Traders should consider entering trades using pivot trading rules.
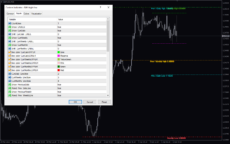
In fact, the indicator inputs settings are highly customizable. So, forex technical traders can apply different colors and labels and enable or disable high / low or lines according to their requirements.
Benefits of Using the Indicator
The indicator is most beneficial for new forex traders; it helps traders with valuable information of the strongest support and resistance levels. As a result, it helps them avoid entering the markets very close to these levels.
On the other hand, breakout of these levels dictates the trend direction in the near term. So it enhances the traders to enter profitable trading positions. Since these support and resistance are of higher time frames, it helps to enter the markets with a low risk and anticipate good reward.
The indicator is visible on all intraday chart time frames and the daily, weekly and monthly price charts. As a result, it is beneficial for all levels of short and long term forex traders.
Indicator Settings Description
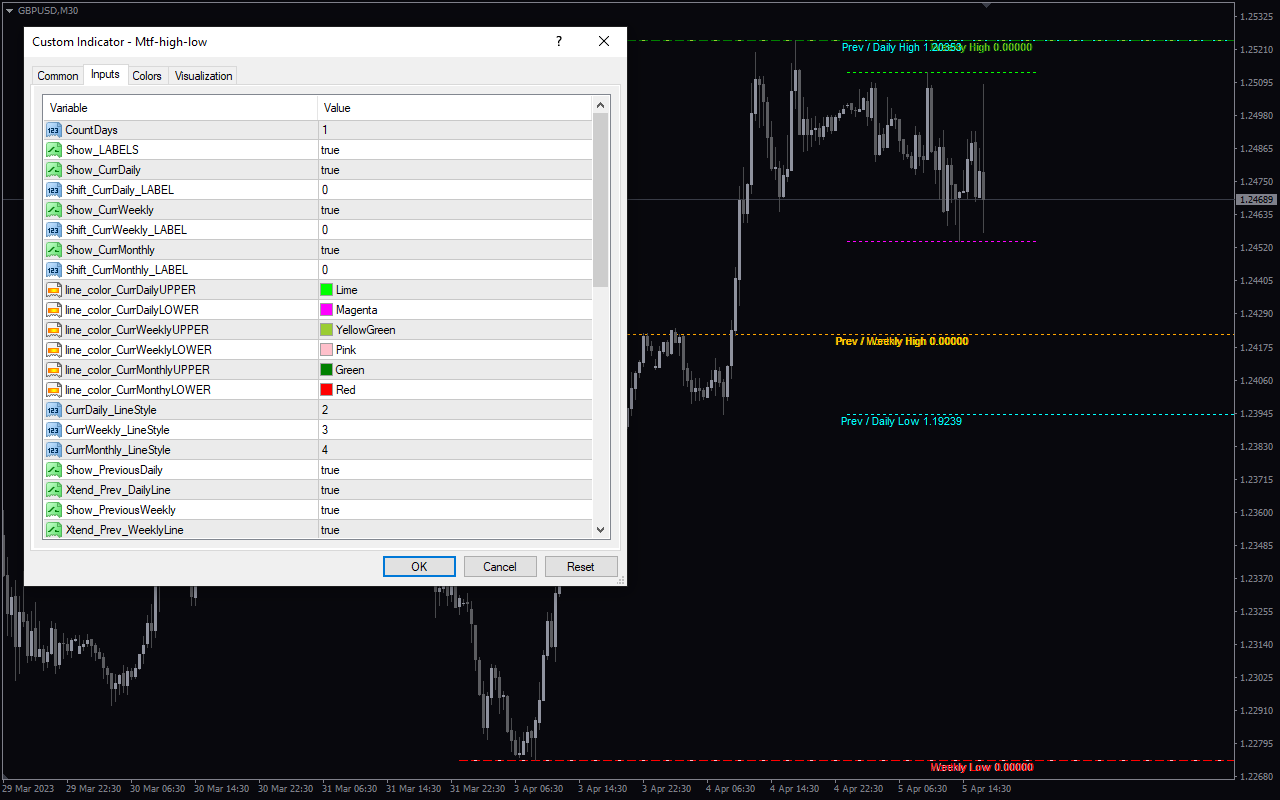
CountDays:, Show_LABELS:, ShowCurrDaily:, ShiftCurrDaily_LABEL:, ShowCurrWeekly:, ShiftCurrWeekly_LABEL:, ShowCurrMonthly:, ShiftCurrMonthly_LABEL: Enables these lines and shifts them continuously to the right as new candles form.
Line_color_CurrDailyUPPER:, line_color_CurrDailyLOWER:, Line_color_CurrWeeklyUPPER:, line_color_CurrWeeklyLOWER:, Line_color_CurrMonthlyUPPER:, line_color_CurrMonthlyLOWER: CurrDaily_LineStyle:, CurrWeekly_LineStyle:, CurrMonthly_LineStyle: Changes the line color and style.
Show_PreviousDaily:, Xtend_Prev_DailyLine:, Show_PreviousWeekly:, Xtend_Prev_WeeklyLine:, Show_PreviousMonthly:, Xtend_Prev_MonthlyLine:, line_color_PreviousDaily:, line_color_PreviousWeekly: line_color_PreviousMonthly: PreviousLine_Style:, Shift_Prev_LABEL: Enables previous lines and changes color settings.
Show_CurrRectangles_Display:, Show_Rectangles:, Rectangles_Curr_DayPeriod_only:, Show_Daily_Rectangle:, Daily_Rectangle_Color:, Show_Weekly_Rectangle:, Weekly_Rectangle_Color:, Show_Monthly_Rectangle:, Monthly_Rectangle_Color: Enables to plot rectangles of the defined areas and changes the color.
Show_daily_Pivots:, Daily_Pivot_color:, Daily_Pivot_LineWidth:, Show_weekly_Pivots:, Weekly_Pivot_color. Weekly_Pivot_LineWidth: Show_Monthly_Pivots:, Monthly_Pivot_color:, Monthly_Pivot_LineWidth: ShiftPivotLABELS: Enables the daily, weekly and monthly pivot lines and changes the color.


Reviews
There are no reviews yet.