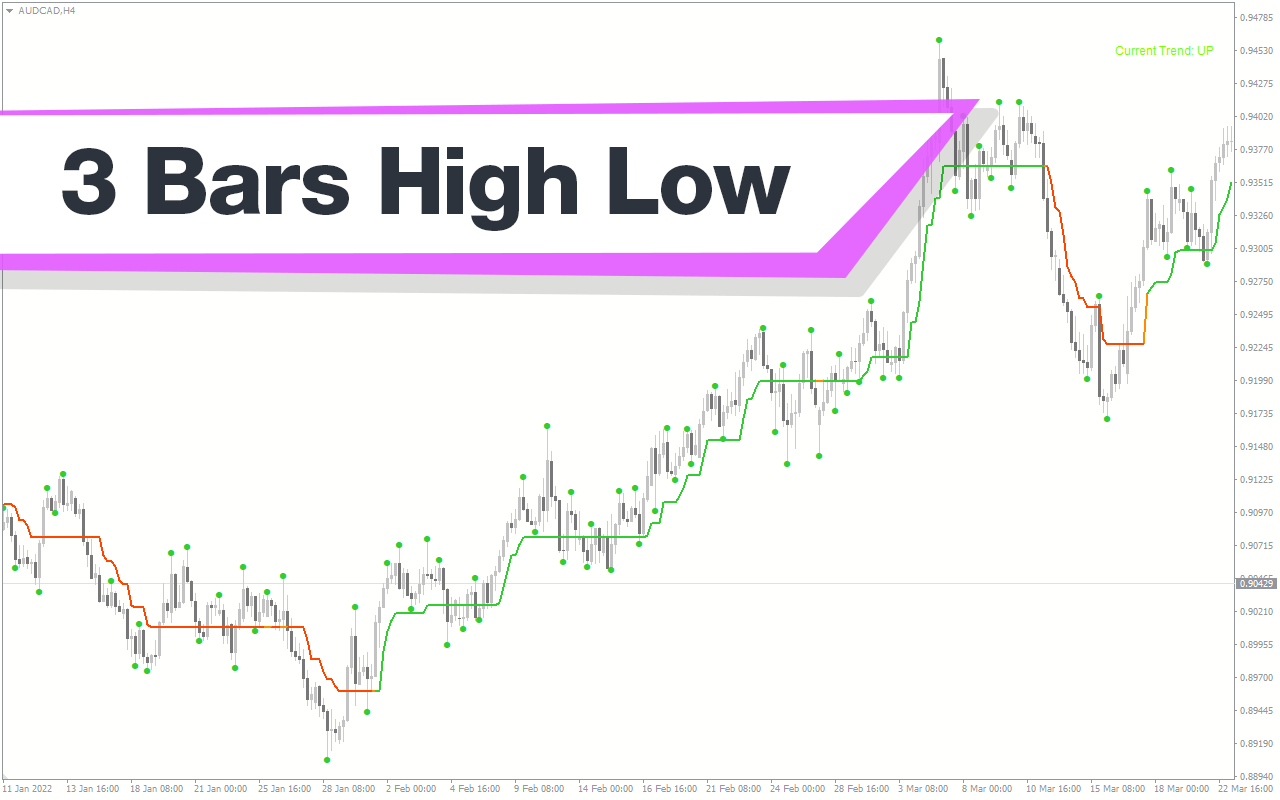
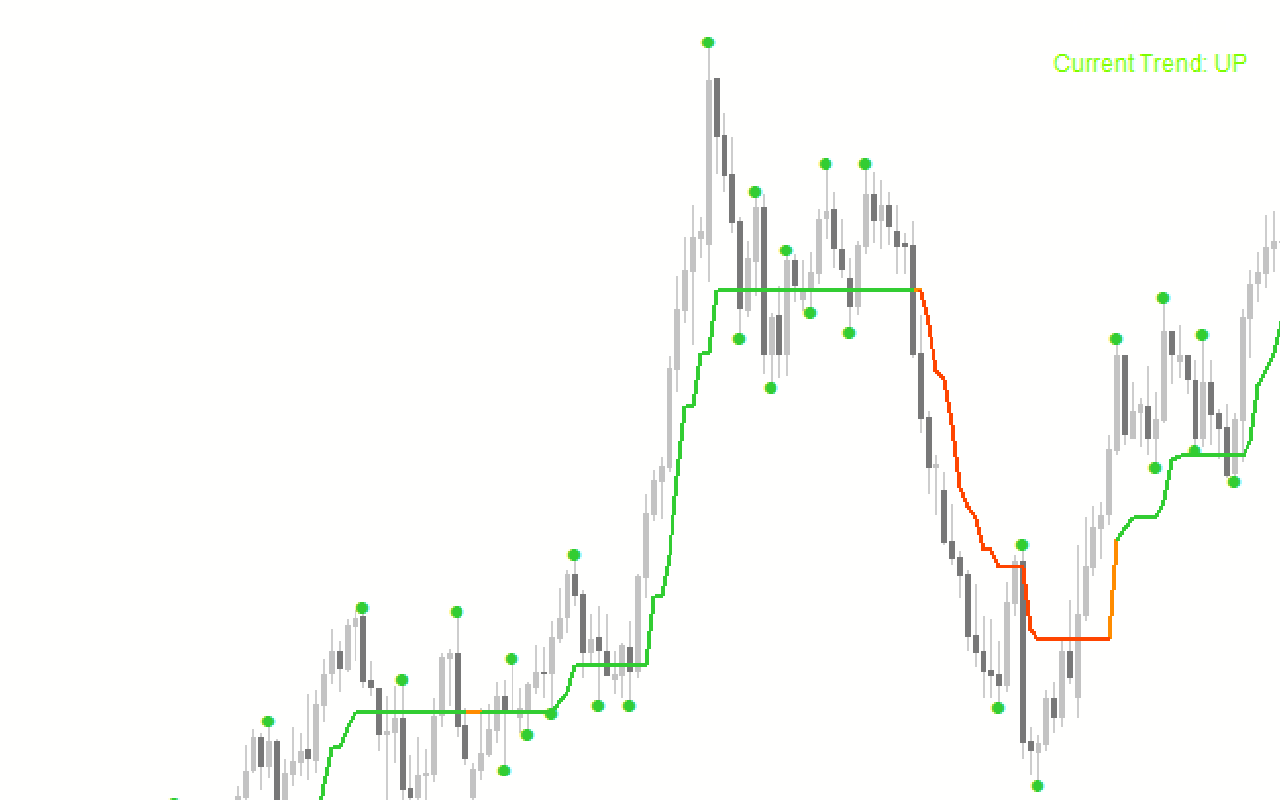
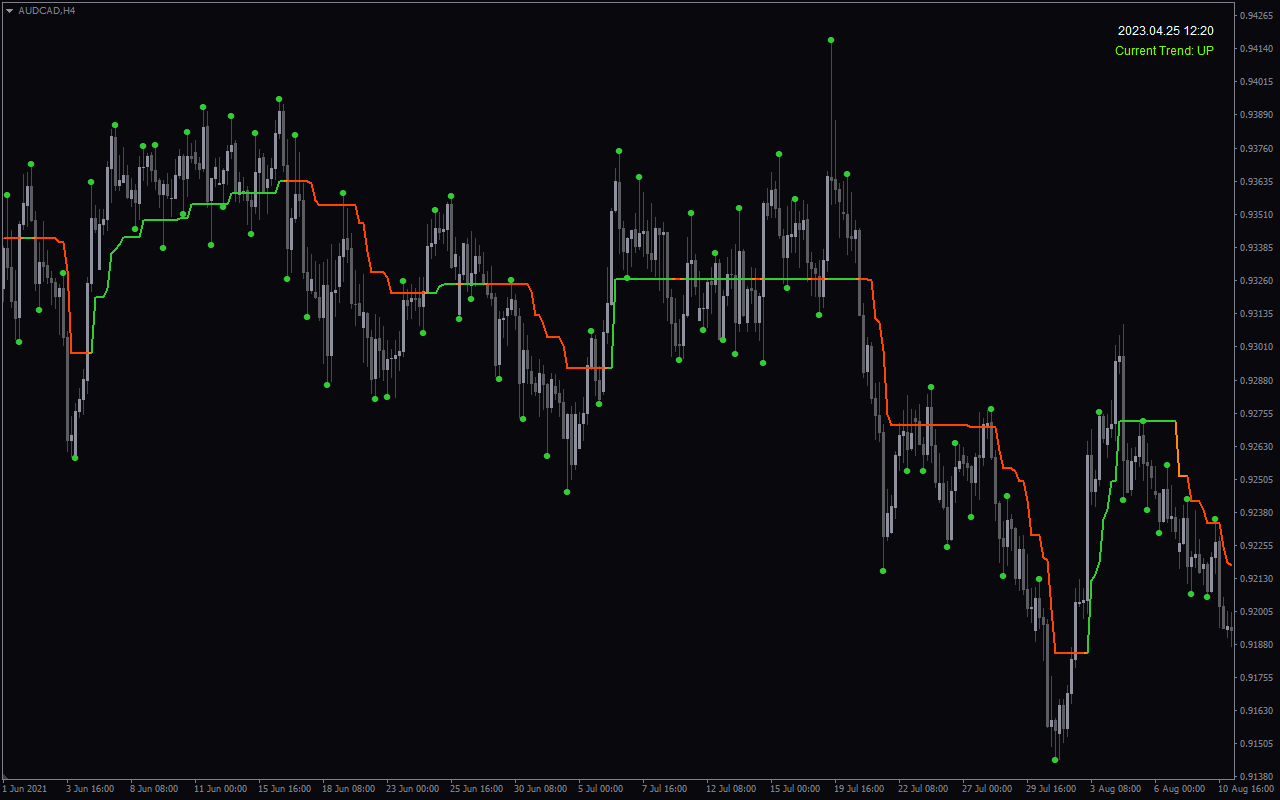
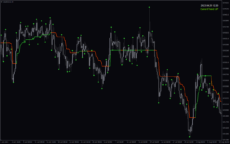
The 3 Bars High Low Indicator for MetaTrader 4 (MT4) evaluates the sequence of the last three consecutive candlesticks’ highs and lows to determine the market condition (bullish, bearish, or ranging). It displays a dynamic line on the price chart using the Average True Range (ATR) and Commodity Channel Index (CCI) indicators. The line turns LIME when the indicator detects an uptrend and turns Orange RED in a downtrend.
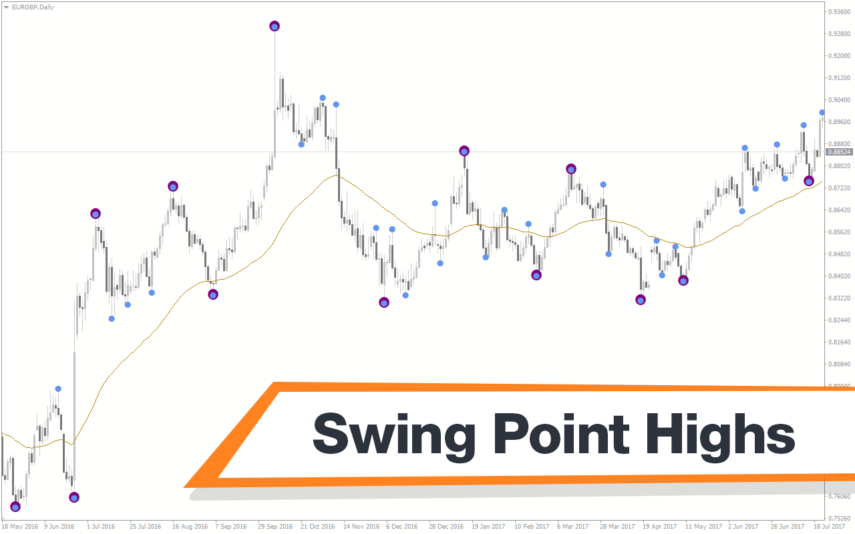
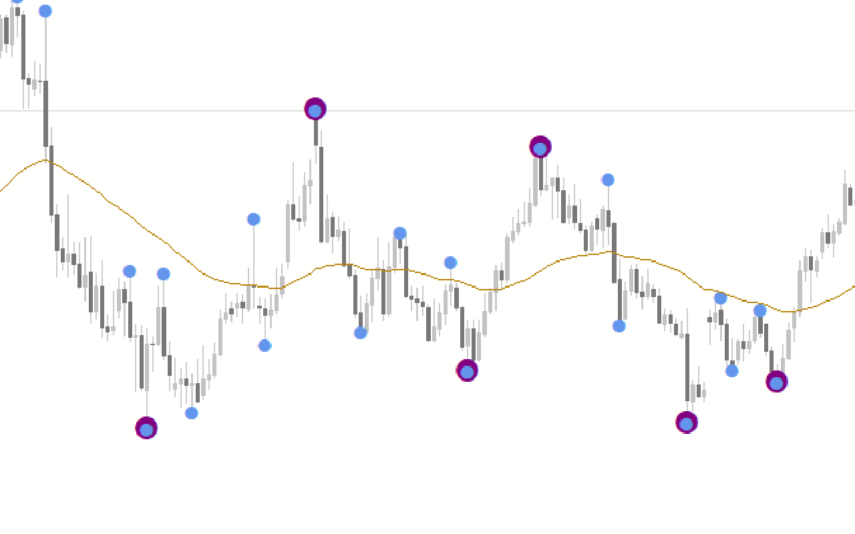
Furthermore, the dots are the fractal zones for potential trend reversal or trend continuation trading opportunities after a breakout. Essentially, the fractal zones are areas of support and resistance for possible trend reversal/breakout trading opportunities. They are also ideal zones to place a Stop Loss order.
So, a Forex trader may look for a buy entry opportunity, for instance, when the indicator’s line turns red and a fractal (dot) appears below a candlestick. Besides, a trader may also look for a buying opportunity when the price breaks above the fractal, in an uptrend, for instance.
However, the indicator is recommended to be used in conjunction with technical analysis/other indicators to make better trading decisions.
Features of the 3 Bars High Low Indicator
The 3 BARS High Low indicator’s algorithms harmonize the 3 bars high low formation and signals of the ATR, CCI, and fractals to display a clearer picture of the market condition. It also has an alert system that pops up on the screen or sent through emails whenever the indicator detects a new trend.
Benefits of Using the Indicator
- Support and Resistance Levels: The highs, lows, and fractals zones are typical support and resistance levels.
- Trend Confirmation: The highs and lows of the indicator would assist Forex traders in identifying the market trend direction and potential reversal zones.
- Trade Entries/Exits: The indicator would also assist Forex traders in finding optimal trade entry/exit zones.
Indicator Description Settings
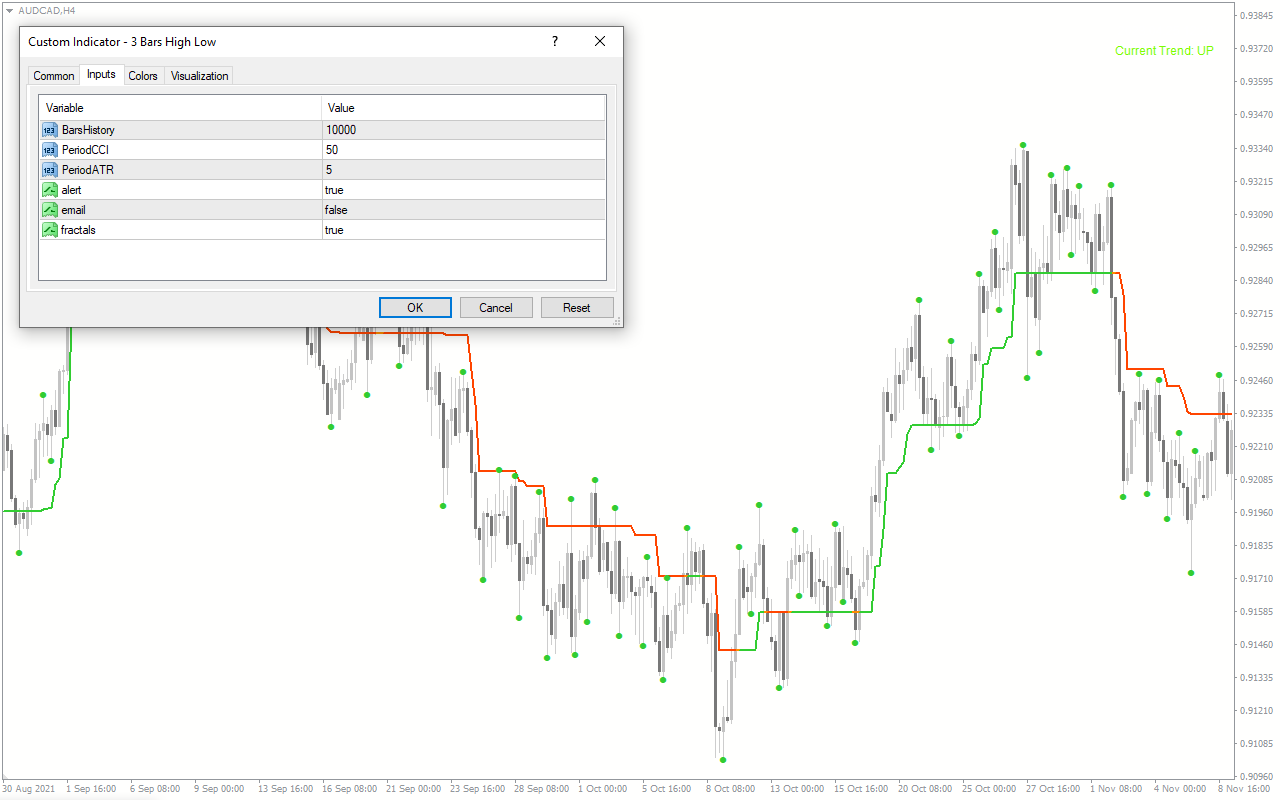
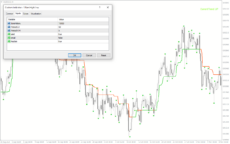
The indicator comes with the following customizable settings:
BarsHistory: This shows the maximum number of bars for trend analysis.
PeriodCCI: This shows the period of the CCI
PeriodATR: This shows the ATR period.
Alert: Enables/Disables signal alert to pop up on the screen.
Email: Enables/Disables signal alerts via email.
Fractals: Enables/Disables: Enables/Disables fractals on the chart.

Reviews
There are no reviews yet.