

Drawing trend lines is an essential skill for traders in the forex market, helping to identify price trends and enhance trading strategies. This guide will walk you through the process of drawing a trend line, not focusing on currency pairs, pips, and various trading concepts.
Understanding Trend Lines
In forex trading, trend lines are a key element of technical analysis. They help visualize the direction of price action, which is crucial for developing effective trading strategies. In general, trend lines are graphical tools used in technical analysis to indicate the direction and strength of a trend by connecting significant highs or lows in a data set, such as stock prices. They can be categorized into uptrend lines (connecting rising lows), downtrend lines (connecting falling highs), and horizontal lines (indicating a stable trend). By extending these lines, analysts can predict future price movements, identify support and resistance levels, and recognize potential breakouts. Despite their usefulness, trend lines are somewhat subjective and can produce false signals, so they are often used alongside other analytical tools to enhance accuracy.
There are two main types of trend lines:
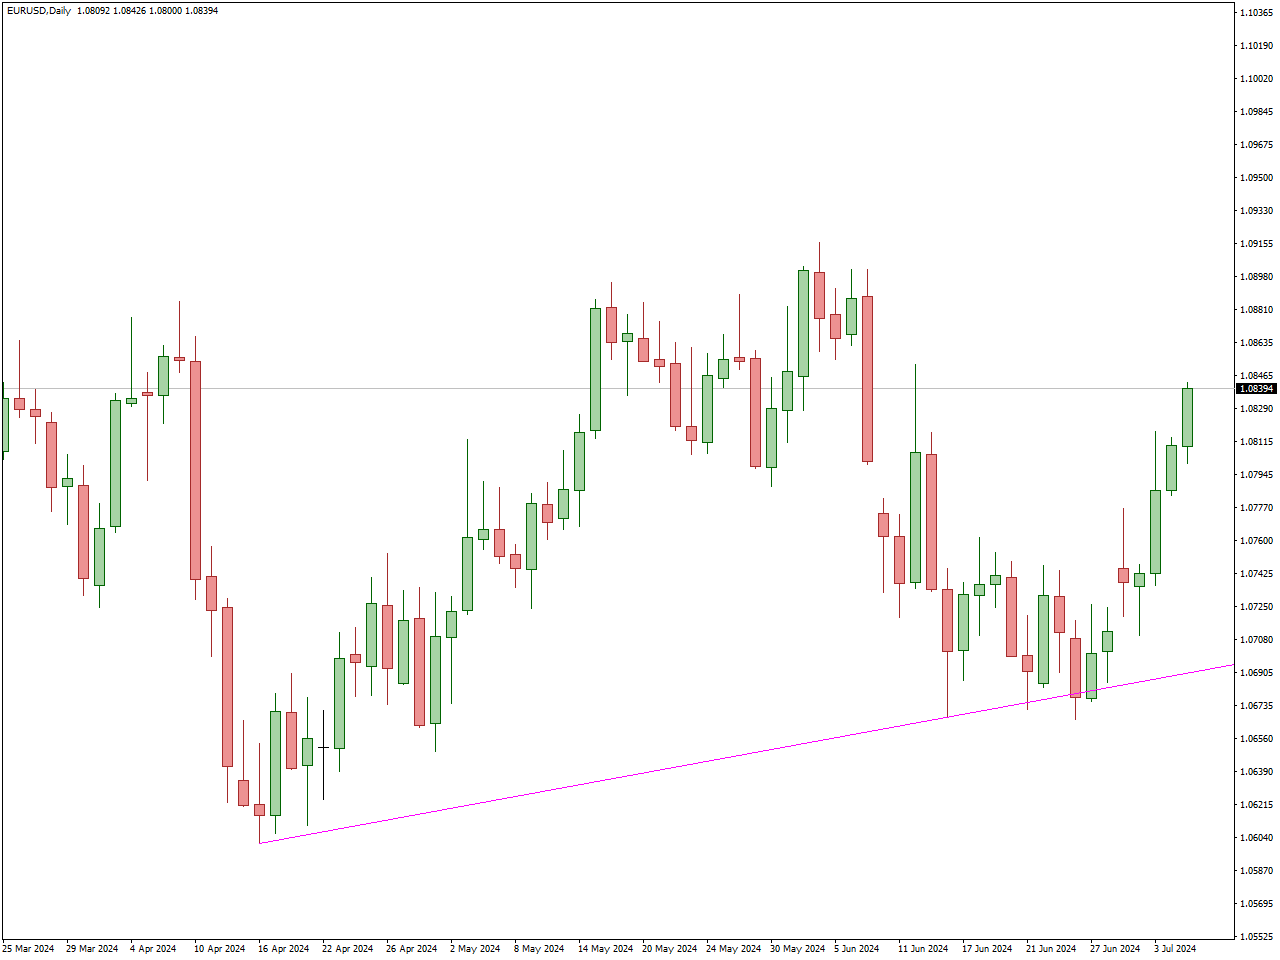
- Uptrend Line: Connects two or more ascending low points on a price chart, indicating bullish price action.
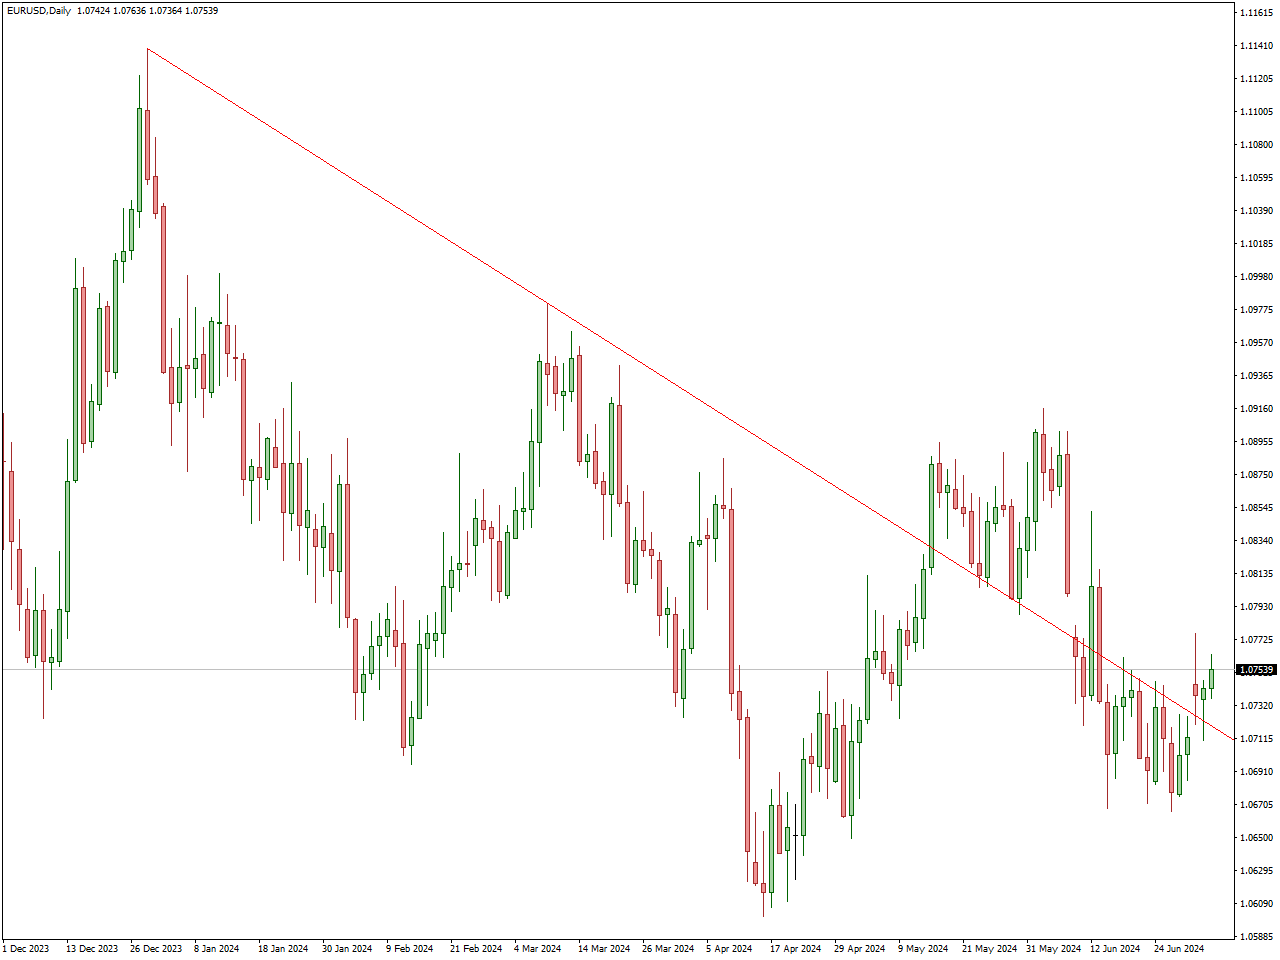
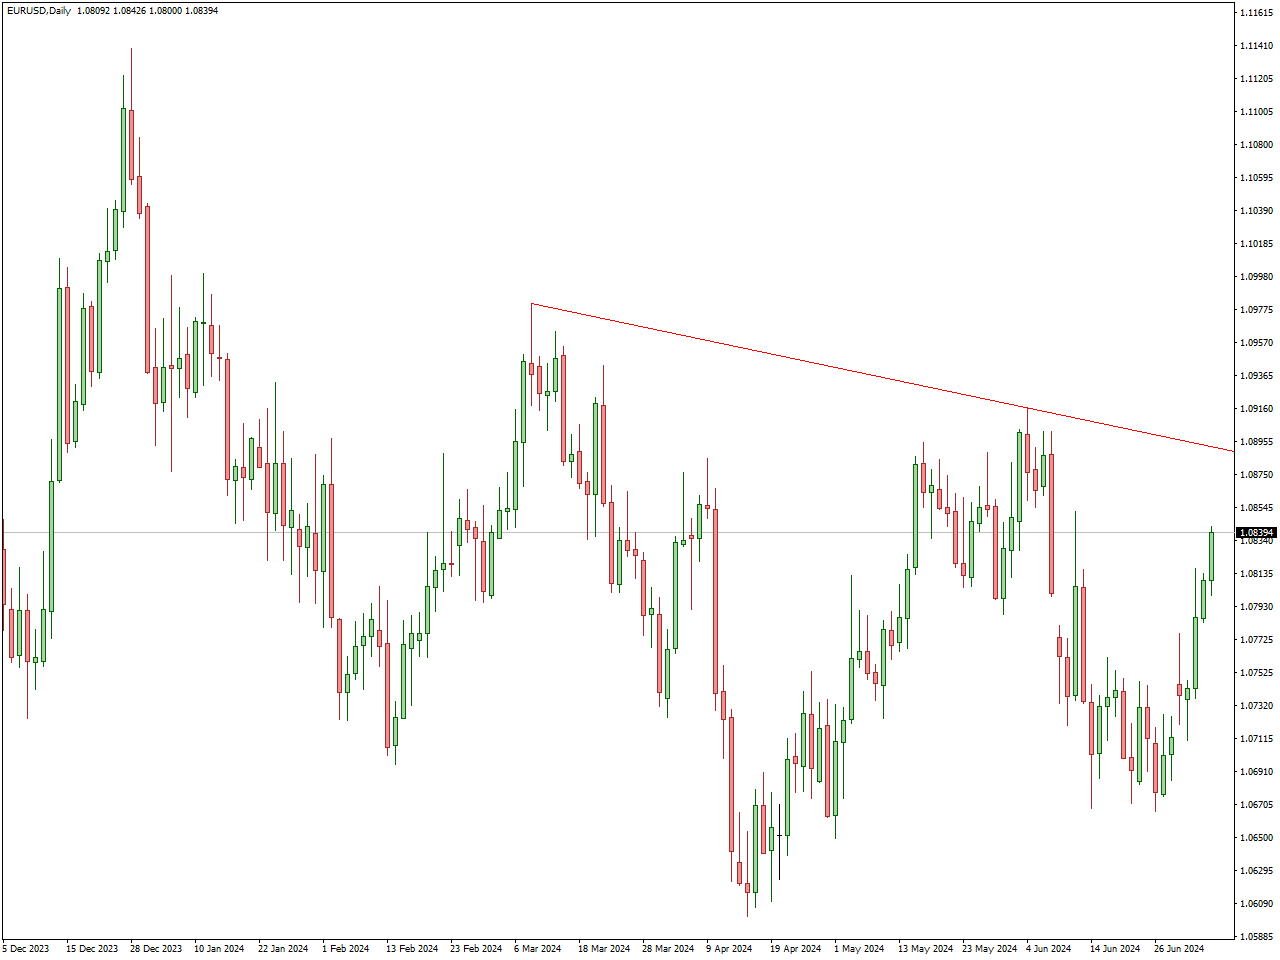
- Downtrend Line: Connects two or more descending high points, indicating bearish price action.
Choosing the Right Chart
Select a suitable chart for your analysis. You can use candlestick charts, line charts, or bar charts on various time frames (daily, weekly, monthly). The choice depends on your trading style, whether it’s scalping, day trading, or swing trading. But in fact, trend lines are more accurate when applied to longer timeframes, as these charts smooth out short-term volatility and provide a clearer picture of the underlying trend, reducing the risk of false signals. For effective analysis, selecting the right chart type is essential, depending on your trading style. Candlestick charts are ideal for detailed price action analysis in day trading and scalping, while line charts are better suited for identifying overall trends in swing trading. Bar charts offer an alternative view similar to candlesticks. Overall, longer timeframes like daily, weekly, or monthly charts provide more reliable trend line signals, supporting more informed trading decisions.
Drawing the Trend Line
Follow these steps using your trading platform:
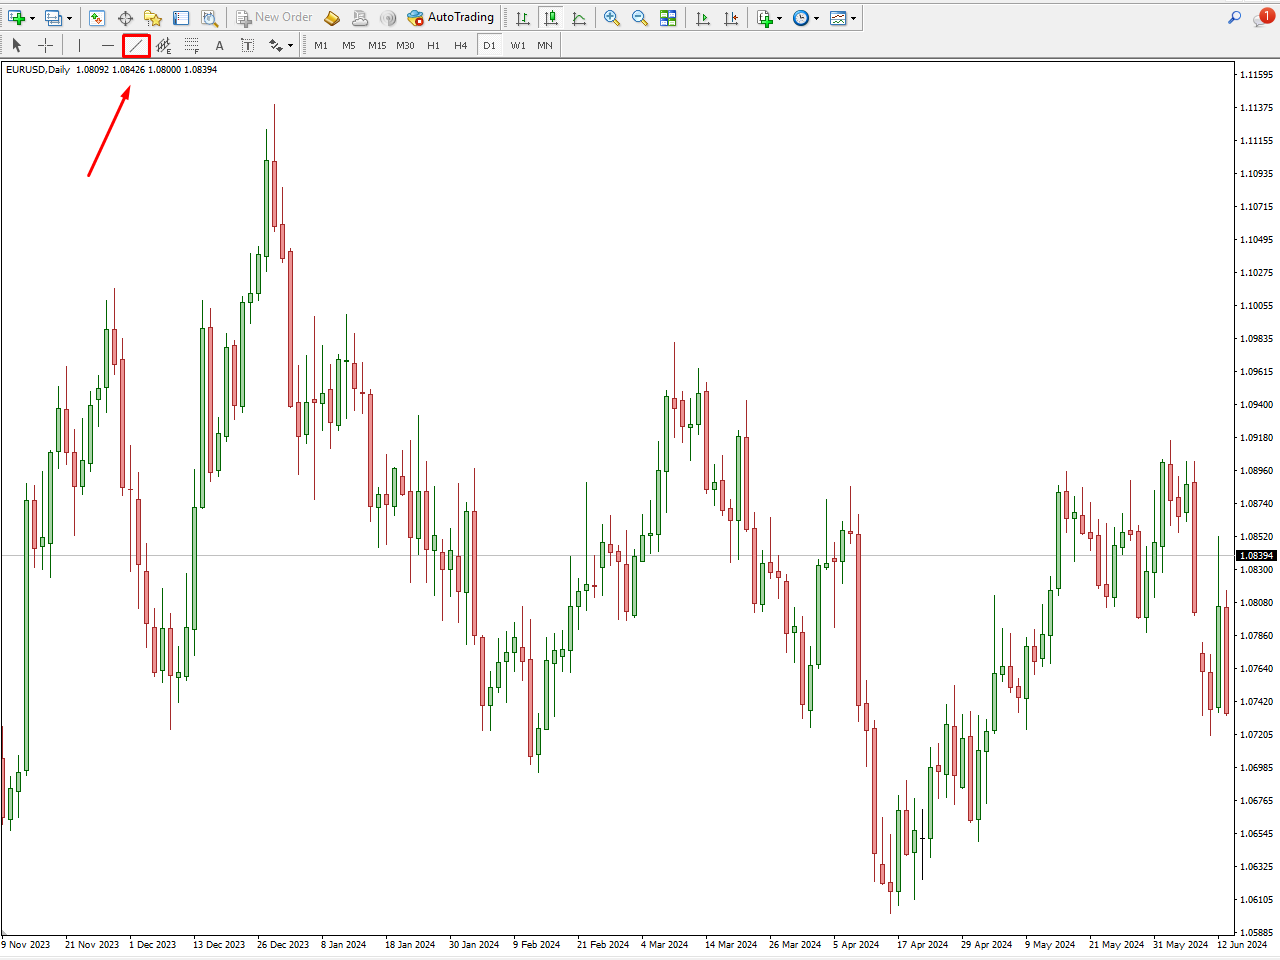
- Select the Trend Line Tool: Most trading platforms, like MetaTrader 4/5, offer a trend line tool.
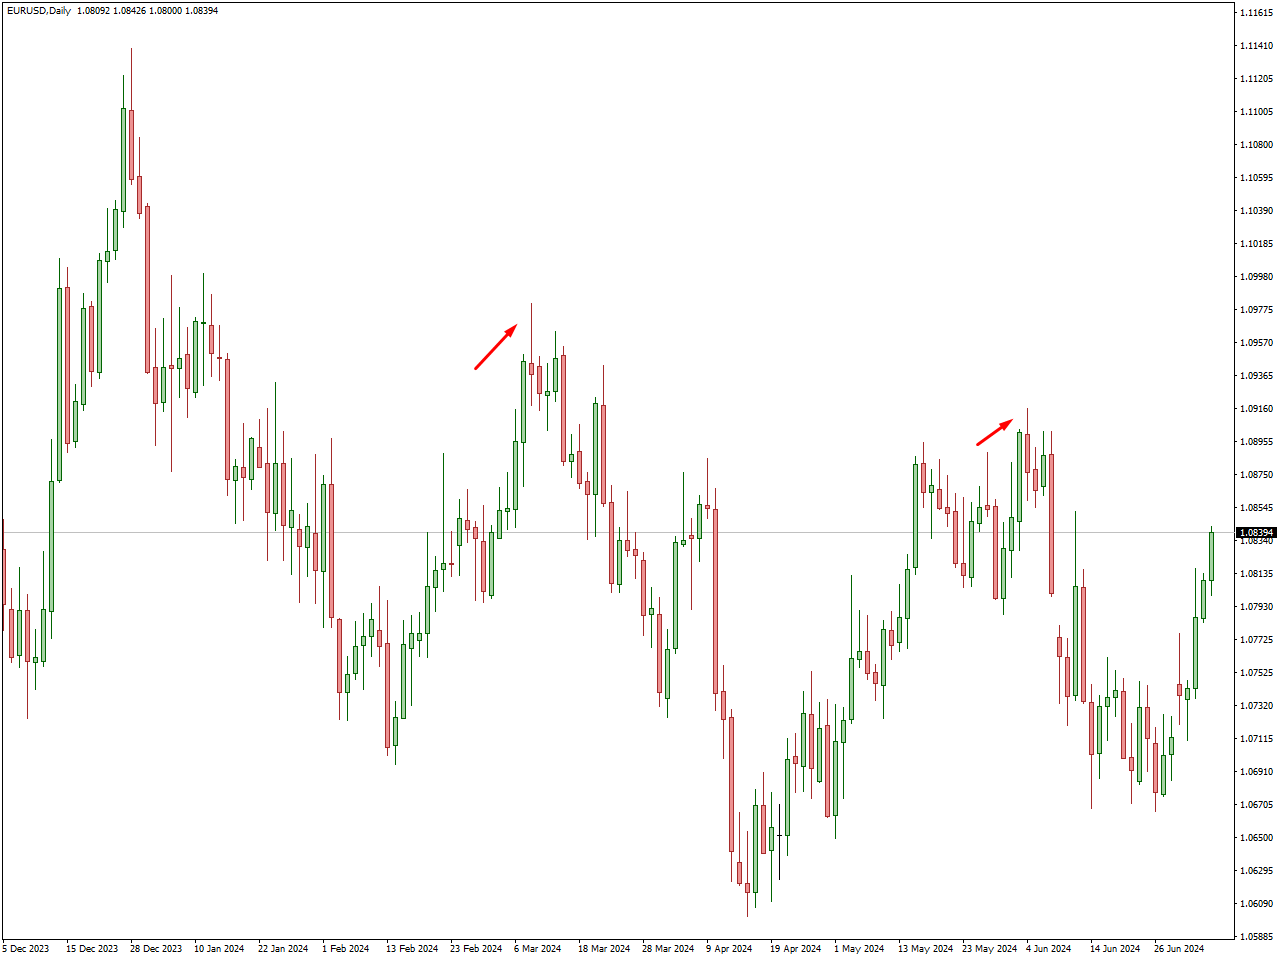
- Mark the First Point: For an uptrend, this is the lowest point; for a downtrend, this is the highest point.
- Mark the Second Point: For an uptrend, this is the next higher low; for a downtrend, this is the next lower high.
- Extend the Line: Draw the line to project the trend into the future.
Calibrating and Verifying
Ensure your trend line is accurate:
- Touch as Many Points as Possible: The more points your trend line touches, the more reliable it is.
- Avoid Forcing the Line: The trend line should naturally align with the price action.
Using Trend Lines for Trading Decisions
Trend lines can help identify trading opportunities and manage risk:
- Entry and Exit Points: Buy near an uptrend line (support) and sell near a downtrend line (resistance).
- Confirm Breakouts: A price breakout through a trend line can signal a trend reversal or continuation. Confirm with other technical indicators and forex signals.
Integrating Trend Lines with Trading Strategies
Trend lines are indeed powerful when integrated with other trading strategies and technical indicators. One effective approach is to combine trend lines with Moving Average Crossovers. For example, in an uptrend scenario, traders can identify a rising trend line and use it in conjunction with a moving average crossover strategy, where a shorter-term moving average (e.g., 20-period) crosses above a longer-term moving average (e.g., 50-period). This crossover can confirm the strength of the uptrend when it aligns with the trend line, providing a strong buy signal. Conversely, in a downtrend, a falling trend line combined with a moving average crossover strategy (shorter-term moving average crossing below longer-term moving average) can confirm a downtrend and provide a sell signal. By adding confirmation from multiple indicators, traders can enhance the reliability of their trading decisions and better navigate market movements while managing risk effectively.
Enhancing Trend Line Analysis with Automated Tools and Indicators
In addition to manually drawing trend lines, traders can utilize automated tools and indicators like those available in MetaTrader 4/5 (MT4/5). Auto trendline indicators in MT4 automatically draw trend lines based on predefined algorithms, removing the subjectivity and potential for human error in identifying significant highs and lows. These indicators continuously update the trend lines as new price data comes in, ensuring that the analysis remains current and relevant.
Conclusion
Drawing trend lines is a fundamental skill in forex trading. By understanding and applying trend lines correctly, you can enhance your trading strategies and make more informed decisions. Remember to continuously monitor and adjust your trend lines as new data emerges, and always use them in conjunction with other forms of analysis, such as fundamental analysis and market sentiment, for the best results.