Within the ever-changing landscape of trading, possessing the appropriate tools is paramount. Pivot Point Indicators emerge as essential tools for traders aiming to achieve accuracy and strategic insight. This guide showcases the Top 7 Pivot Point Indicators, each meticulously crafted to assess market dynamics, pinpoint essential support and resistance levels, and refine decision-making amidst the dynamic financial environment.
Whether you are an experienced trader or embarking on your trading journey, mastering and applying these indicators can offer a notable advantage. Spanning from time-tested methodologies to innovative strategies, the Top 7 Pivot Point Indicators accommodate a range of trading styles and preferences. Let’s explore the distinctive features and advantages of each, guiding you toward more enlightened and successful trading strategies.
Top 7 Pivot Point Indicators
- Pivot Alert Indicator
- Fibonacci Pivots Indicator
- Camarilla Pivots Indicator
- Dark Point Indicator
- PivotPoints.All-In-One
- All Pivot Points Indicator
- Volatility Pivot Indicator
Pivot Alert Indicator
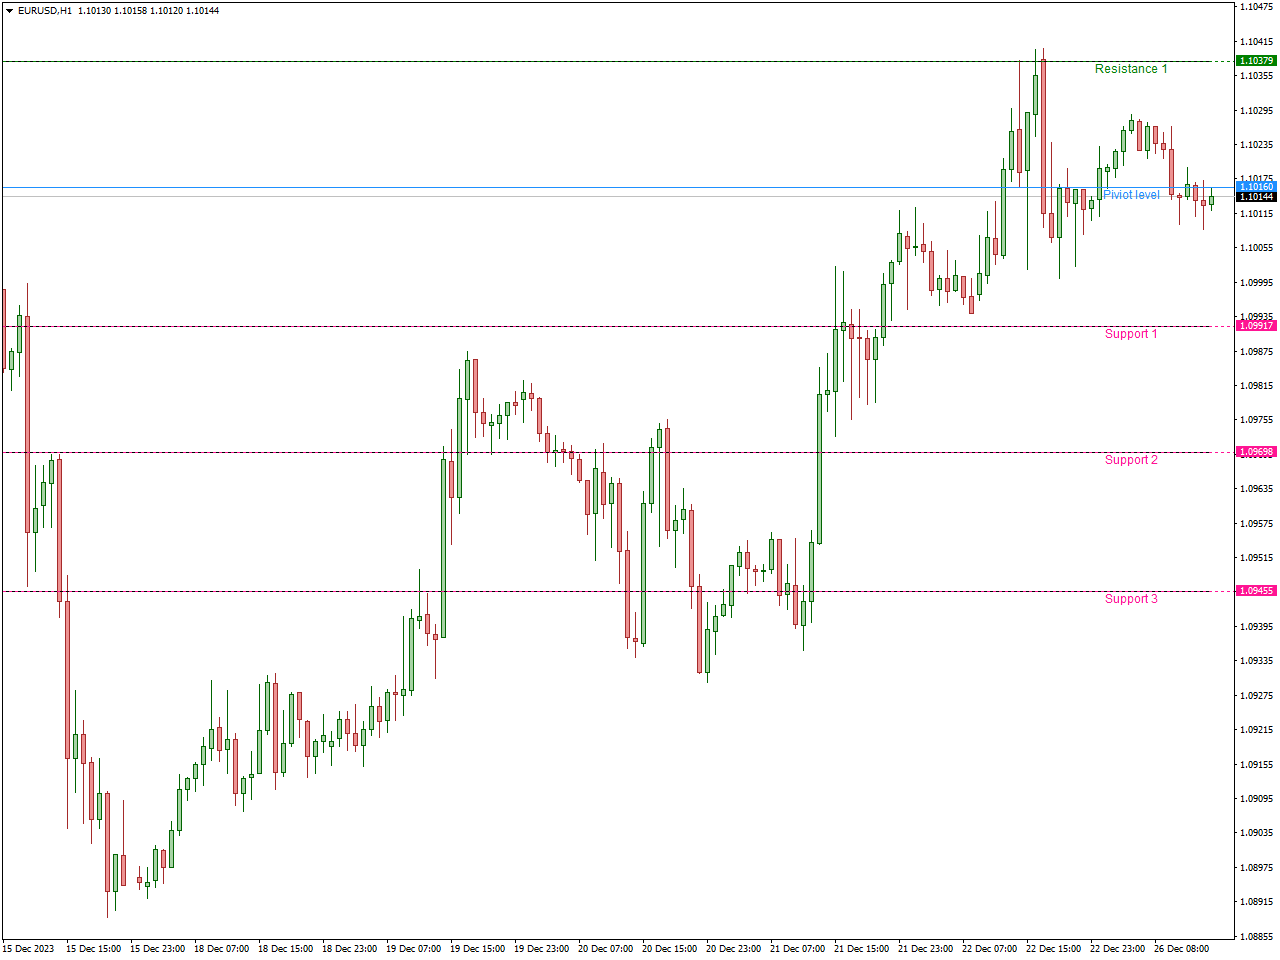
The Pivot Alert Indicator serves as a valuable tool in technical analysis for identifying potential pivot points within financial markets. Pivot points are critical price levels believed by traders to function as either support or resistance zones. This indicator is specifically crafted to notify traders when the price is approaching or reaching these pivotal levels.
In trading decisions, pivot points are frequently utilized by traders to assess entry or exit points. The Pivot Alert Indicator enhances this process by delivering prompt notifications when the price nears a pivot point. The indicator takes into account various factors, including past highs, lows, and closing prices, to pinpoint these significant levels.
Receiving alerts from the Pivot Alert Indicator allows traders to stay abreast of potential market turning points, enabling them to adjust their trading strategies accordingly. This tool is especially advantageous for those who adhere to pivot point strategies, providing timely notifications when specific price levels are attained and facilitating more informed and punctual trading decisions.
Fibonacci Pivots Indicator
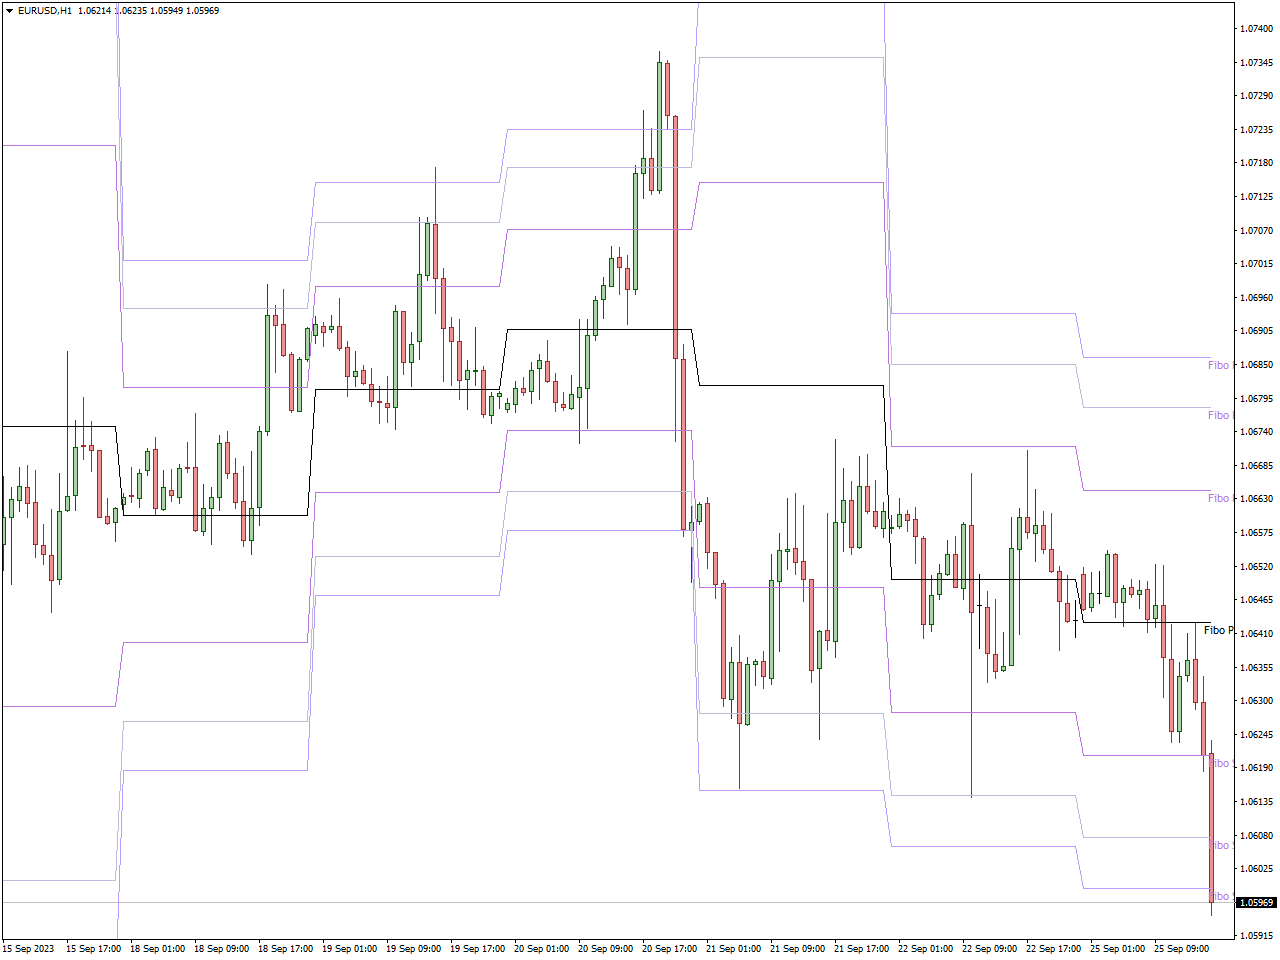
The Fibonacci Pivots Indicator serves as a tool in technical analysis, strategically identifying pivotal points in financial markets through the utilization of Fibonacci retracement levels. These pivotal points are pivotal price levels that traders often scrutinize as potential areas of support or resistance. By integrating Fibonacci retracement values into the analysis, the indicator aims to heighten the precision of identifying significant turning points in price movements.
Traders frequently rely on Fibonacci retracement levels to assess potential price reversals or continuation patterns. The Fibonacci Pivots Indicator merges these levels with the concept of pivot points, providing a more comprehensive analysis of market dynamics. The resulting indicator offers insights into potential areas where the price may undergo shifts in direction, guided by the Fibonacci sequence.
With the incorporation of the Fibonacci Pivots Indicator, traders can seamlessly integrate Fibonacci retracement strategies into their decision-making process, gaining a more profound understanding of possible support or resistance zones. This tool proves instrumental in identifying critical price levels, empowering traders to make well-informed decisions regarding the entry, exit, or adjustment of their positions in the market.
Camarilla Pivots Indicator
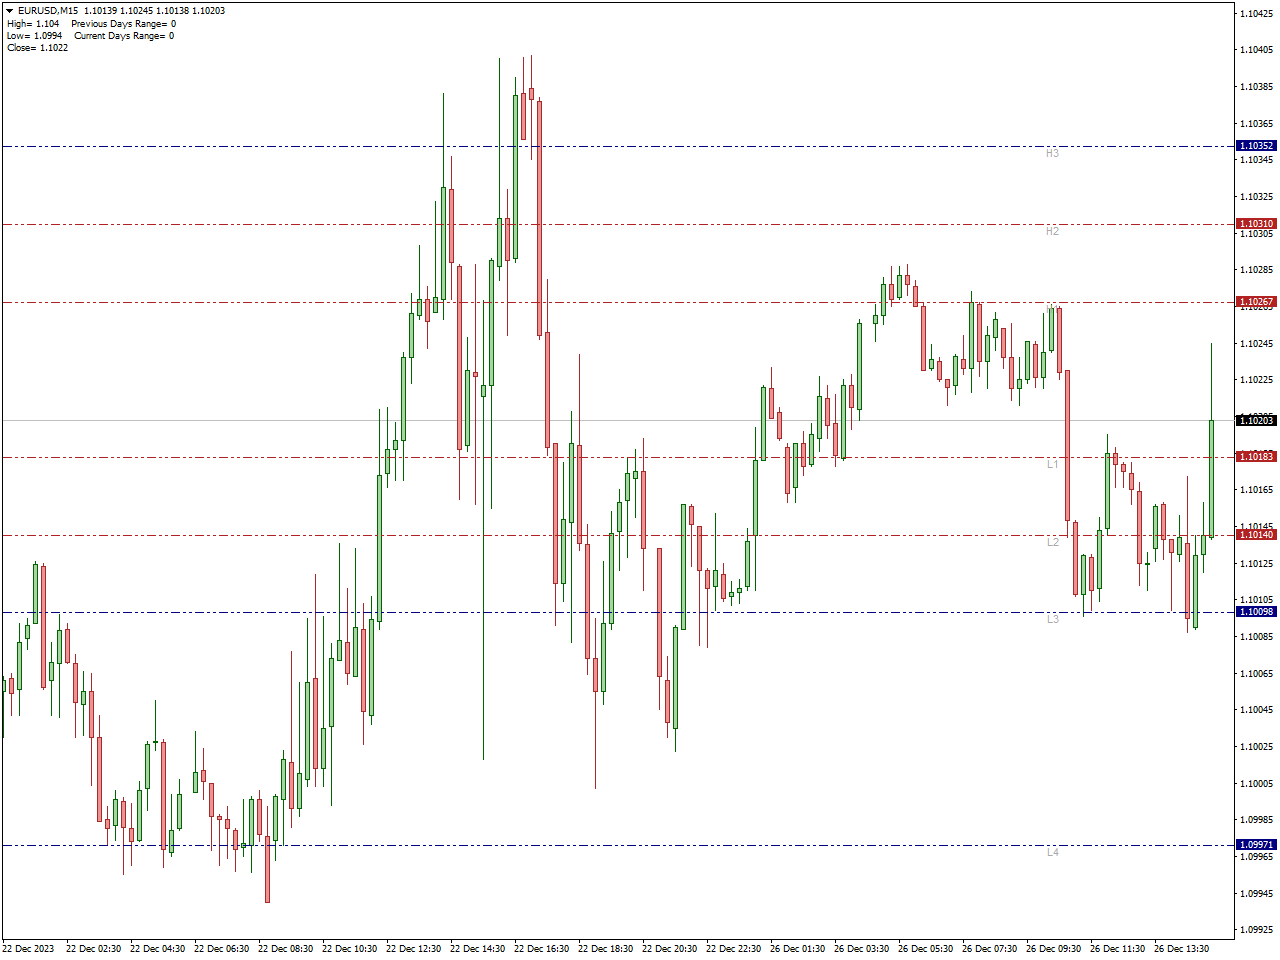
The Camarilla Pivots Indicator serves as a technical analysis tool crafted to pinpoint significant pivot points in financial markets, leveraging the Camarilla equation for this purpose. Pivot points stand out as pivotal price levels, commonly utilized by traders to ascertain potential zones of support or resistance. Through the application of the Camarilla formula, this indicator strives to offer a distinct perspective on these critical points, heightening precision in the identification of substantial turning points within price movements.
Traders frequently employ pivot points to assess potential reversals or continuity patterns in prices. The Camarilla Pivots Indicator seamlessly integrates the Camarilla equation into this analytical framework, presenting an alternative method for discerning vital price levels. The resulting indicator furnishes insights into areas where price shifts may occur, guided by the Camarilla formula.
Through the utilization of the Camarilla Pivots Indicator, traders can seamlessly incorporate Camarilla pivot strategies into their decision-making process, acquiring a more profound comprehension of potential support or resistance zones. This tool proves invaluable in honing in on critical price levels, empowering traders to make judicious decisions regarding their market entries, exits, or position adjustments.
Dark Point Indicator
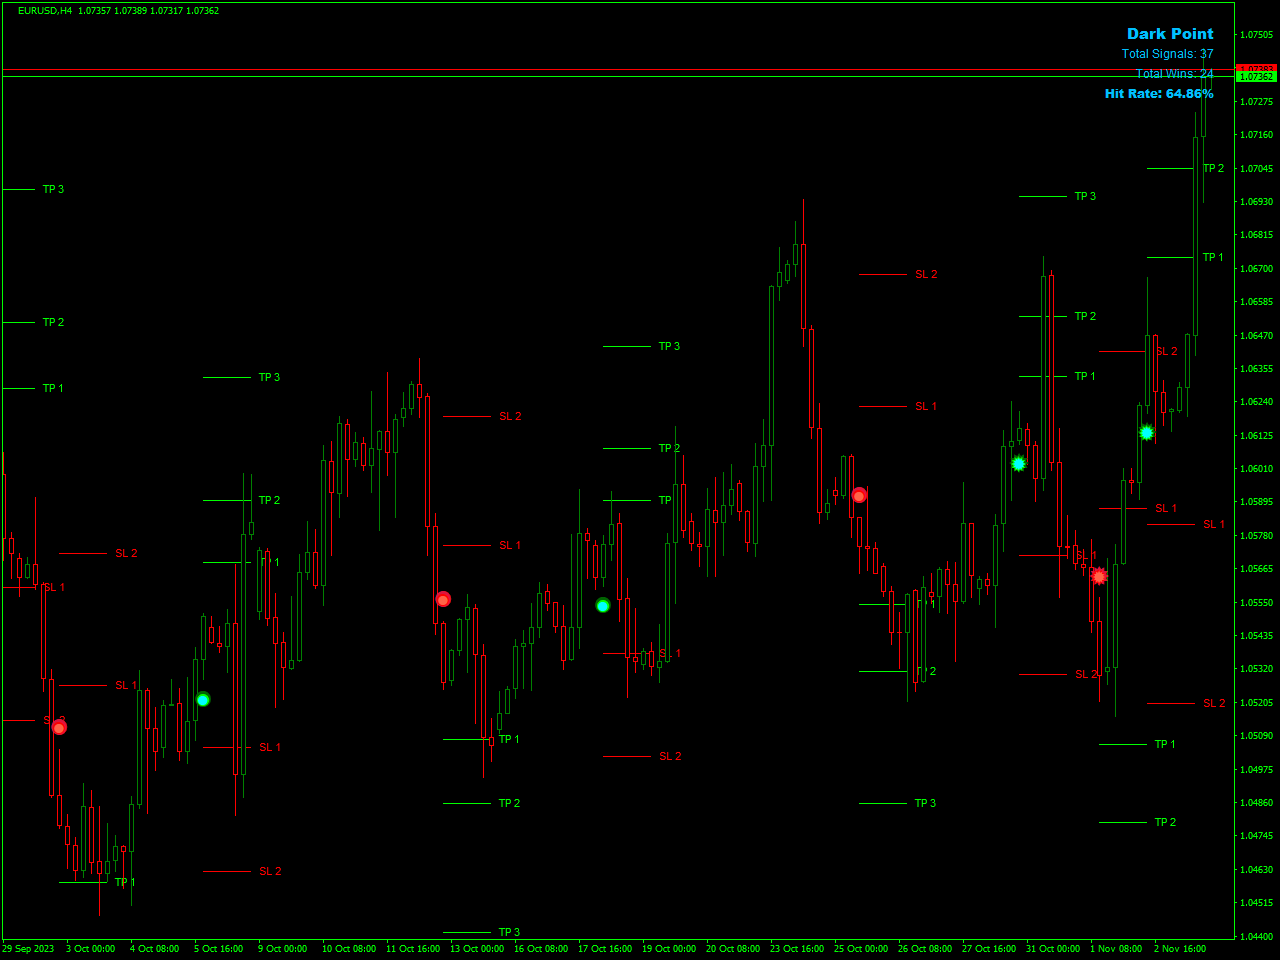
The Dark Point indicator is specifically crafted for intraday trading in the forex and stock markets, providing trend-following signals for day traders. This MT4 indicator is designed to offer alerts for bullish and bearish trends, along with suggested stop-loss and take-profit levels. By combining a dark point moving average with the ATR indicator, it aims to enhance precision in identifying favorable trading opportunities.
Displayed on the price chart as green and red dots, the indicator signals bullish and bearish trends. Once the indicator confirms the trend direction, it automatically calculates potential take-profit zones and sets stop-loss limits. The green horizontal levels represent projected targets for potential trade setups, while the red horizontal levels indicate recommended stop-loss areas. For scalping, SL1 is suggested, and for intraday trading, SL2 is recommended.
Additionally, the indicator provides a “Hit Rate” at the top-left of the chart, allowing traders to monitor its trading accuracy. This feature adds transparency and helps traders assess the indicator’s performance during their intraday trading activities.
PivotPoints.All-In-One
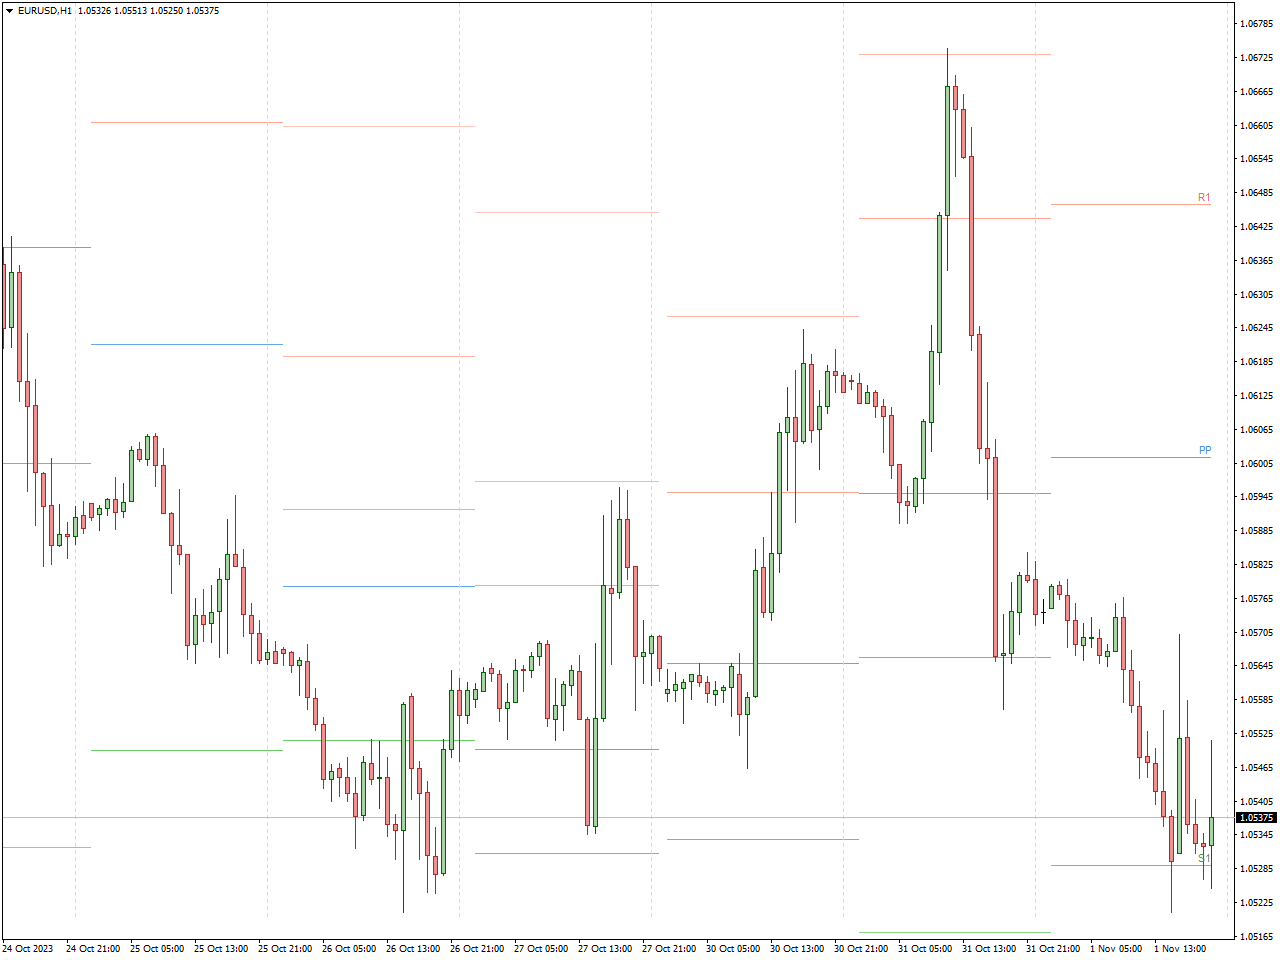
The PivotPoints.All-In-One indicator serves as an inclusive tool crafted for technical analysis, consolidating various pivot point calculations into a singular indicator. Pivot points stand as crucial levels utilized by traders to pinpoint potential areas of support and resistance. This all-encompassing indicator integrates diverse pivot point formulas, offering traders a versatile approach applicable in various market conditions.
By combining multiple pivot point calculations, including Classic, Camarilla, Woodie, and Fibonacci methods, the indicator presents a comprehensive perspective on potential pivot levels. Each pivot point calculation method carries its distinct characteristics, enabling traders to select the approach that aligns with their strategy or preferences.
The PivotPoints.All-In-One indicator typically showcases these pivot points directly on the price chart, facilitating the identification of pivotal price levels crucial for decision-making. Whether traders adhere to traditional pivot points or favor the nuances of Camarilla or Fibonacci pivots, this indicator acts as a consolidated tool, simplifying the process of analyzing and incorporating pivot points into their trading strategies.
All Pivot Points Indicator
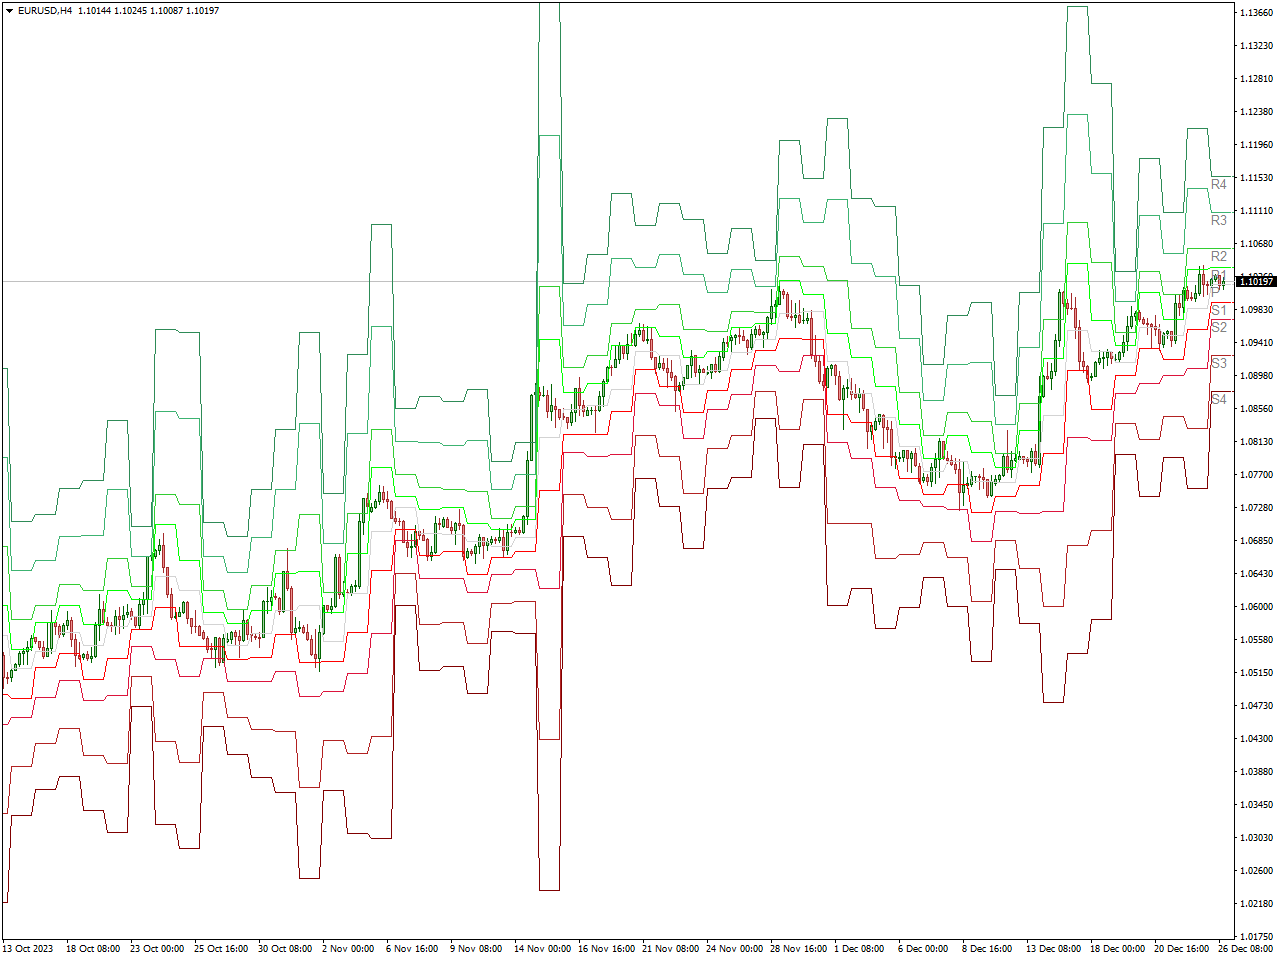
The All Pivot Points Indicator serves as a versatile tool in technical analysis by consolidating various pivot point calculations into a single, comprehensive indicator. Pivot points play a crucial role for traders in identifying potential areas of support and resistance in the market. This indicator integrates different pivot point formulas, providing traders with a flexible and holistic approach to navigating various market conditions.
Through the integration of multiple pivot point calculations, including Classic, Camarilla, Woodie, and Fibonacci methods, this indicator delivers a comprehensive overview of potential pivot levels. Each pivot point calculation method carries its unique characteristics, enabling traders to choose the approach that aligns with their specific strategy or preferences.
Typically, the All Pivot Points Indicator displays these pivot points directly on the price chart, simplifying the process of identifying critical price levels for informed decision-making. Whether traders adhere to traditional pivot points or prefer the nuances of Camarilla or Fibonacci pivots, this indicator acts as a consolidated tool, streamlining the analysis and incorporation of pivot points into their trading strategies.
Volatility Pivot Indicator
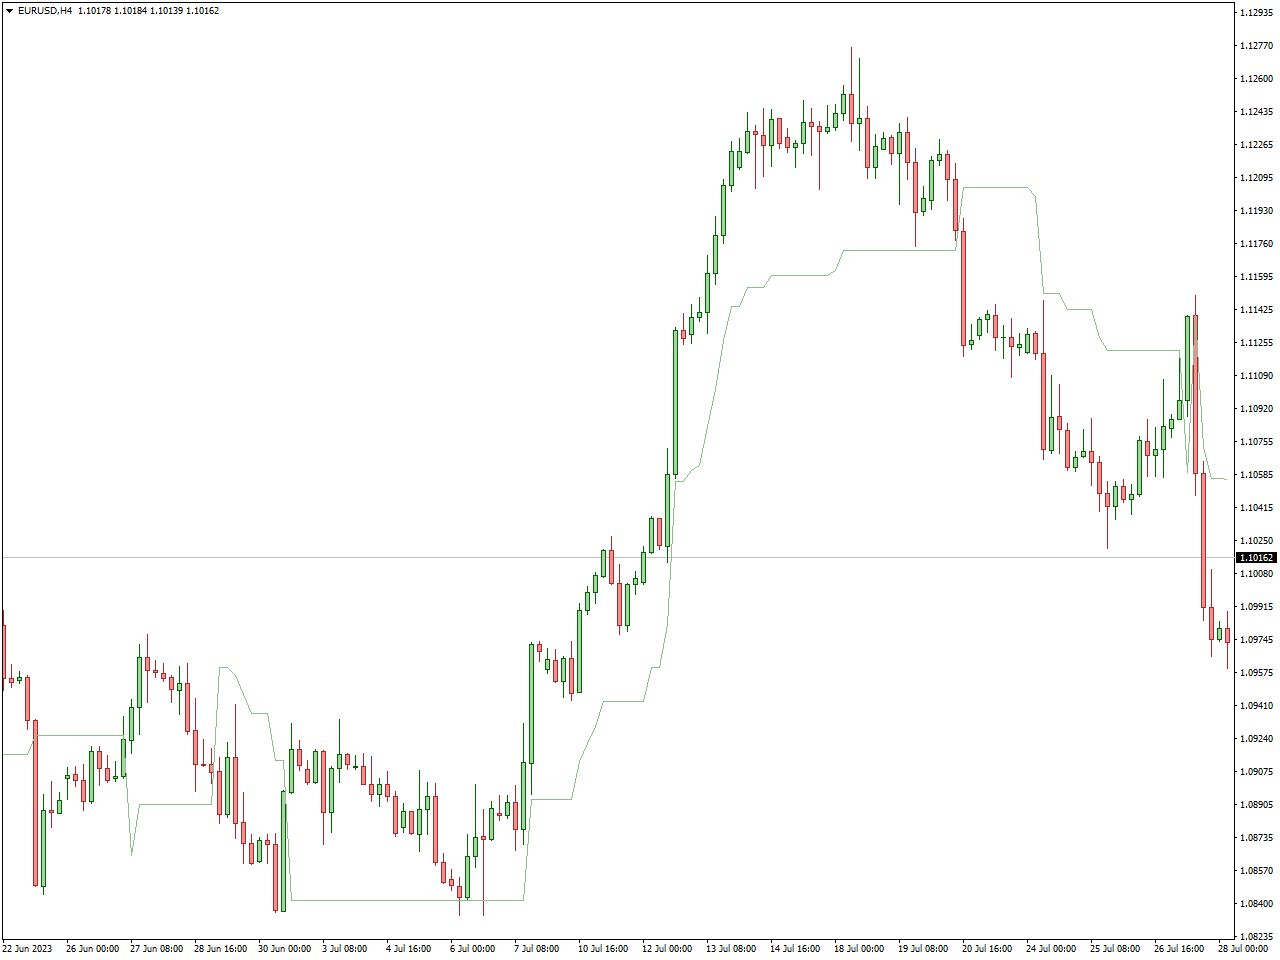
The Volatility Pivot Indicator serves as a technical analysis tool crafted to measure market volatility and pinpoint potential pivot points within financial markets. It seamlessly integrates aspects of volatility analysis with the calculation of pivot points, delivering valuable insights for traders seeking to identify possible zones of support and resistance.
This indicator takes into account the measurement of market volatility, assisting traders in evaluating the likelihood of price fluctuations. By melding volatility analysis with pivot point calculations, the indicator strives to furnish a more nuanced comprehension of pivotal price levels.
Traders can effectively employ the Volatility Pivot Indicator to recognize potential turning points in the market and fine-tune their strategies accordingly. The incorporation of volatility analysis enriches the indicator’s capability to spotlight areas where significant shifts in price movements may occur.
Conclusion
In conclusion, mastering the art of trading requires arming yourself with the right tools, and the Top 10 Pivot Point Indicators offer a compelling arsenal. By incorporating these indicators into your trading strategy, you gain insights into potential price movements, support and resistance levels, and trend reversals. Empower your decision-making, mitigate risks, and seize opportunities with confidence. Elevate your trading experience and explore the world of possibilities that the Top 10 Pivot Point Indicators can unlock for you.

