Features of the 100 Pips Indicator
Designed for the MT4 platform, the 100 Pips Indicator is a trend-following indicator for stock and FX trading. The indicator applies two moving averages to plot crossovers, and after that, it turns them into profitable buy/sell signals. It indicates exact market entry areas and possible trade exit areas.
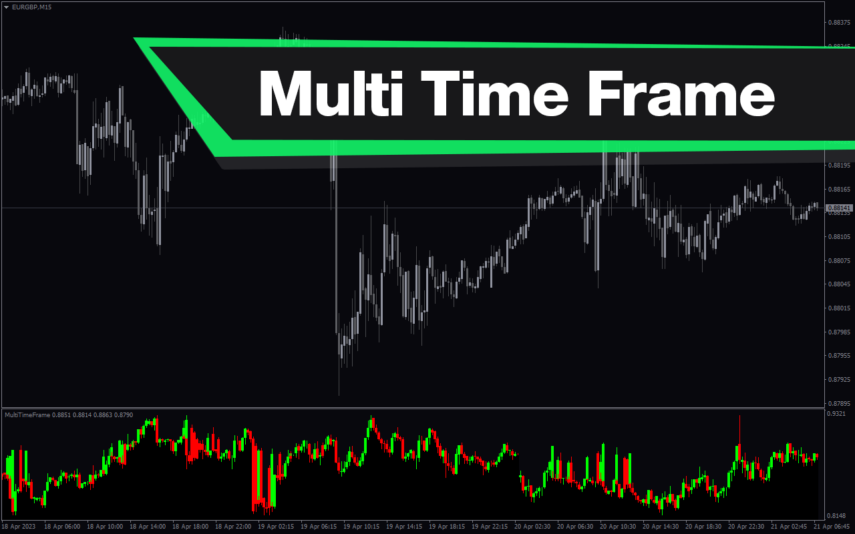
Moreover, the indicator works well with multiple timeframes (MTF) chart analysis, enabling you to trade intraday and scalp simultaneously. Use it on higher timeframes, such as H4 and daily charts, for better performance.
How the Indicator Can Benefit You
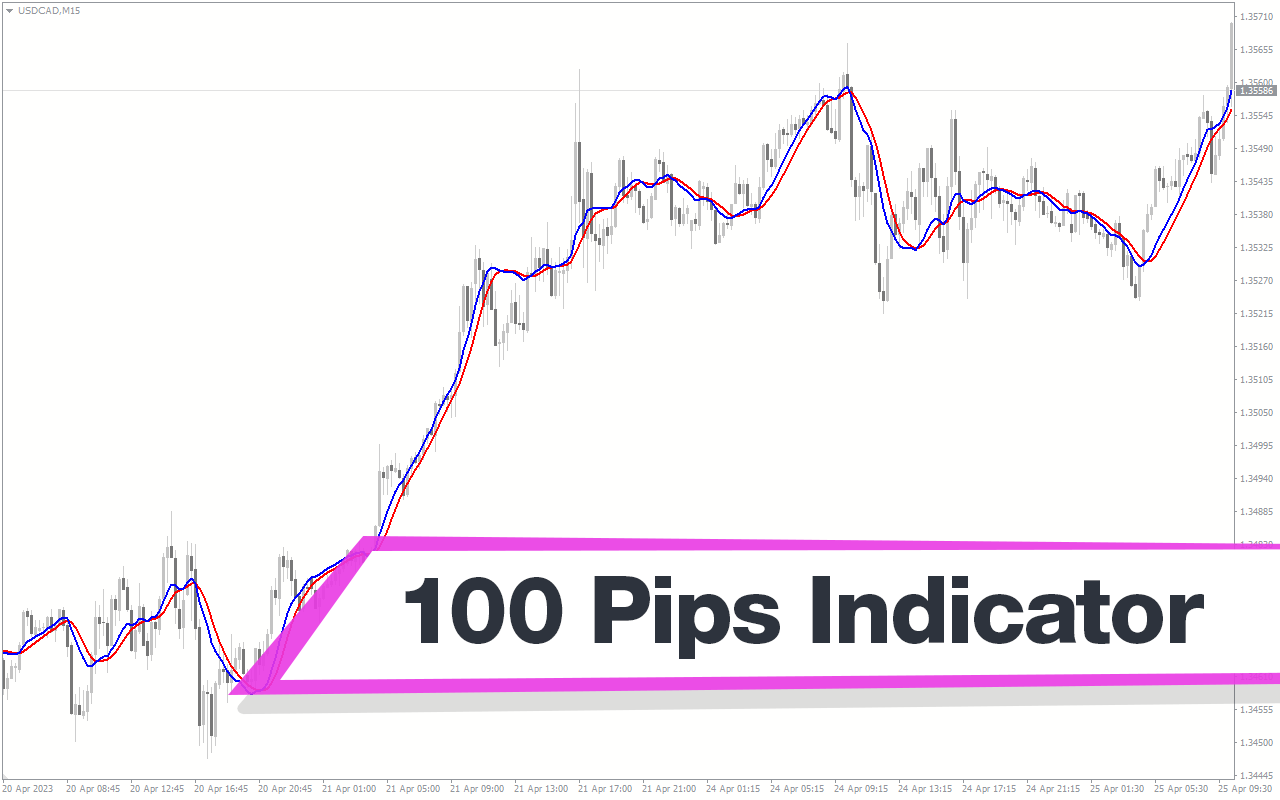
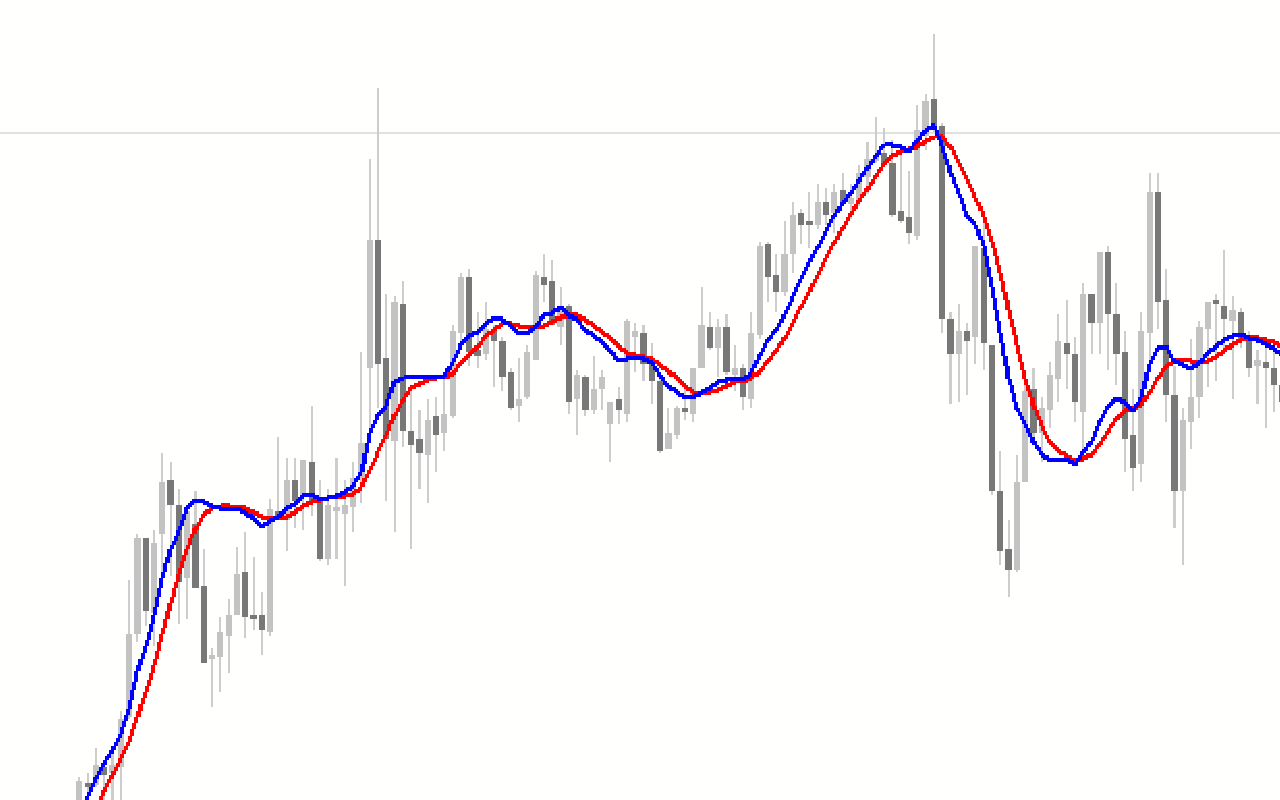
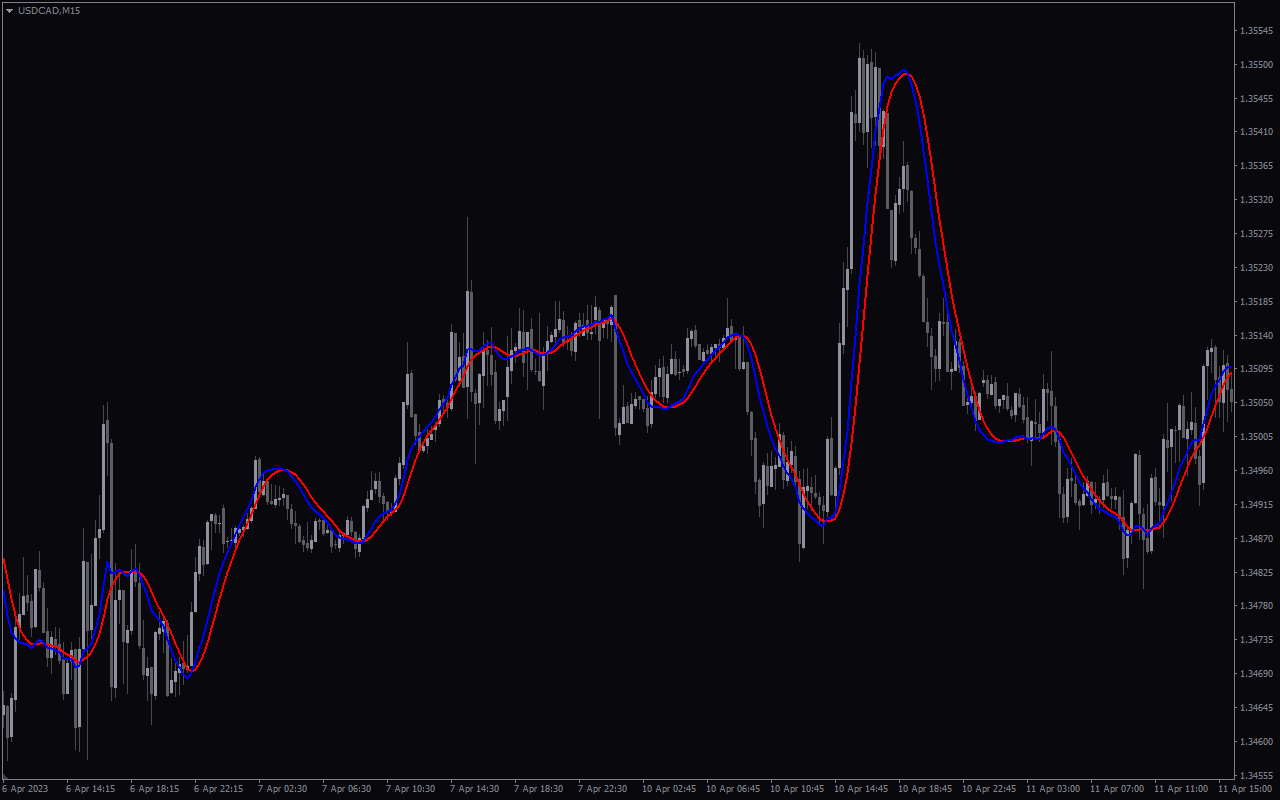
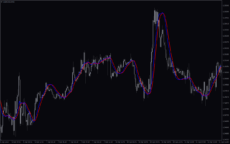
The indicator can give off profitable trade entry signals. Here is how you can use these signals. The 100-pip indicator plots the crossover signals using a fast and slow-moving average. To make the crossover patterns easy to spot, the slow MA is red, and the fast MA is blue.
The indicator shows a bullish crossover when the blue MA crosses over the red MA. In contrast, a bearish crossing occurs when the blue MA crosses below the red MA.
You should take a long position when the 100 Pips Indicator plots a bullish crossover at the lower end of the market range. Additionally, you can place a buy order when the fast MA exceeds the slow MA in a bullish breakout. Conversely, place sell orders when the fast MA dips below the slow MA and the price simultaneously draws a bearish breakout or reversal pattern.
When the indicator shows a trend signal in the opposite direction of your entry, you should consider closing any open position.
Indicator Setting Description
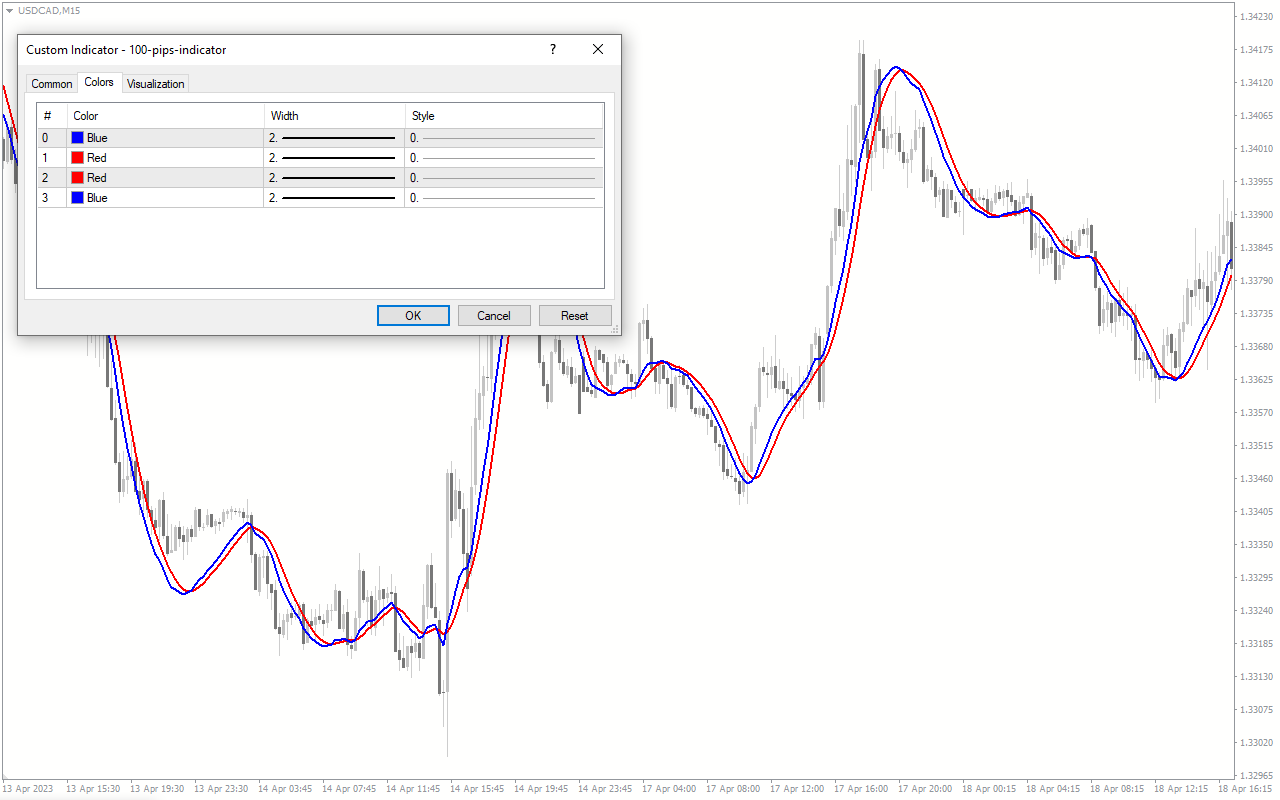
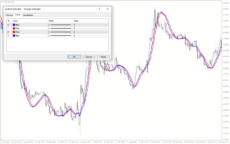
The 100-pip indicator allows you to change the colors, line widths, and styles.


Reviews
There are no reviews yet.