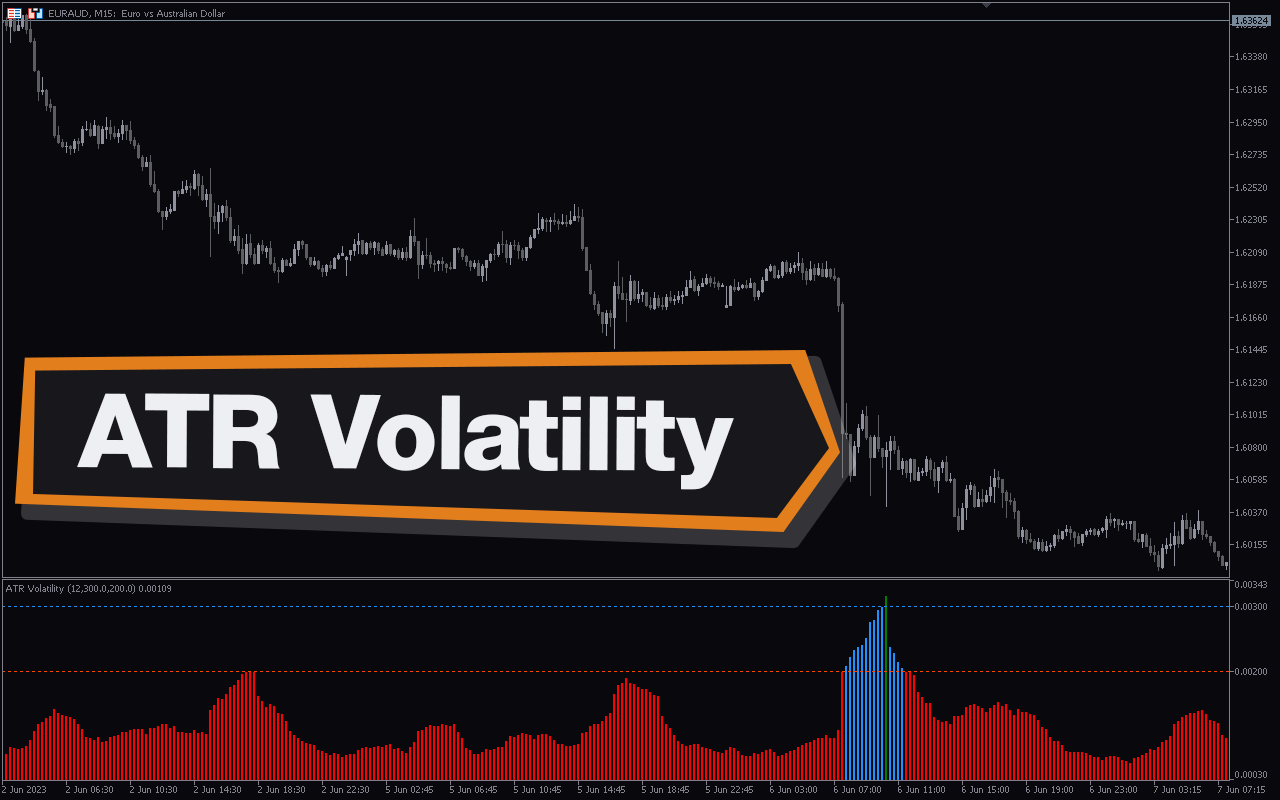
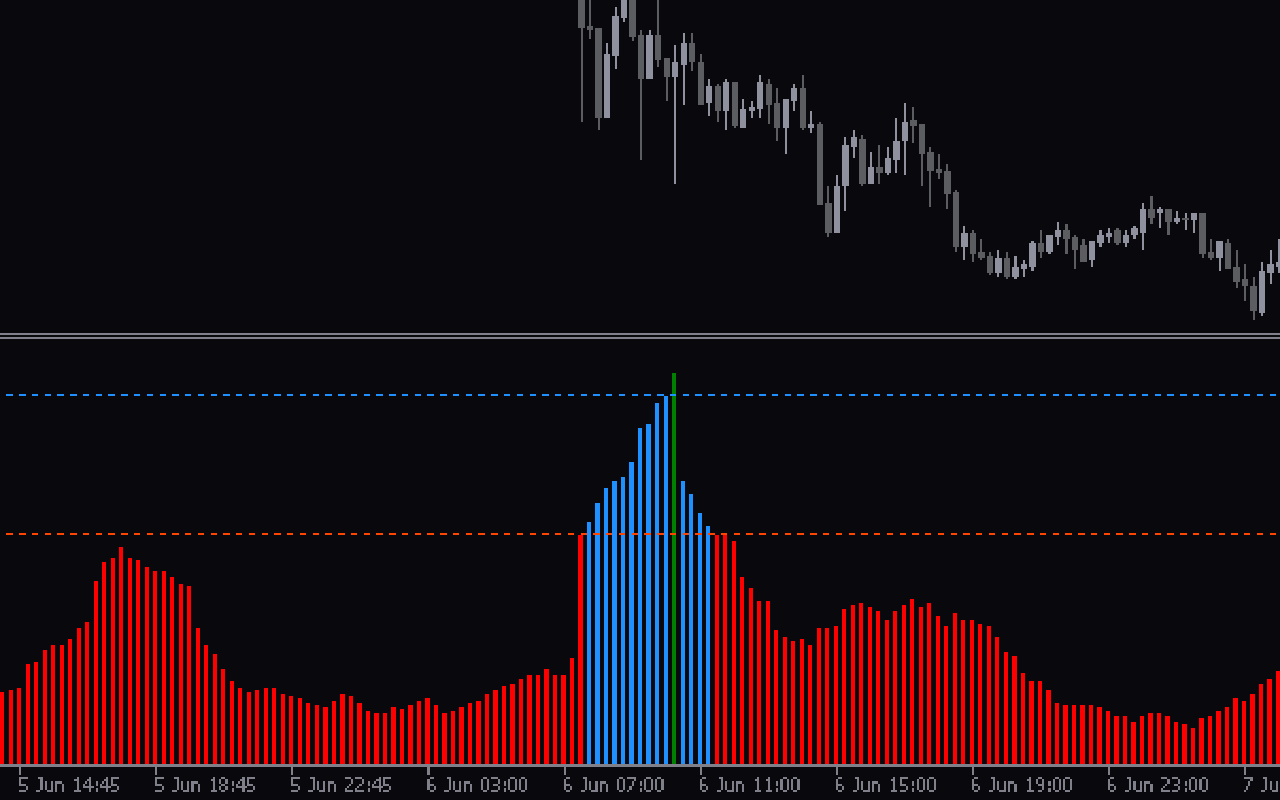
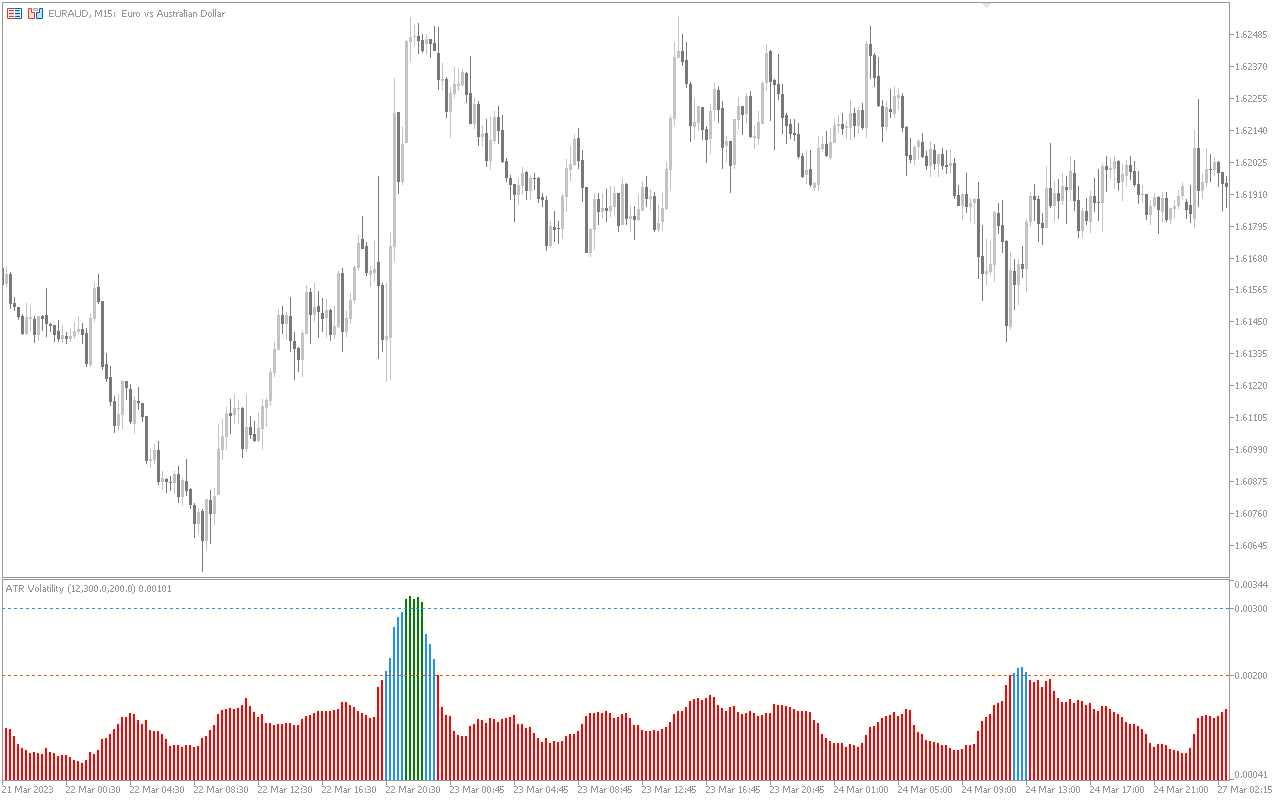
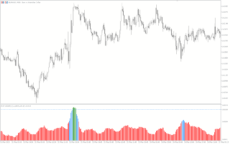
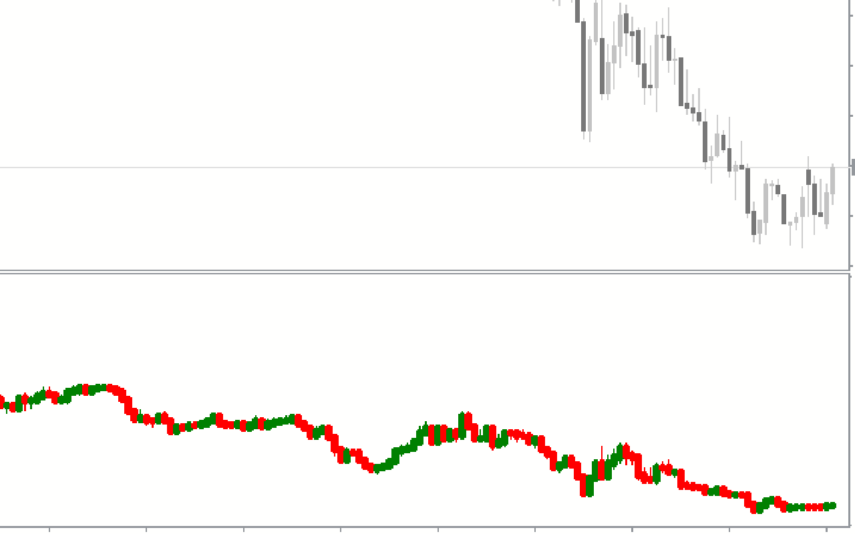
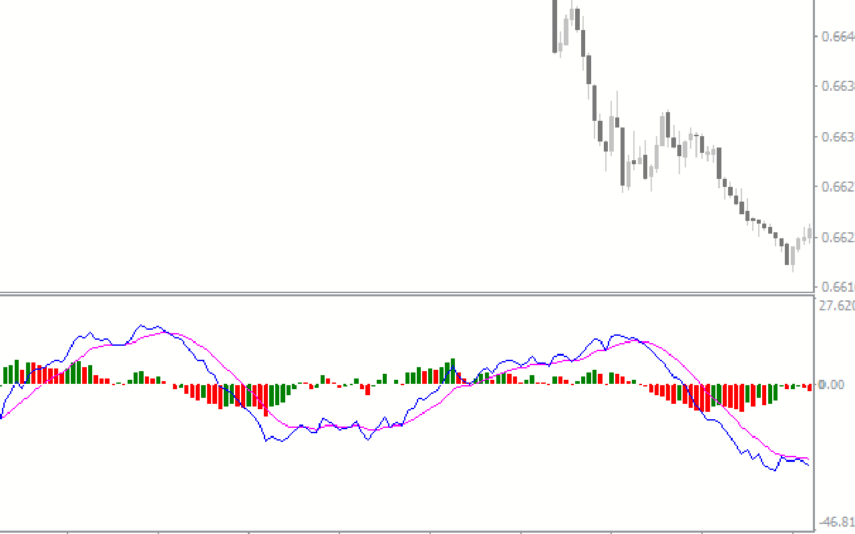
The ATR (Average True Range) Volatility indicator is a technical trading tool designed to measure the market volatility on the MetaTrader 5 platform. It paints histogram bars of different colors to depict the volatility conditions in the market. The green histogram depicts bullish momentum, the red bar indicates low market momentum, while the dodger blue bar indicates bearish momentum.
The histogram bars assist Forex traders in making informed trading decisions on when to buy/sell and exit a trade position. For instance, a trader might consider selling an instrument if price action suggests a trend reversal, and the indicator also prints dodger blue (bearish momentum) histogram bars. Conversely, a Forex trader may consider exiting a position if the prints the red bars when the price is at a support or resistance zone.
Features of the ATR Volatility Indicator for MT5
The indicator displays the market volatility with histogram bars of different colors, making it easy for even a novice trader to decipher the market volatility. Besides, it has customizable Parameters, which allows users to adjust the parameters to suit their trading styles and preferences. Finally, the indicator works flawlessly on multiple time frames.
Benefits of Using the Indicator
- Trend Assessment: The ATR Volatility indicator for MT5 provides traders with a clear assessment of market volatility. It assists traders in identifying periods of increased and decreased market volatility.
- Trend Identification: The histogram bars of the indicator provide information on the strength of the market trend. For instance, the green bars in an uptrend are a confluence that suggests a sustainable trend, aiding traders to make informed trading decisions.
- Confluence for Entry and Exit: The indicator can be used as a confluence to find optimal trade entry or exit zones in the market
Indicator Settings Description
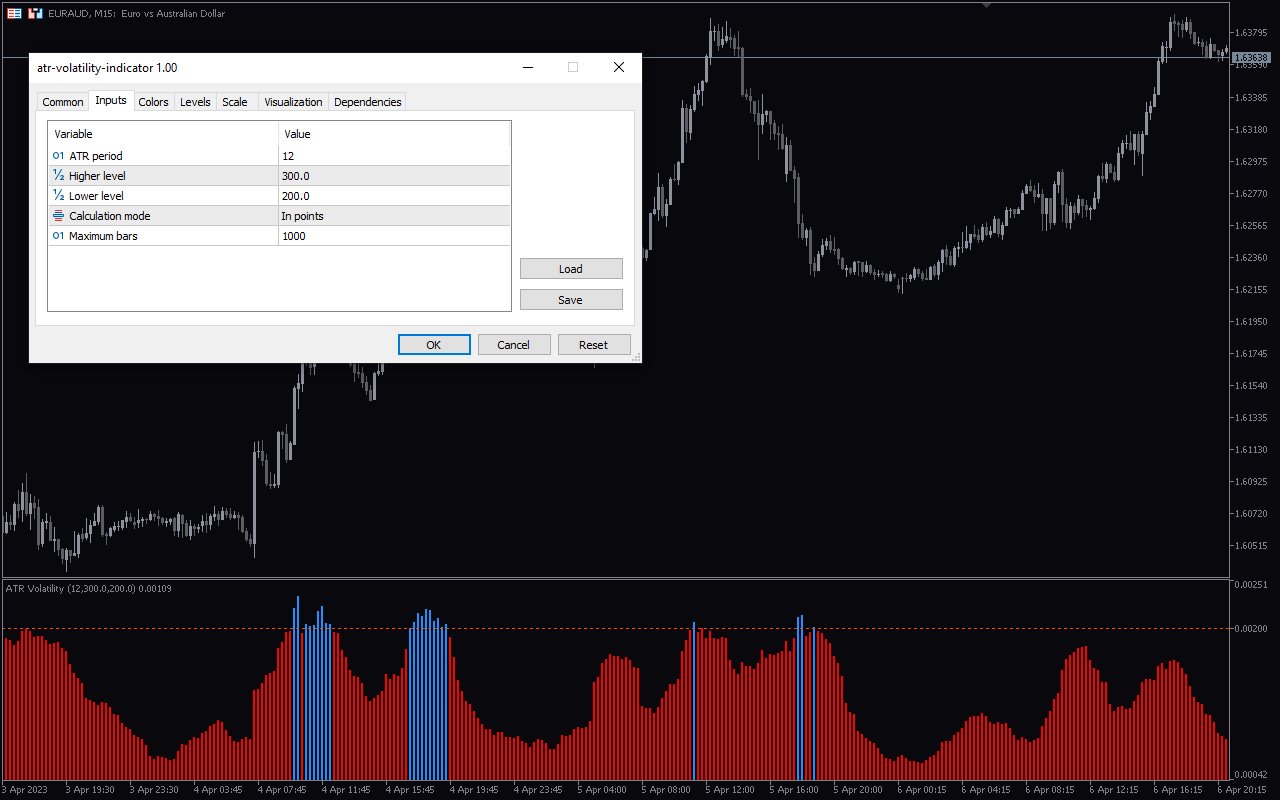
The indicator comes with the following customizable settings:
ATR period: Determines the period of the ATR.
Higher level: Determines the value for the upper extreme level.
Lower level: Determines the value for the lower extreme level.
Calculation mode: Determines the method used for calculation.
Maximum bars: Determines the maximum candlesticks for trend analysis.


Reviews
There are no reviews yet.