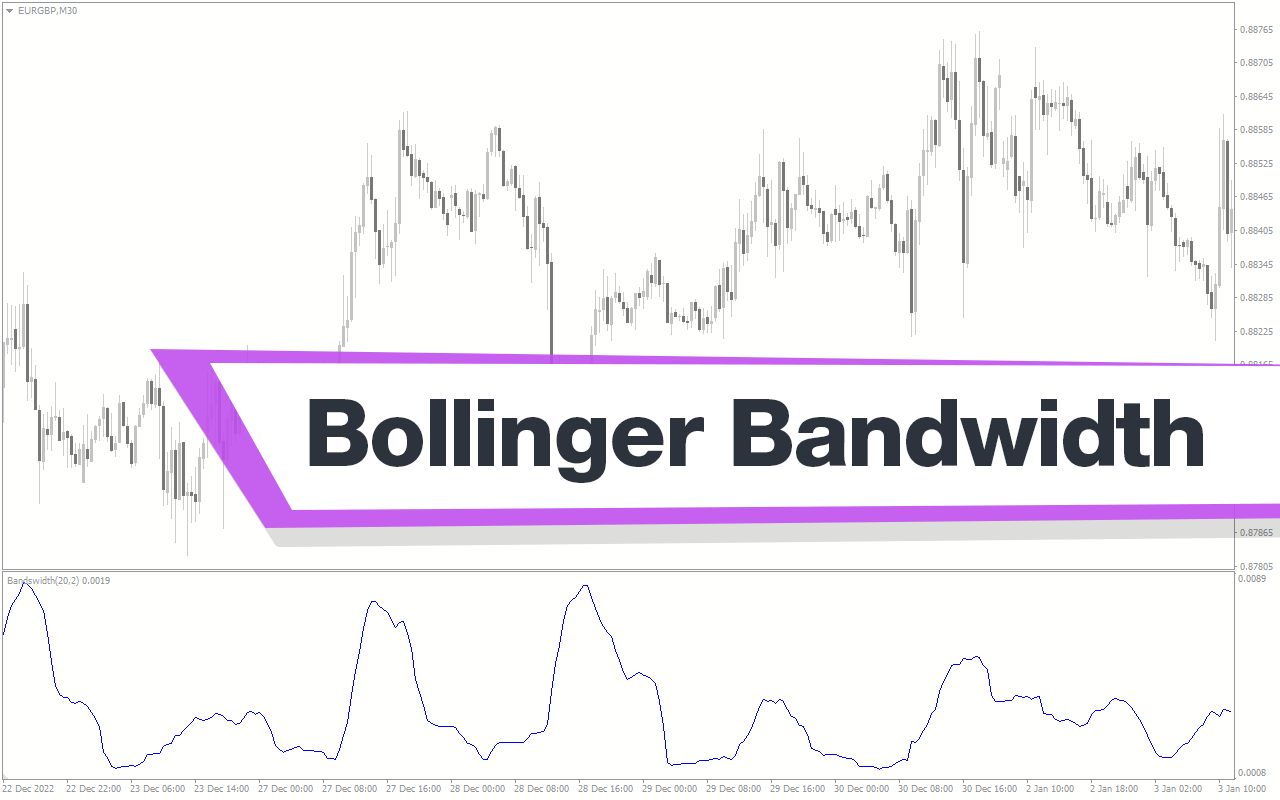
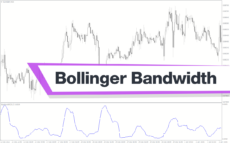
The Bollinger bandwidth MT4 indicator provides a good measure of forex market volatility. Ideally, this indicator derives the data from the classic Bollinger bands indicator. According to John Bollinger the low volatility periods or a squeeze is often followed by high volatility. So, using the indicator forex traders can identify the current market volatility and anticipate huge price fluctuations after the squeeze.
Features of Bollinger Bandwidth MT4 Indicator
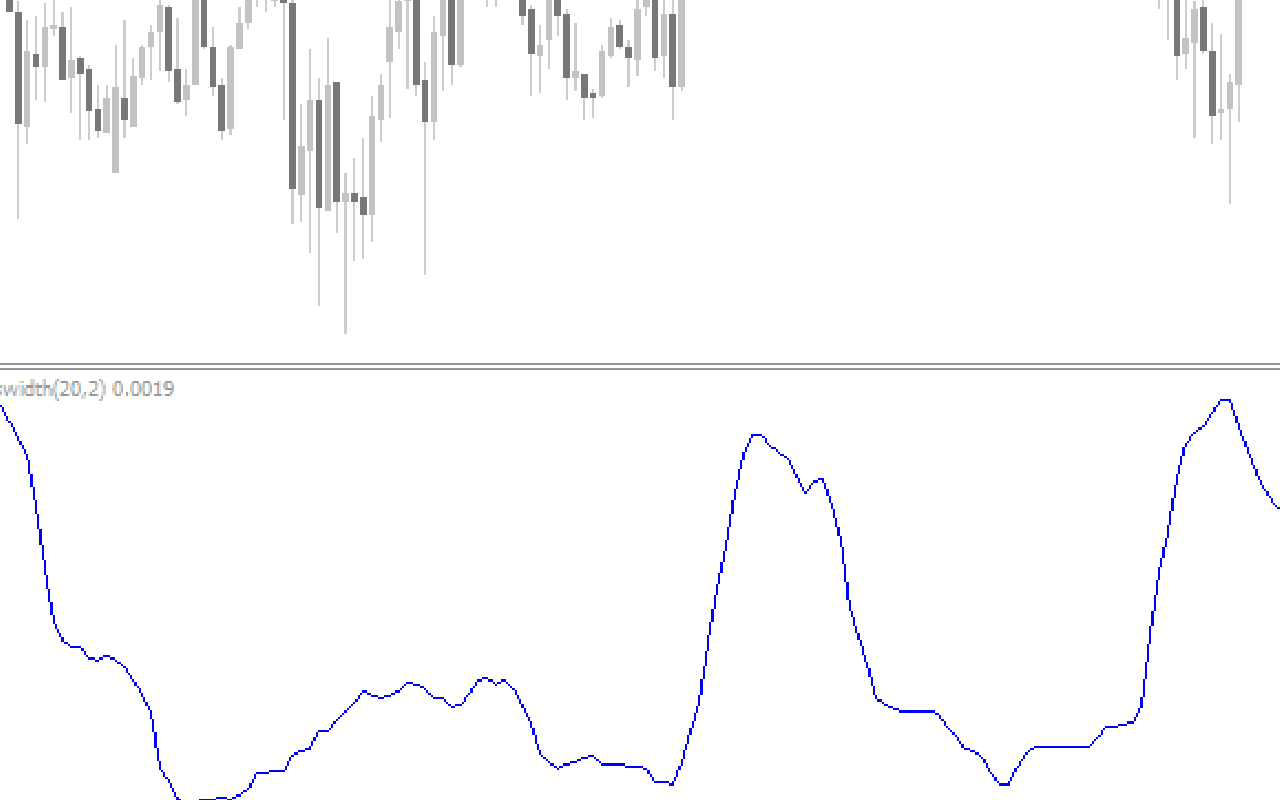
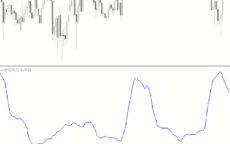
The indicator plots the changes in bandwidth as a line chart in a separate indicator window. By default, Bollinger bands indicator has an upper band, lower band and mid band. The mid band is a 20 period moving average and the upper and lower bands are a standard deviation value of + and -2 of the mid band. The distance between the upper and lower bands is the bandwidth of the Bollinger Band.
It does not provide buy or sell forex trading signals. Though this indicator is non-directional it helps traders to anticipate price movements. So, traders should use other technical indicators to identify the potential direction of price movement.
Generally, low volatility occurs due to lack of trading interest before a high impact economic news release. However, if the squeeze happens during market holidays then traders should ignore the squeeze.
Benefits of Bollinger Bandwidth MT4 Indicator
The Bollinger bands contract during times of low volatility and expand during high volatile market conditions. There are many trading strategies using the Bollinger bands; however this indicator helps forex traders to take advantage of the Bollinger band squeeze trading strategy.
Knowing that the price is expected to make a huge move, traders can prepare a trade plan to accommodate the risk and reward associated with it. This includes adjusting the lot sizes to include a wider stop loss.
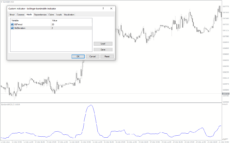
Indicator Settings Description
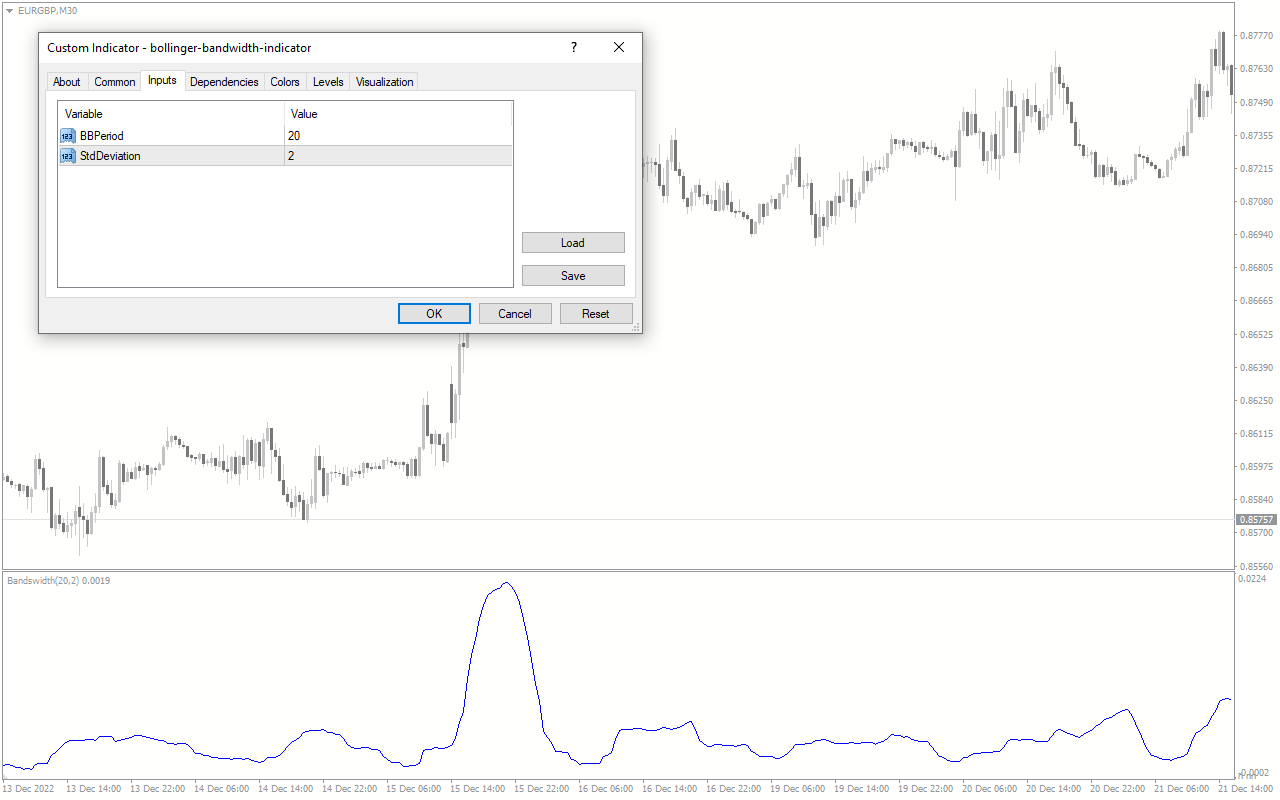
BBPeriod:, StdDeviation: Input for Bollinger bands calculation.



Reviews
There are no reviews yet.