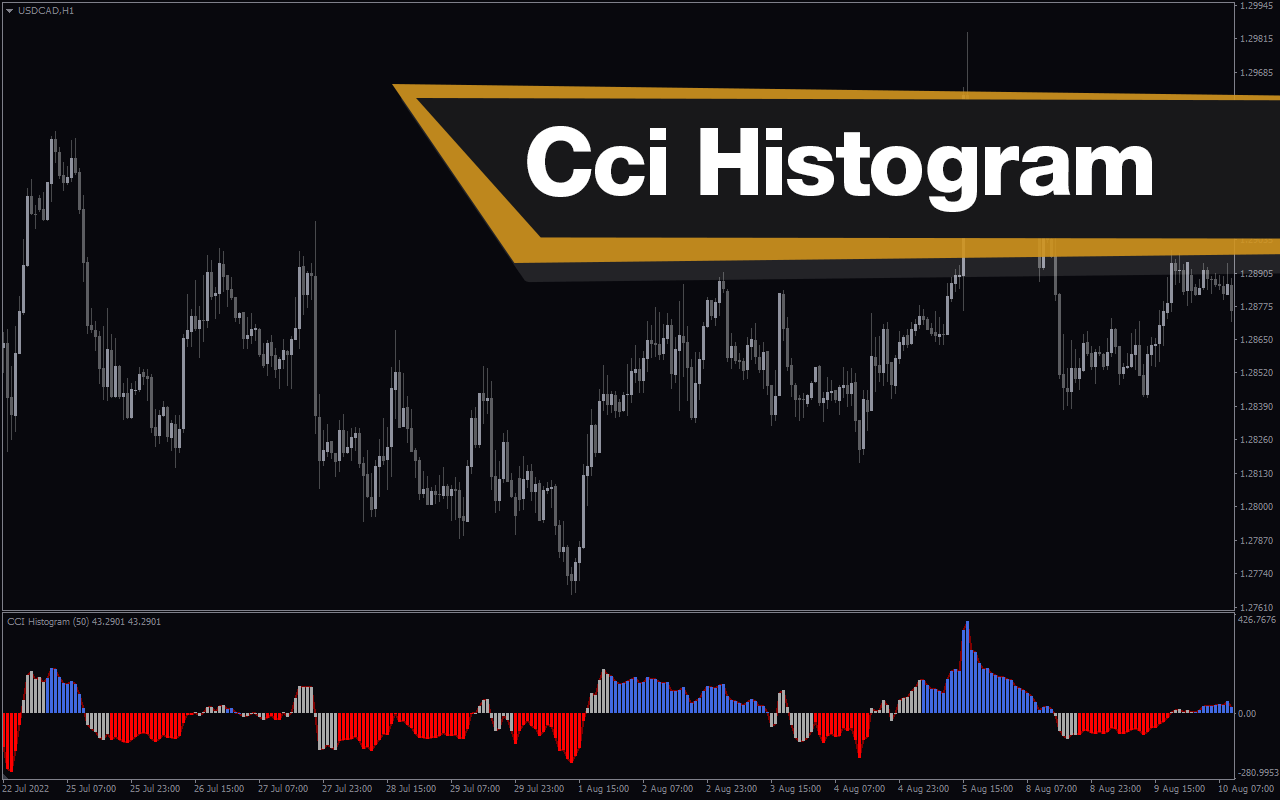
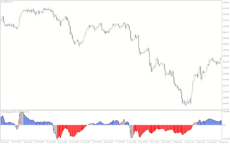
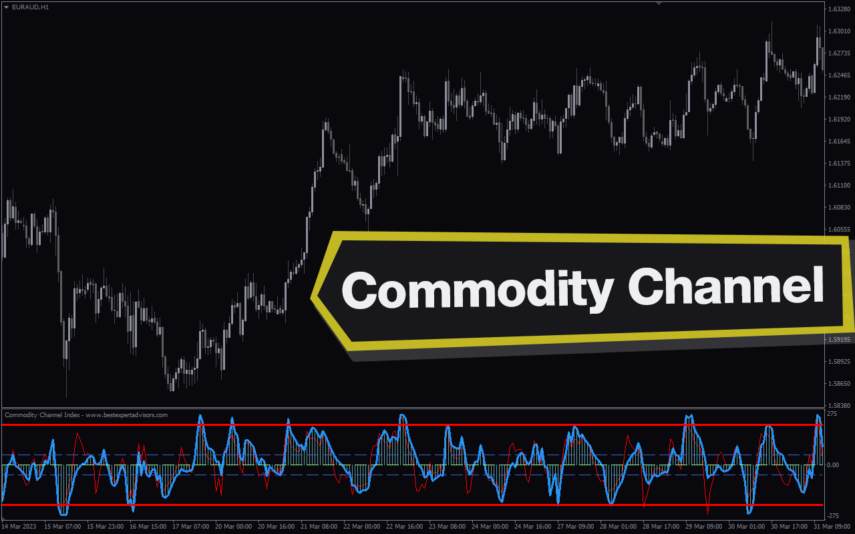
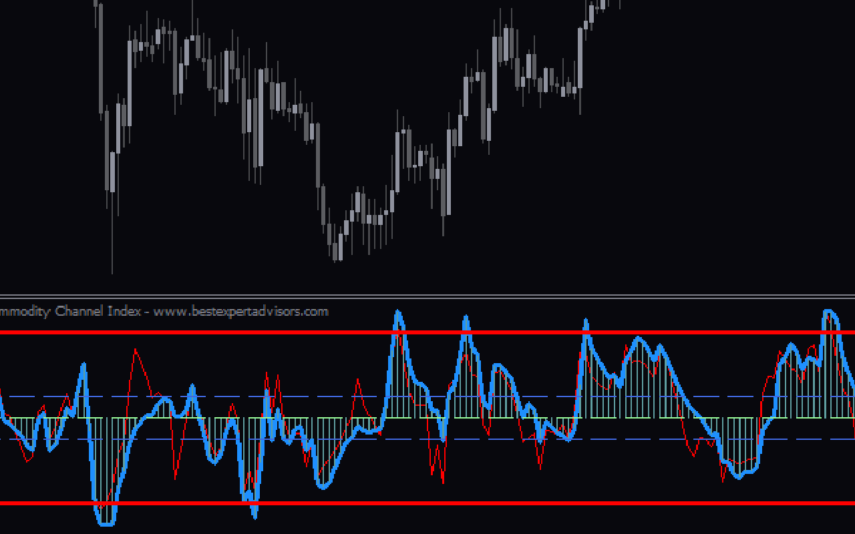
The CCI Histogram MT4 indicator is a modified version of the classic CCI – Commodity channel index. It reflects three different market conditions in different histogram color. Since the indicator shows bearish, neutral and bullish market trends it provides a clear indication of the current price trend. Additionally, traders can get early reversal forex trading signals using the divergence.
Features of CCI Histogram MT4 Indicator
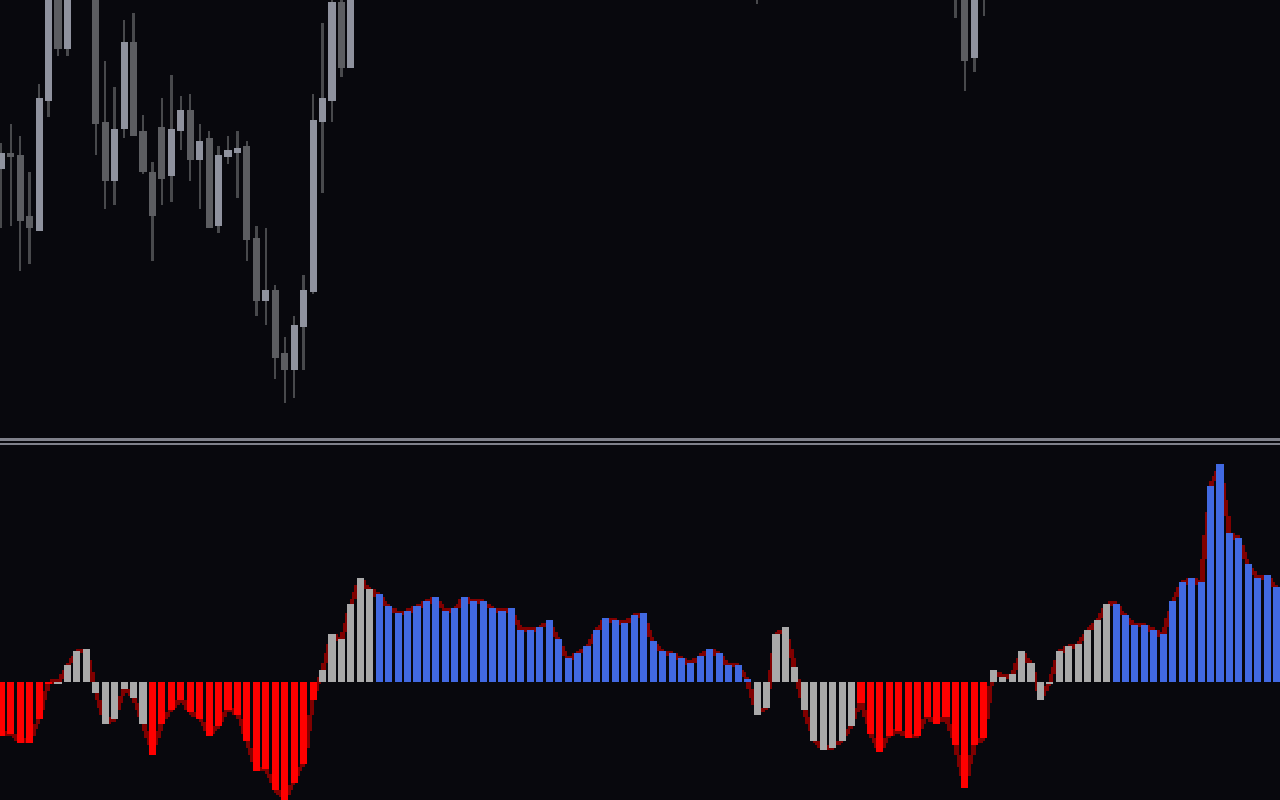
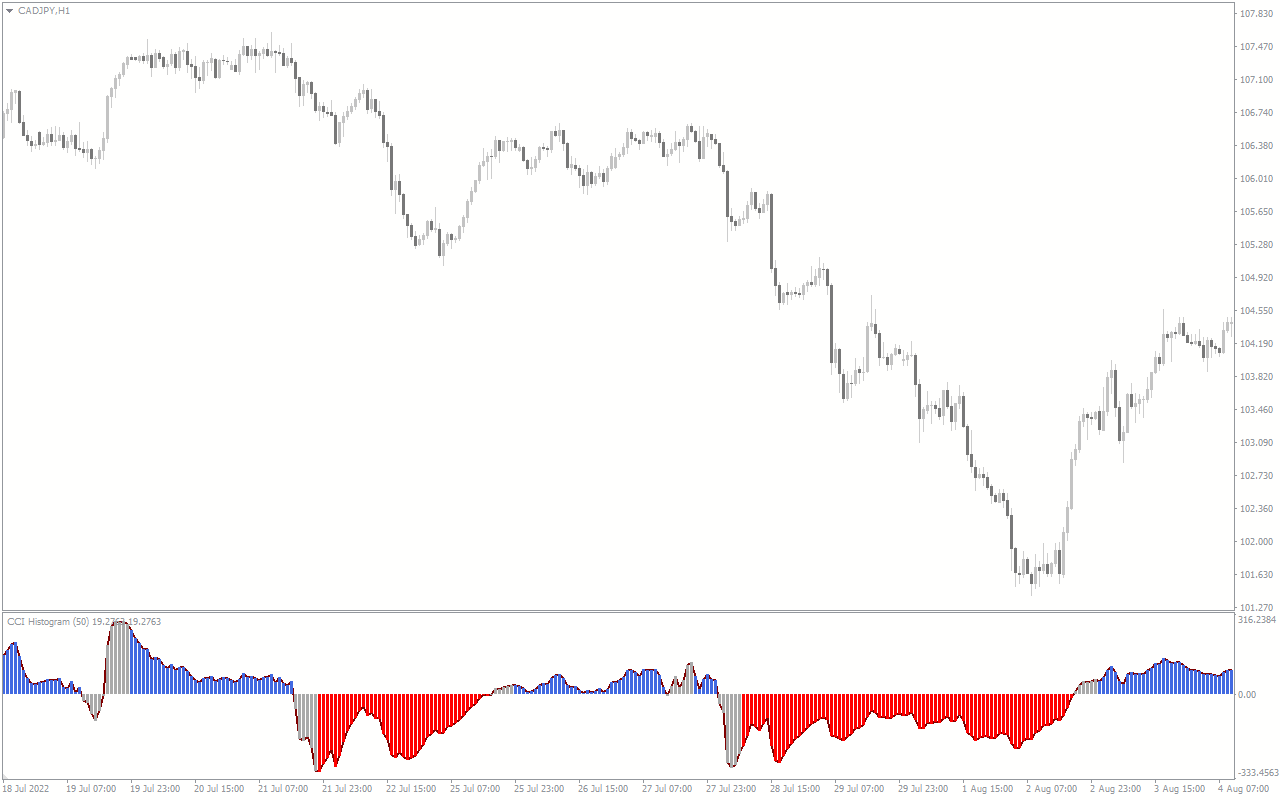
The indicator plots blue histogram bars in a bullish market condition. While the neutral trend is gray and bearish market trend is in red bars. The best trading strategy is to enter at the beginning of a trend and exit at an opposite trend or a neutral trend. However, traders should note that CCI – values above +100 indicate a bullish market and below -100 show a bearish market condition. So it is prudent to ignore trading signals within these indicator levels.
Another important feature of this indicator is the appearance of divergence between the indicator and price. So, traders can anticipate price reversals using the bullish and bearish divergence.
In fact the combination of a bullish signal above +100 levels with the appearance of the bullish divergence strengthens the case for a buy trade.
Benefits of CCI Histogram MT4 Indicator
The main benefit of this indicator is the ability to distinguish three market conditions that helps new and advanced forex traders. It eliminates the necessity for traders to apply technical analysis to understand the trend direction. In fact, traders can use this indicator to identify entry and exit points.
The indicator is a simple histogram and suits new forex traders. As traders can apply this indicator on all chart time frames, it works for short and long-term trading.
Indicator Settings Description
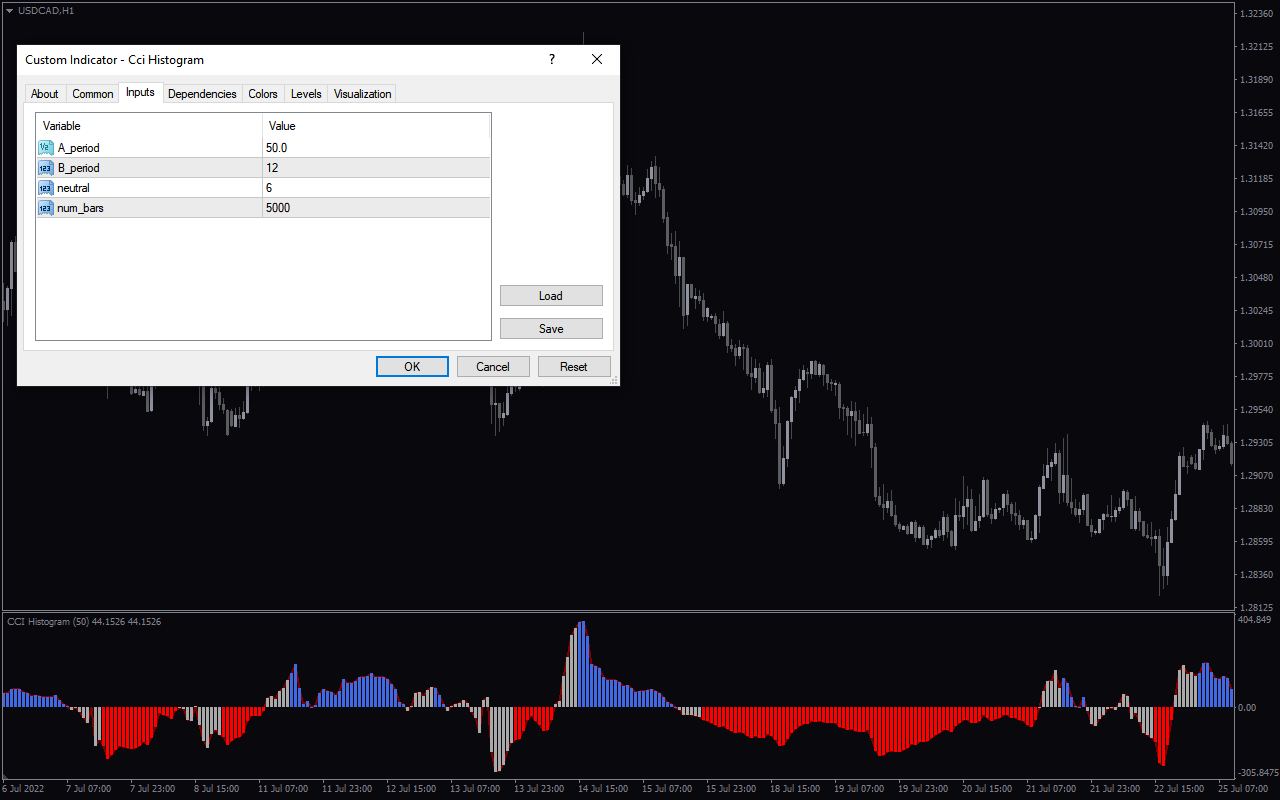
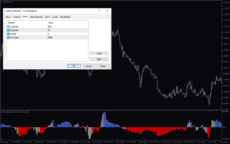
A_period:, B_period:, neutral: Period for indicator calculation.
num_bars: Maximum number of history bars to display the indicator.

Reviews
There are no reviews yet.