Features of the Connors RSI Indicator
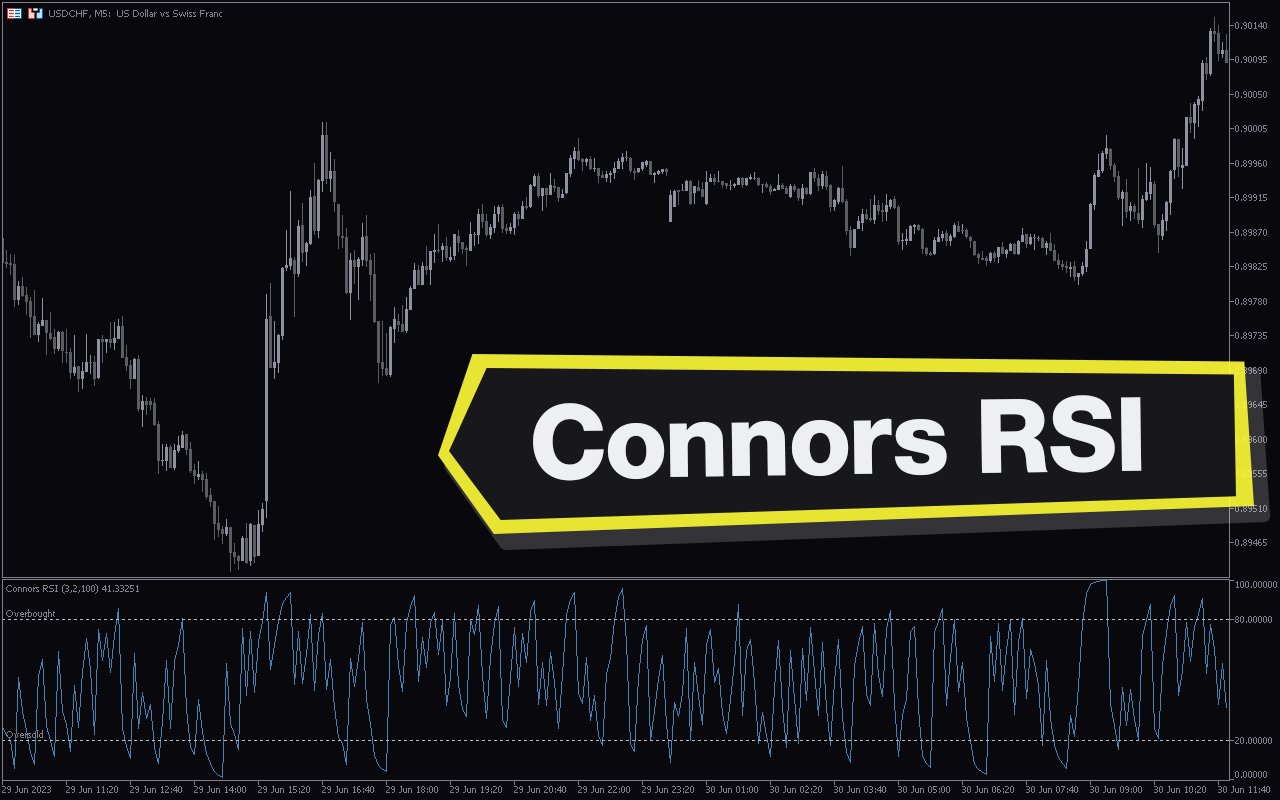
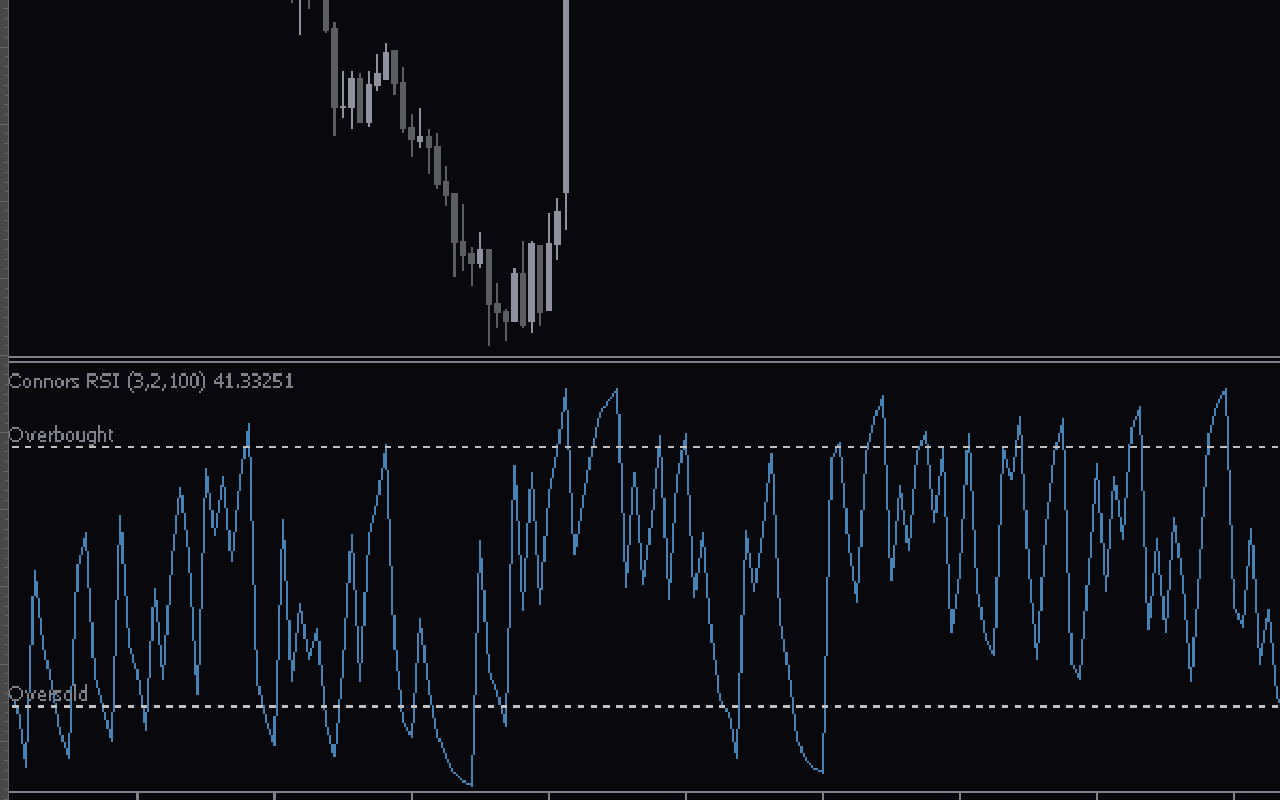
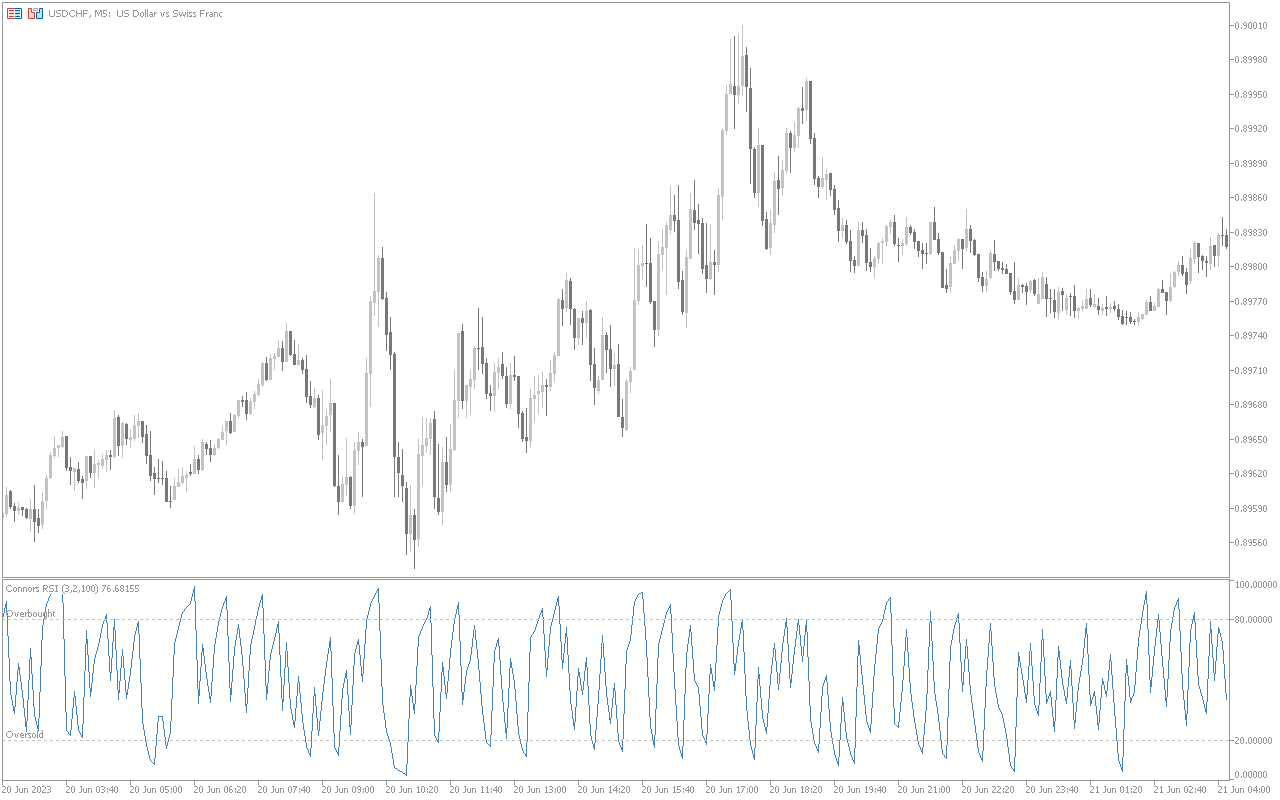
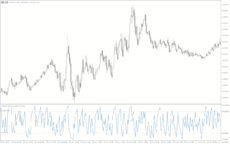
The Connors RSI is an improved version of the traditional RSI developed by Larry Connors. Because it uses period 2, it responds to price fluctuations more quickly. If the price drops below 20, it moves into an oversold area. Meanwhile, the overbought area is at 80. This differs from the traditional RSI, which uses period 14 and places the oversold area above 70 and the oversold area below 30.
You can trade any currency pair in any time frame using the indicator. You can create and modify overbought and oversold zones using the setting parameter.
How the Indicator Can Benefit You
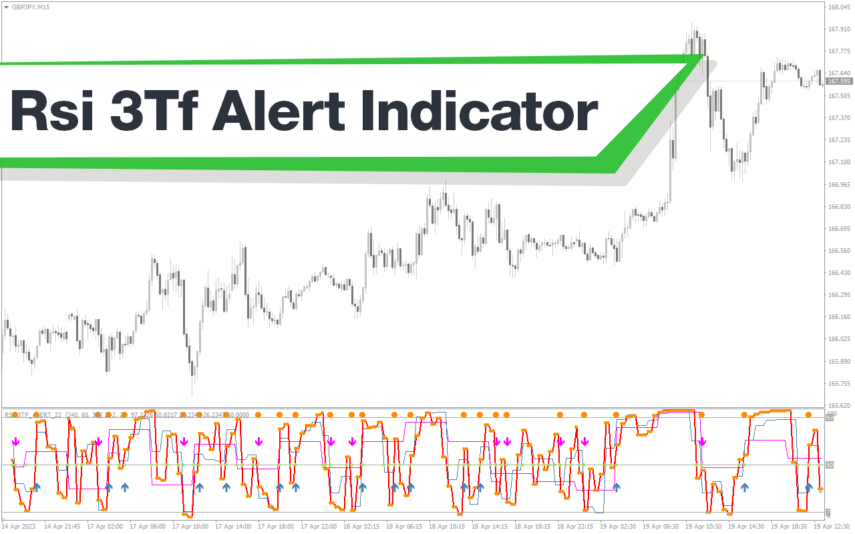
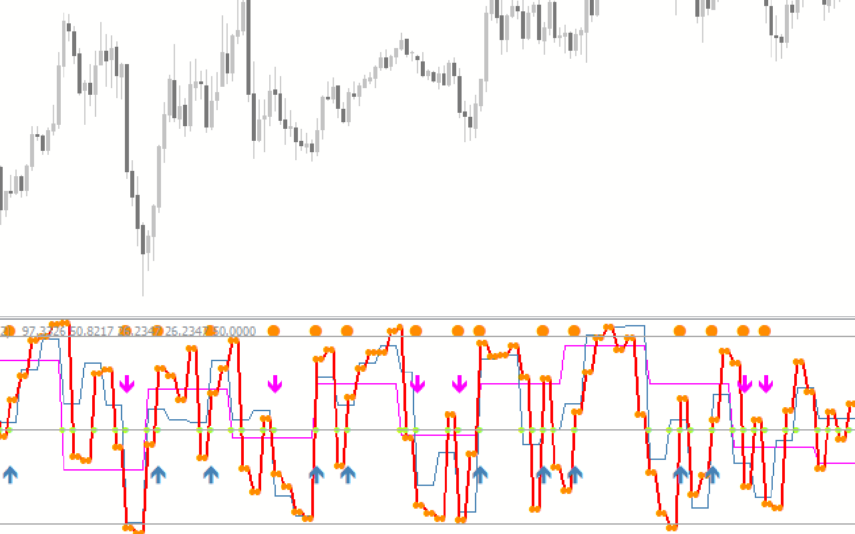
You can use the indicator to make better trading decisions. The indicator works like the average RSI. Wait for the indicator to fall below level 20 for the buy signal. This level signals an oversold market, likely to rally in the opposite direction. You should, therefore, take a long position.
Wait for the indicator to move above level 80 for the sell signal. This level signals an overbought market, likely to rally in the opposite direction. You should, therefore, take a short position.
Indicator Setting Description
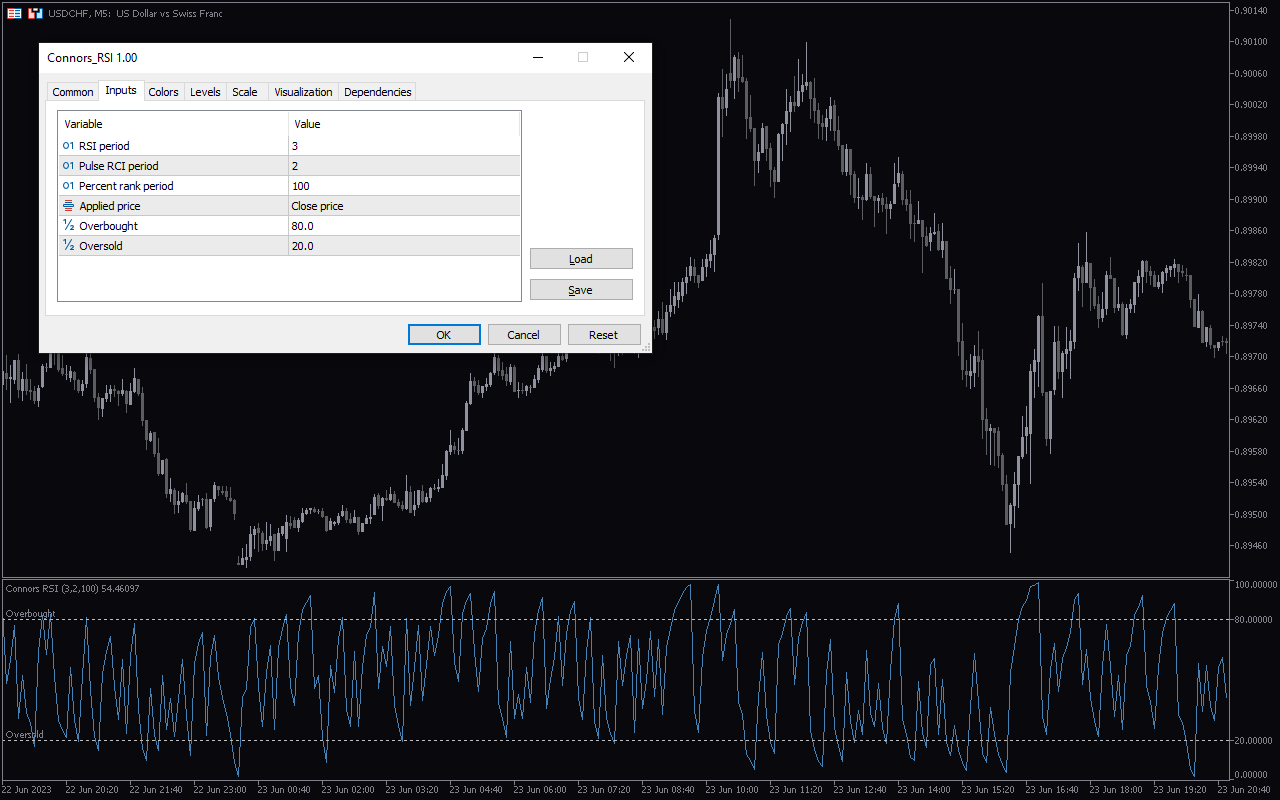
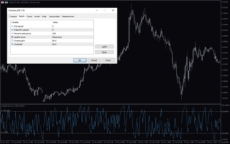
RSI Period: This input allows you to edit the RSI Period.
Pulse RSI Period: This input will enable you to edit the pulse RSI period
Percent rank period: This input allows you to change the percent rank period.
Applied price: Select the price the indicator will use in its calculations.
½ Overbought: You can set the overbought level.
½ Oversold: You can set the oversold level.

Reviews
There are no reviews yet.