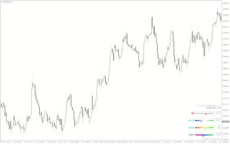
The Corona Dashboard V1 indicator for MT4 is an informational indicator that displays different market metrics in a dashboard to provide traders with an overview of the market conditions. It is an incredible trading asset for novice and experienced traders, designed to enhance objective technical analysis and decision-making.
Features of the Corona Dashboard V1 Indicator for MT4
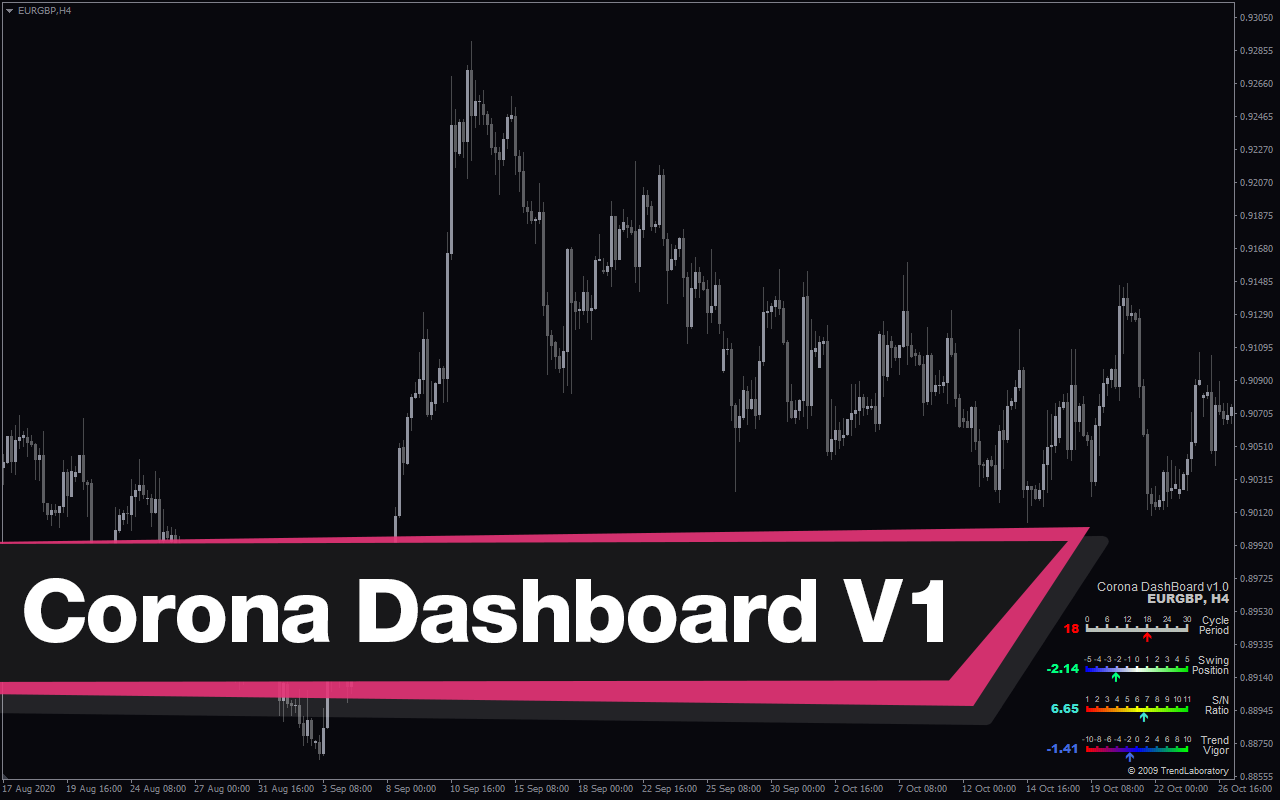
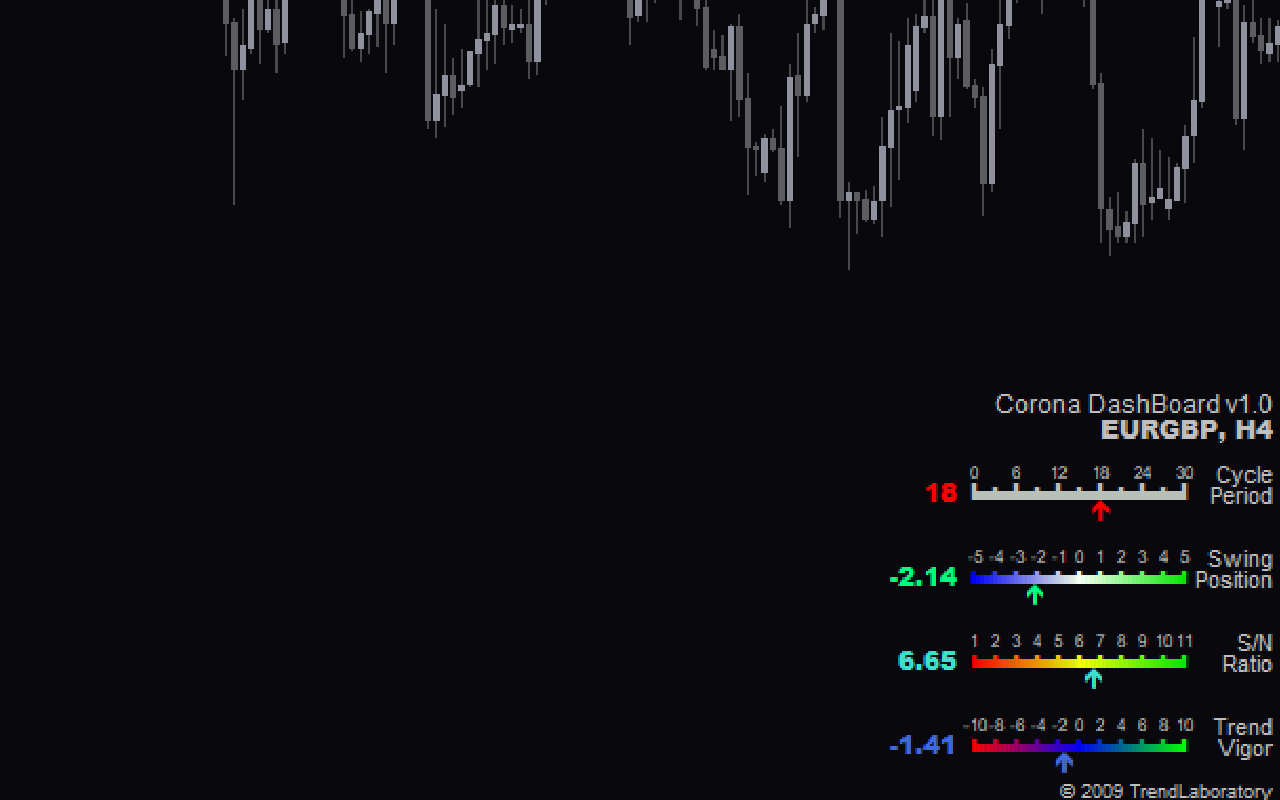
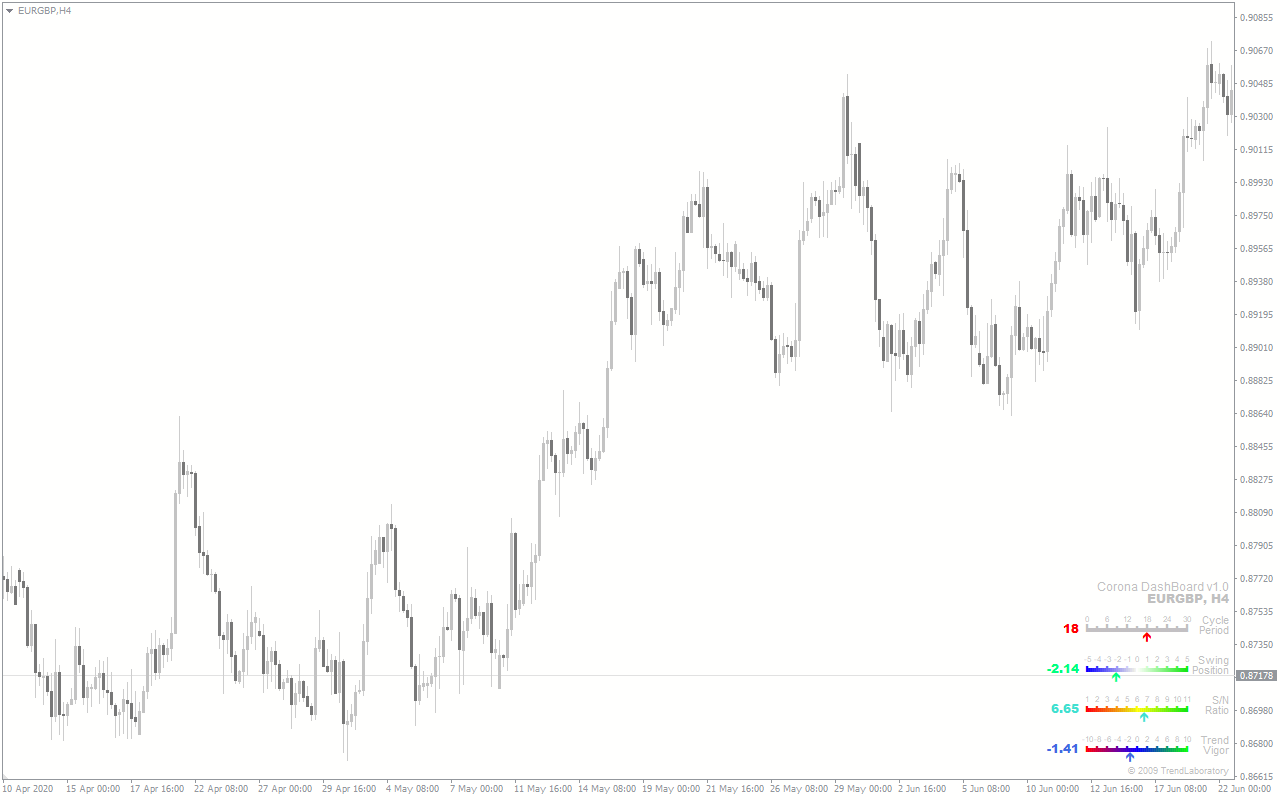
The indicator is a chart-friendly tool built with algorithms that provide real-time updates on market metrics like the Cycle Period, Swing Position, S/N ratio, and Market Vigor. These metrics are represented on a number scale in a row; their readings are highlighted using an arrow, which depicts the current market condition of a financial instrument.
The Cycle Period metric shows the level of the current trend cycle. On the other hand, the Swing Position reveals the condition of the market within a swing cycle – positive and negative swing positions suggest a bullish and bearish trend, respectively. The neutral swing position indicates a ranging market.
Furthermore, the metric for S/N shows the strength of the signal relative to the background noise (fluctuations) – a high S/N value indicates a strong reliable signal with little noise, while a low value depicts a weak signal with market noises. Finally, the Market Vigor row displays the current trend strength and momentum of an instrument, which helps traders determine the strength and weakness of the trend.
Benefits of Using the Indicator
- Overview Market Analysis: The Corona Dashboard indicator uses multiple technical analytic tools to provide traders with an overview of different market conditions. This helps traders make a more objective technical analysis and trading decisions.
- Time-Saving: The indicator saves traders the time it would take to analyze different market aspects manually. Thus, it eases technical analysis and enhances better decision-making.
Indicator Settings Description
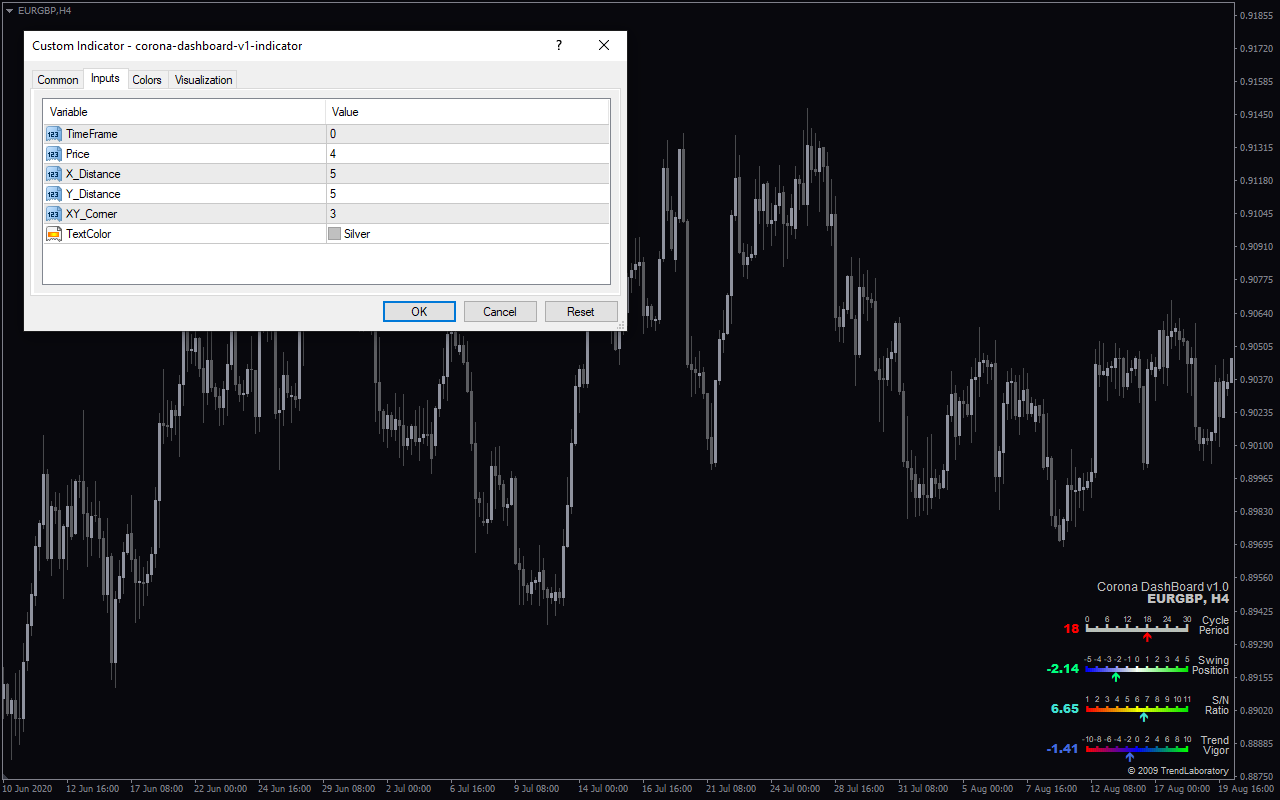
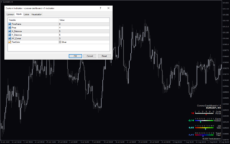
The indicator comes with the following customizable settings:
TimeFrame: Defines the time frame to begin analysis.
Price: Determines the price to start the market analysis.
X_Distance: Defines the horizontal position of the indicator’s dashboard chart.
Y_Distance: Defines the vertical position of the indicator’s dashboard on the chart.
XY_Corner: Determines the corner of the indicator’s dashboard on the chart.
TexColor: Determines the color to display the text.

Reviews
There are no reviews yet.