Features of the Correlation Indicator
In the currency market, there is a correlation between currency pairs. There are three possible correlations: zero, negative, and positive. When two currency pairs have a positive correlation, their trends will be similar. Put another way, when the bulls are in charge of the market, both currency pairs will see an upward trend. Similarly, a decline in one currency pair will be witnessed in the other.
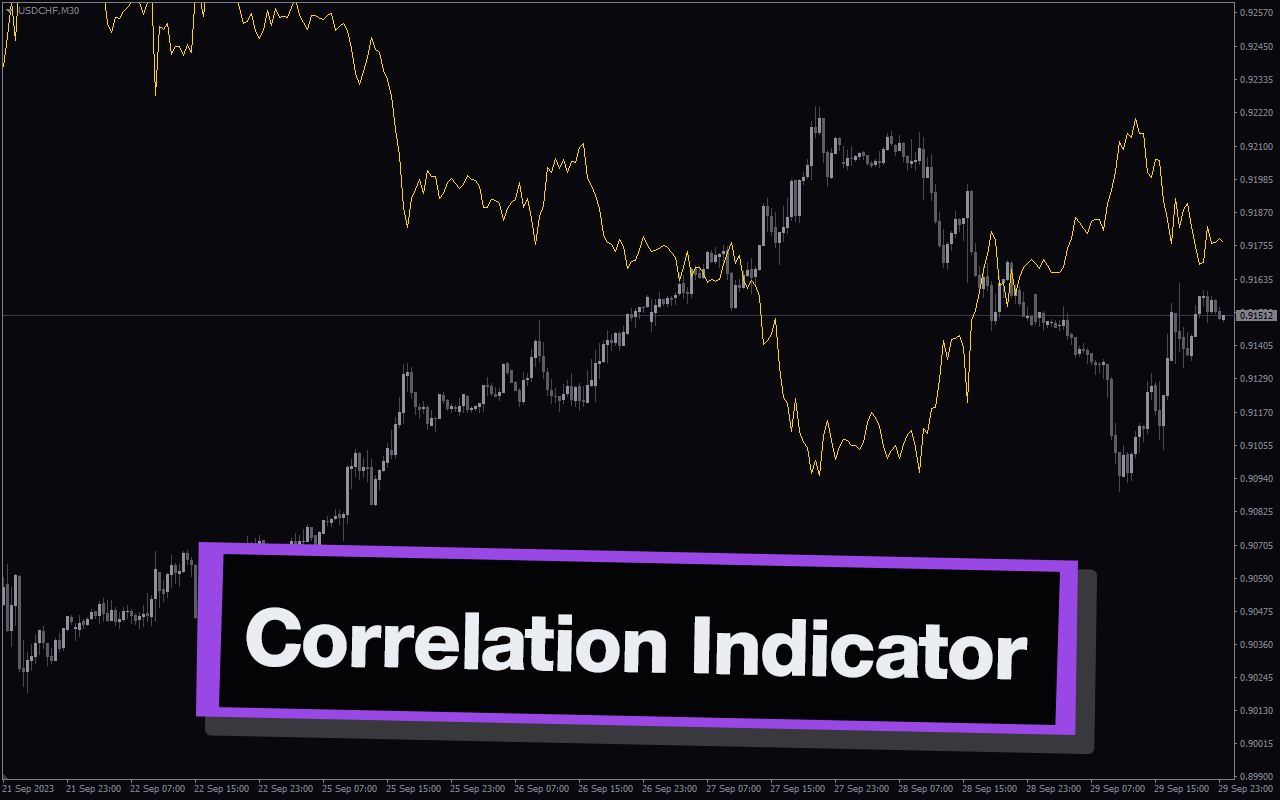
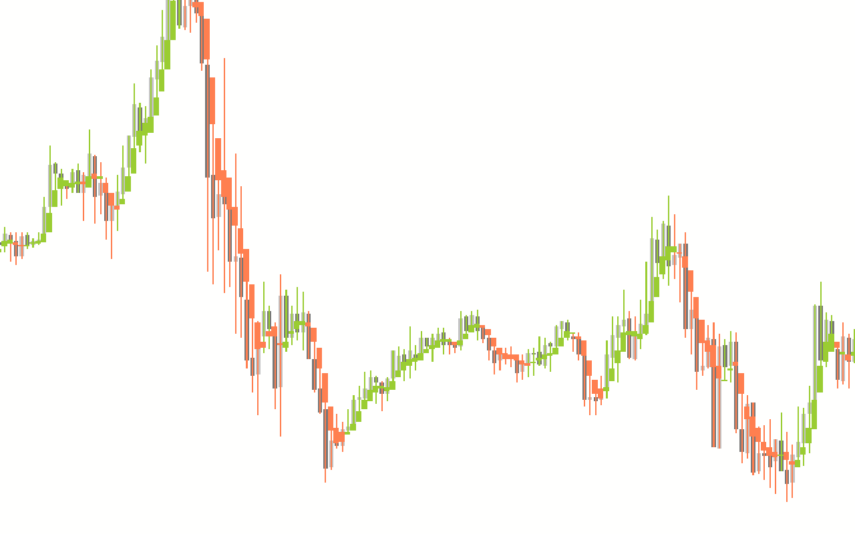
The correlation indicator displays the price movement of two correlated currency pairs. Therefore, you can get better trading opportunities when one pair moves before another. This implies that you may predict market turning points with greater accuracy.
How the Indicator Can Benefit You
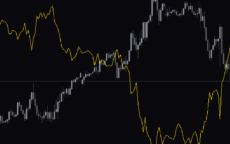
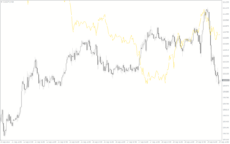
The Correlation Indicator does not give buy and sell signals all by itself. Instead, it overlays a second currency pair on the existing price chart. That means you will view the currency pair’s price movement displayed by the chart and the one mounted by the indicator. Therefore, you can watch how the market unfolds candle by candle in the two currency pairs.
Essentially, they should exhibit the same trend if the two currencies have a positive correlation. Therefore, if two positively correlated currencies show a trend disparity, that is a trading opportunity. For instance, you can capitalise on buying or selling one of them because the price will eventually follow the same direction again.
Indicator Setting Description
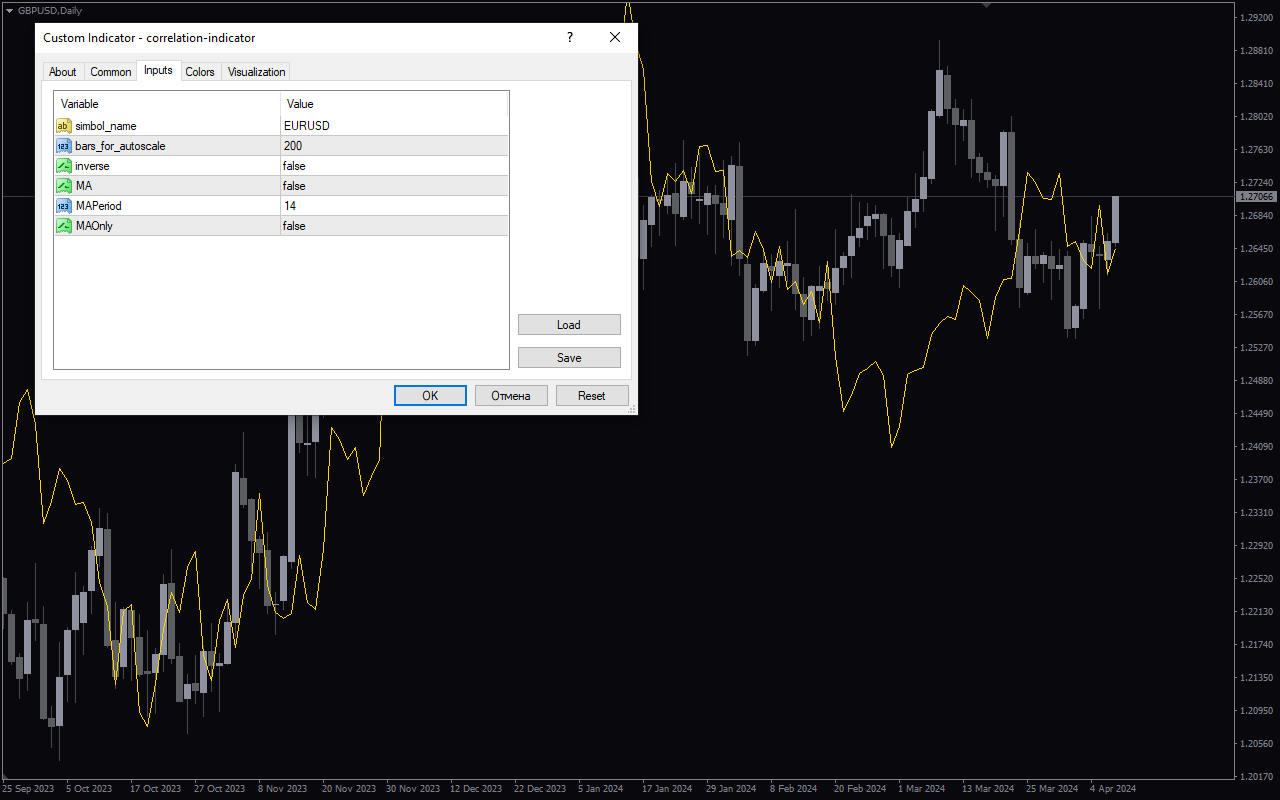
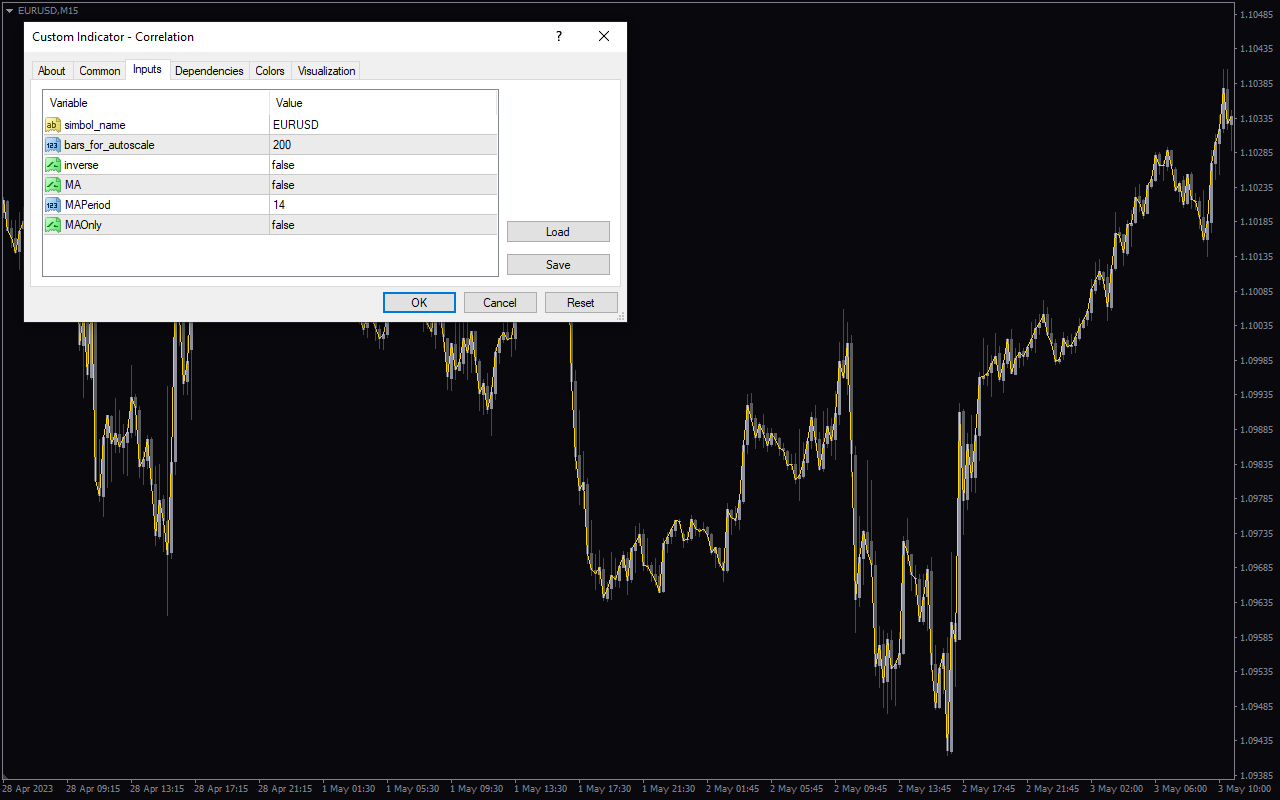
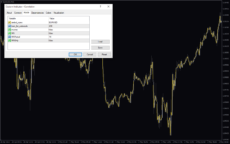
Simbol Name: This input shows the ticker of the currency pair whose chart will be displayed on the current one.
Bars of autoscale: This input allows you to change the number of bars that will be scaled on the chart.
Inverse: This input turns the chart upside down when set to true.
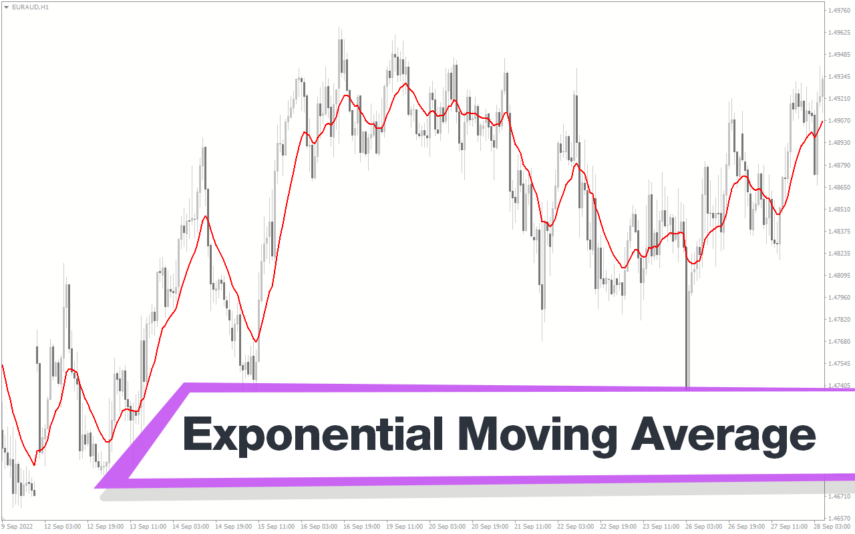
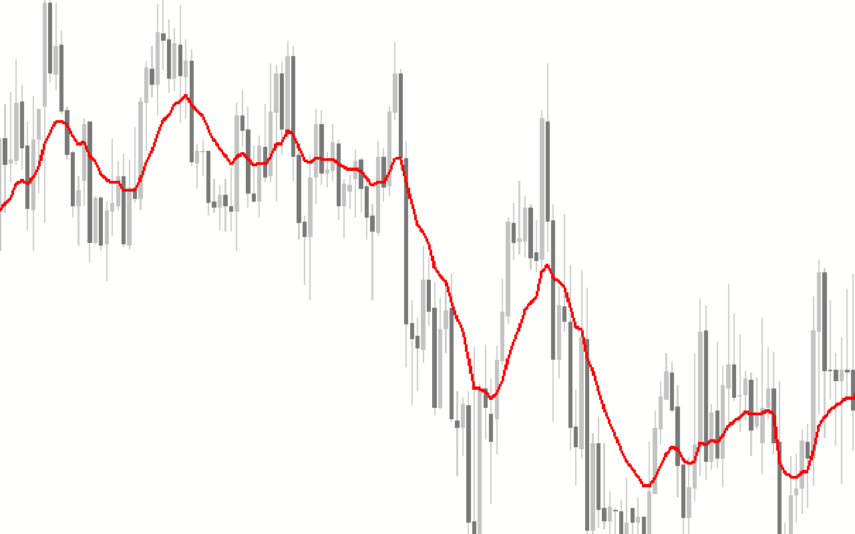
MA: Enable display of moving average for the overlaid chart.
MAPeriod: This input shows the moving average period.
MAOnly: This input enables/disables the display of moving averages only.



Reviews
There are no reviews yet.