The DMI ADX histogram oscillator MT4 indicator reflects both the forex trend strength and direction. The DMI- Directional Movement Index and ADX – Average Directional Index combine together to filter the trading signals during a non-trending market. In fact, forex traders can use this indicator to filter the buy and sell trading signals of DMI using the ADX.
Features of DMI ADX Histogram Oscillator MT4 Indicator
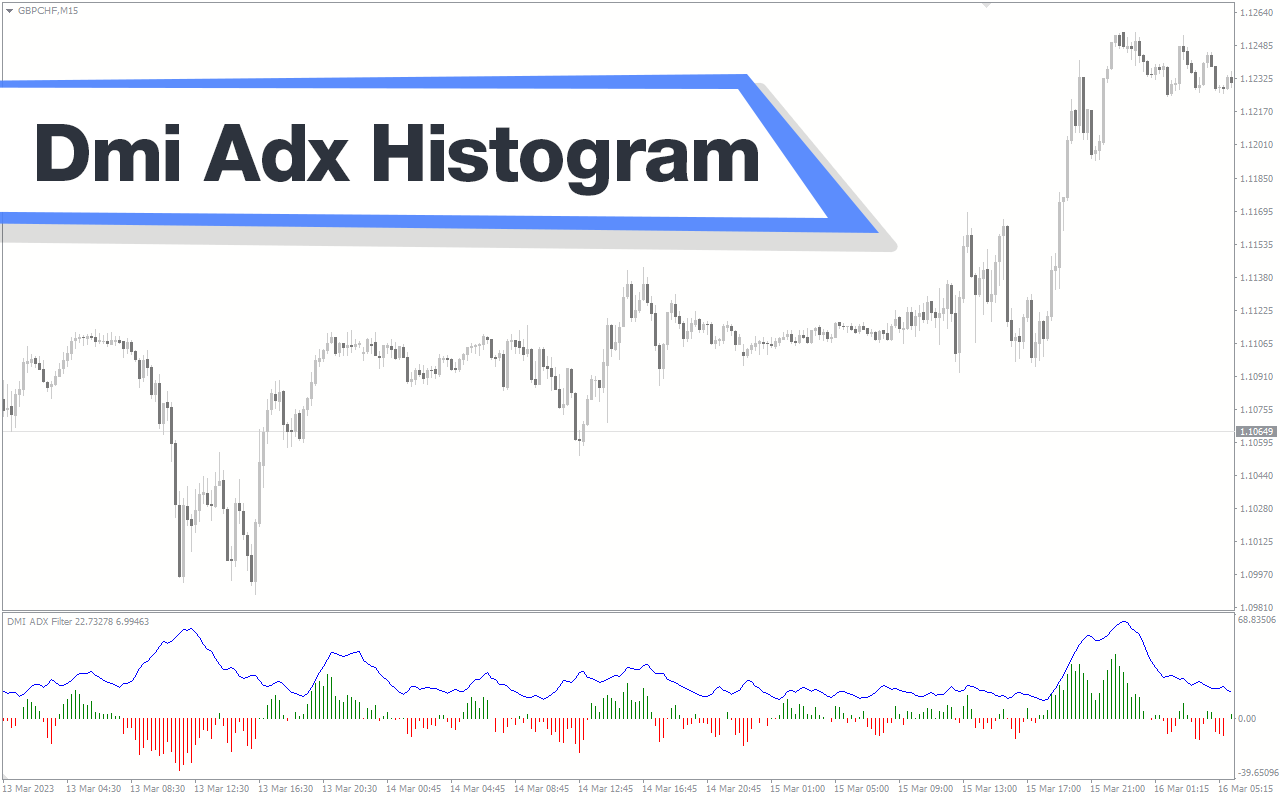
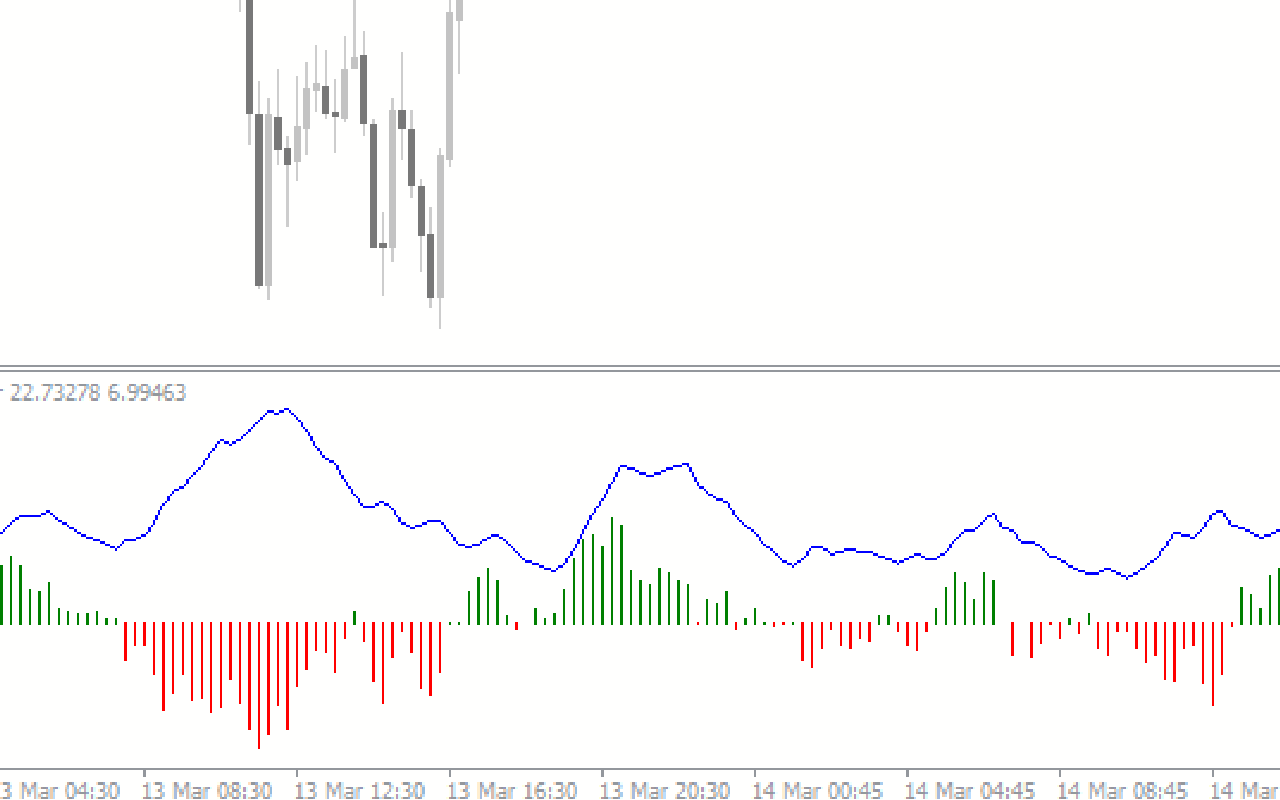
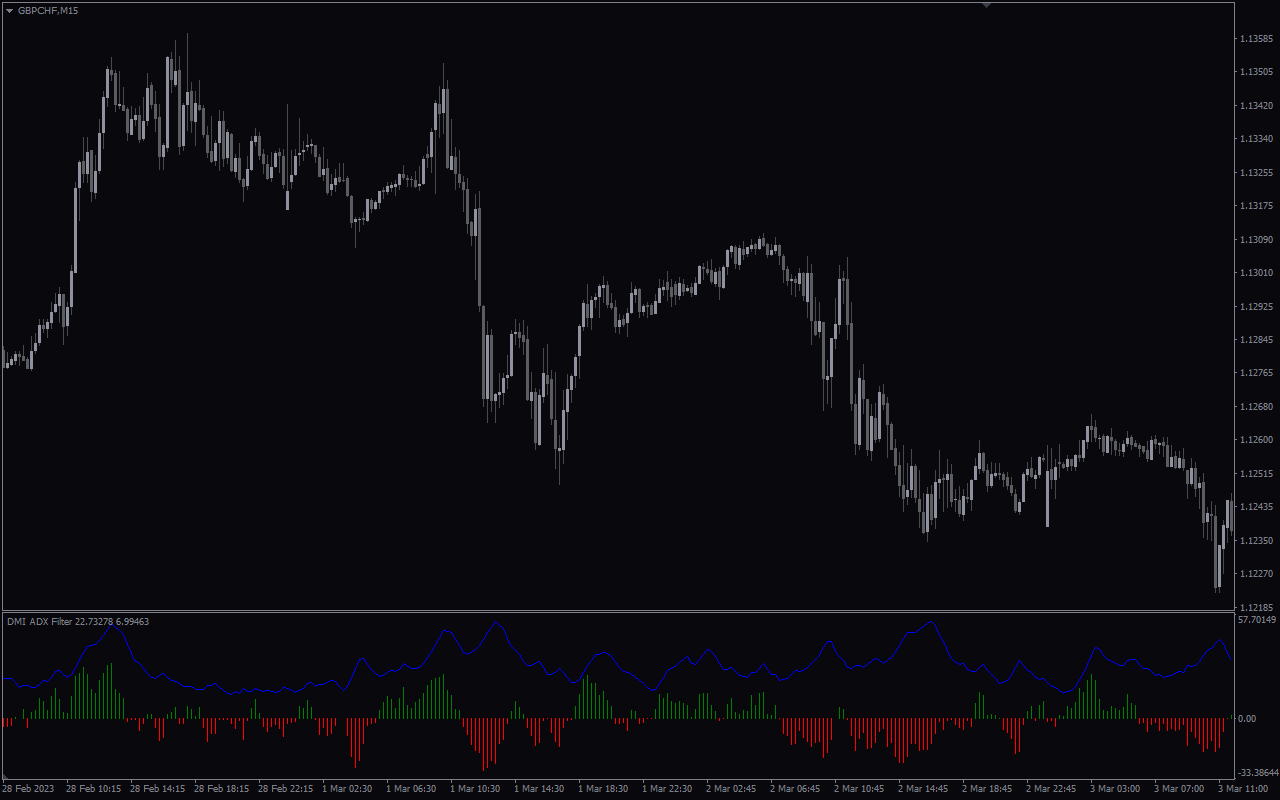
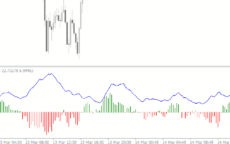
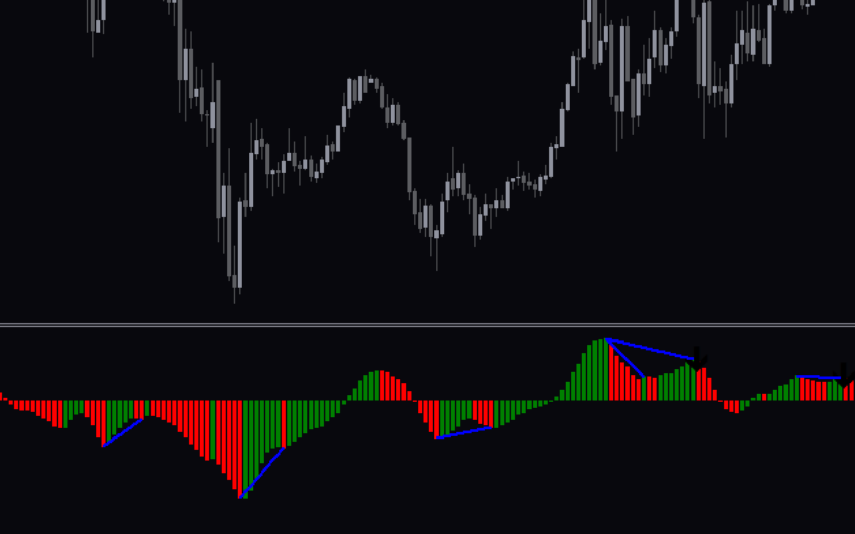
The indicator plots the DMI as a green and red histogram bars. Green histogram bars above zero level indicate a bullish market condition. Oppositely, red bars below the zero level represent a bearish price trend. So, the best trading strategy is to buy and sell upon the appearance of the green and red histogram bars.
Additionally, the indicator plots the ADX line above the zero line. This oscillator reflects the momentum of trend. However, it is important to note that the ADX does not provide trend direction. Oscillator values below 20 reflect a non-trending market, while ADX values above 20 represent the presence of trend. Simply put higher the value, stronger the trend and this applies during both bullish and bearish trend.
DMI indicator may produce choppy forex trading buy and sell signals and may not produce rewarding results. By using ADX as a filter to understand the underlying momentum, traders can trade the DMI signals only if there is enough trend strength in ADX.
In other words, technical traders should avoid trading the DMI buy and sell signals if the ADX is below 20.
Benefits of DMI ADX Histogram Oscillator MT4 Indicator
This indicator combines two very reliable MetaTrader indicators. So, it produces quality technical analysis and trading signals. It works on all chart time frames and benefits forex trend traders to profitably navigate the markets.
Indicator Settings Description
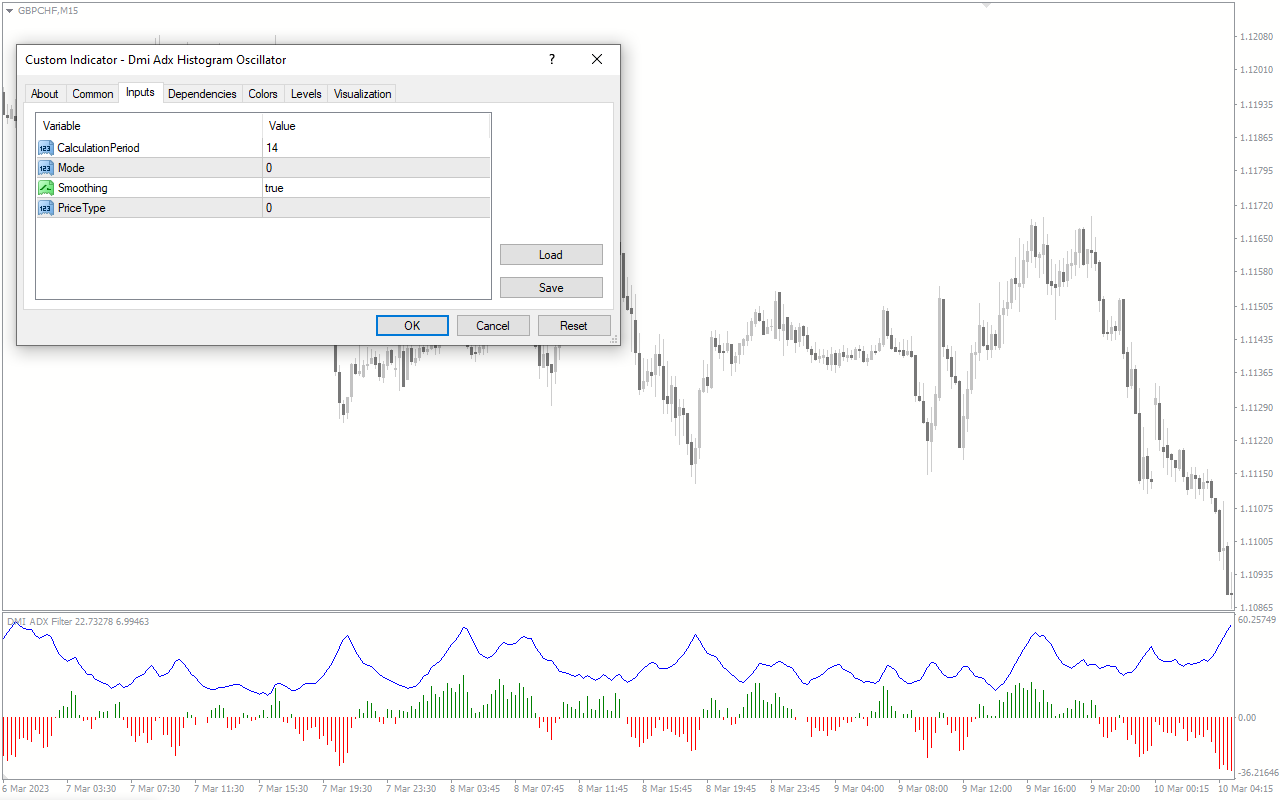
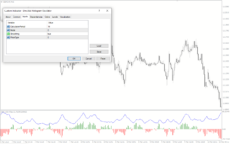
CalculationPeriod:, Mode:, Smoothing:, Price Type: Input for indicator calculation.


Reviews
There are no reviews yet.