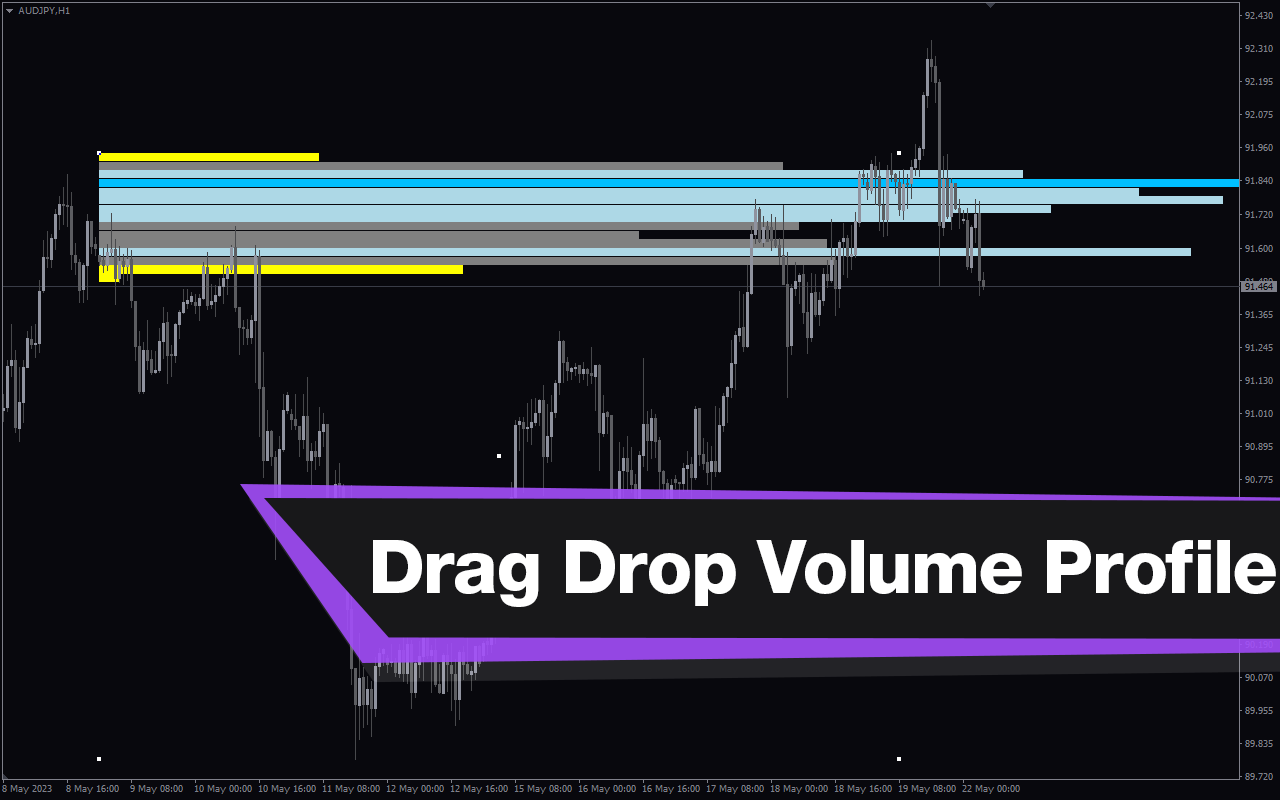
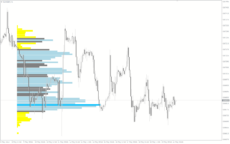
The Drag and Drop Volume Profile Indicator for MT4 is an advanced technical trading tool that displays the volume profile of the market. It provides traders with a visual representation of the volume traded in a zone in a market session.
The market volume profile helps Forex traders project the possible direction of the market and identify zones of a potential trend reversal. The concept here is the price tends to be attracted back to areas with high traded volume and then reverse or break out. A price breakout in such an area (zone with high traded volume) may signal trend continuation because the zone tends to act as support or resistance.
Features of the Indicator
The Drag and Drop Volume Profile indicator displays the following:
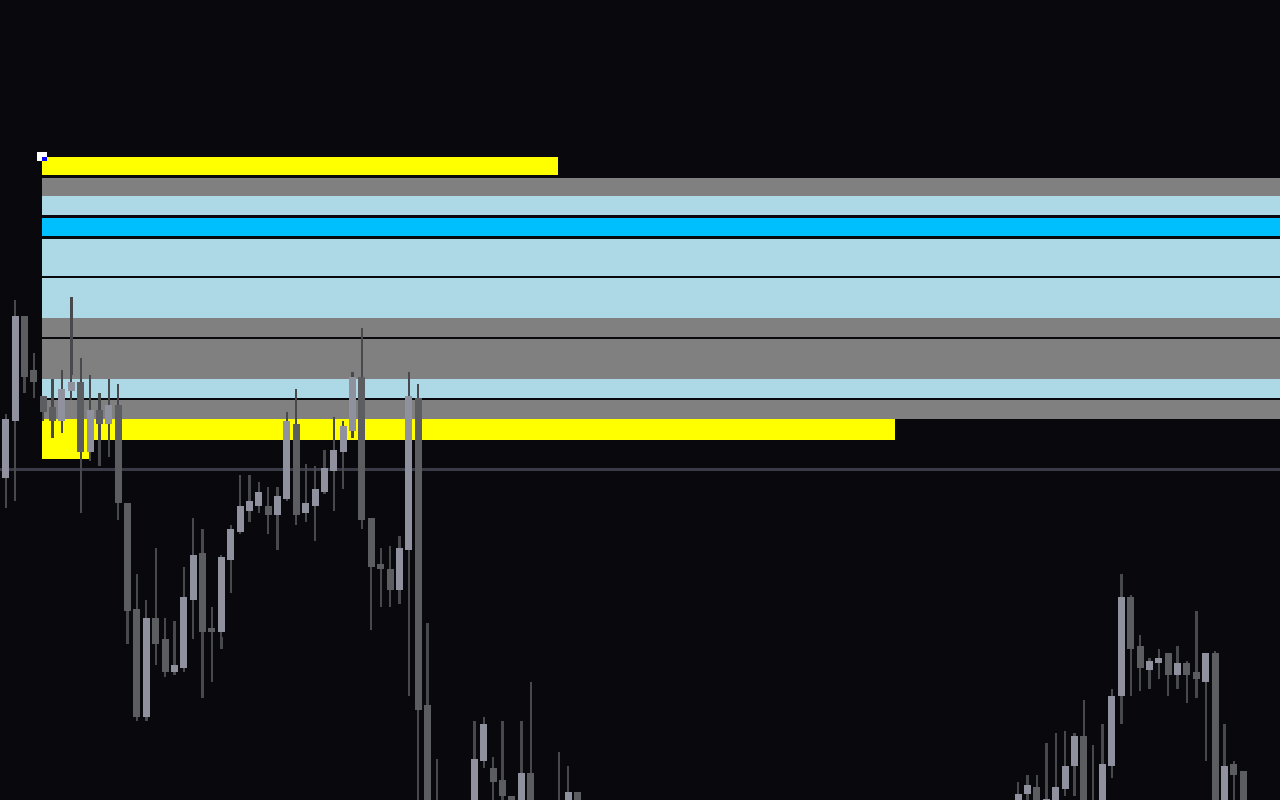
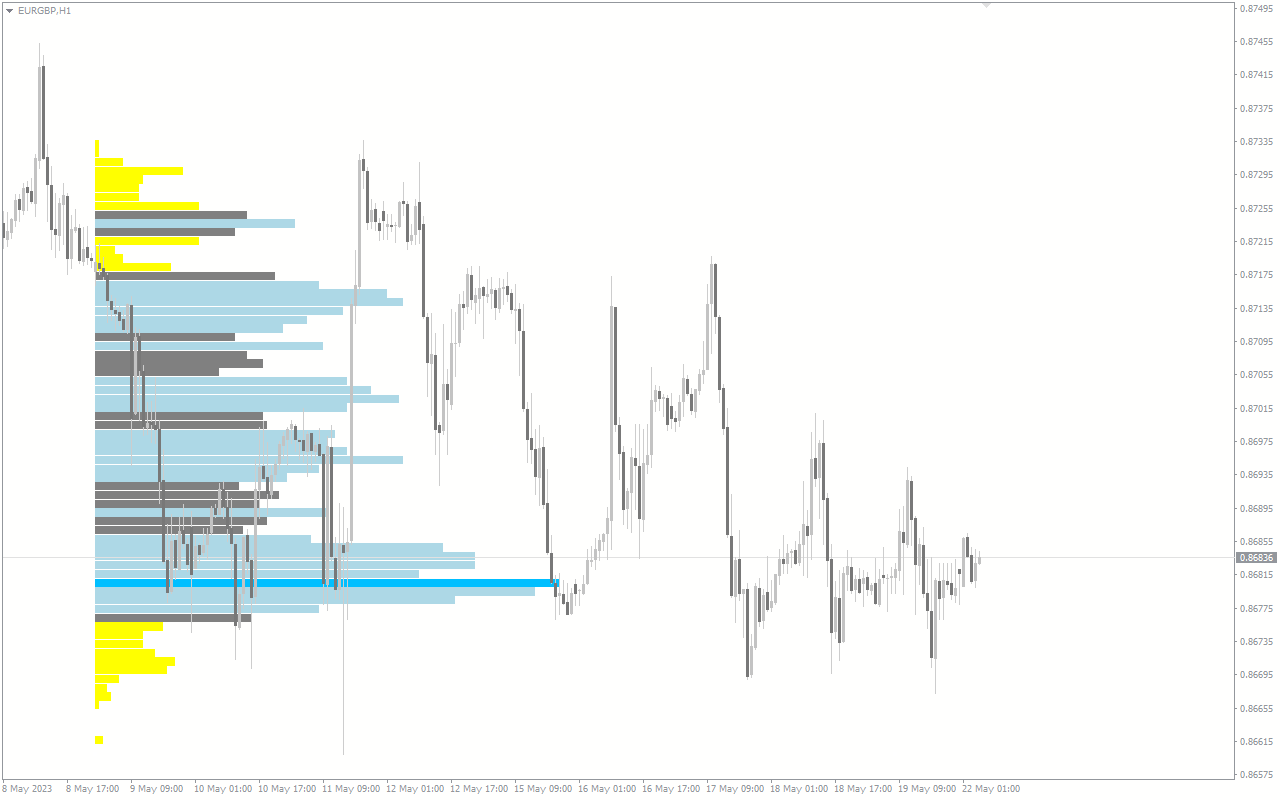
- Volume at Price Levels: The indicator indicates the volume traded at various price levels with horizontal bars. The length of the bar reflects the level of traded volume in that region.
- Value Area: This shows the zones where a percentage of volume (usually between 70.80%) was traded.
- Point of Control: This level shows where the highest trade volume occurred within a trading period.
Benefits of Using the Indicator
- Identification of Key Price Levels: The indicator marks out areas with high-volume trading activities, which tend to act as support and resistance levels.
- Confirmation of Breakouts: The price tends to move in the direction of a breakout accompanied by high volume. So, traders can use the indicator to confirm the strength of a breakout.
- Intraday Analysis: The indicator provides insight into where the high volume is occurring, which is valuable for intraday analysis of the market.
Indicator Parameter Settings
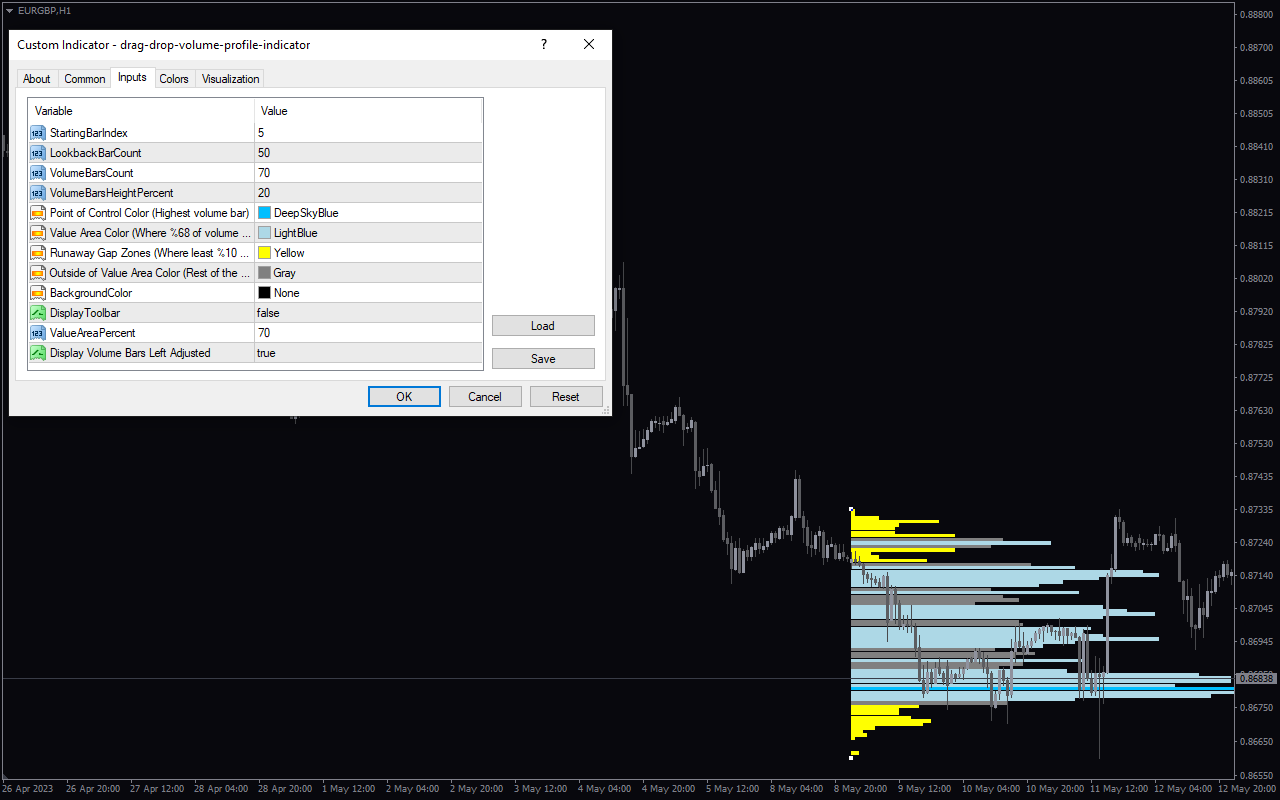
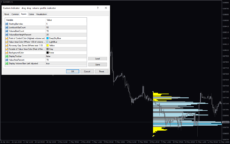
The indicator comes with the following customizable settings:
StartingBarIndex: Number of bars to begin analysis.
LookBackBarCount: Determines the maximum lookback bar for analysis.
VolumeBarCount: Shows the number of volume bars.
VolumeBarsHeightPercentage: Height of the volume bar.
Point of Control Color: Color to display the point of control.
Value Area Color: Color to display the value area.
Runaway Gap Zones: Color for the runaway gap zones.
Outside of Value Area Color: Color to display outside of the value area.
BackGroundColor: Color for the background.
Display Toolbar: Enables/Disables the display of toolbars.
ValueAreaPercent: Percentage of the value area.
Display Volume Bars Left Adjusted: Enables/Disables the value area to shift the left.

Reviews
There are no reviews yet.