Features of the DWM Channels Indicator
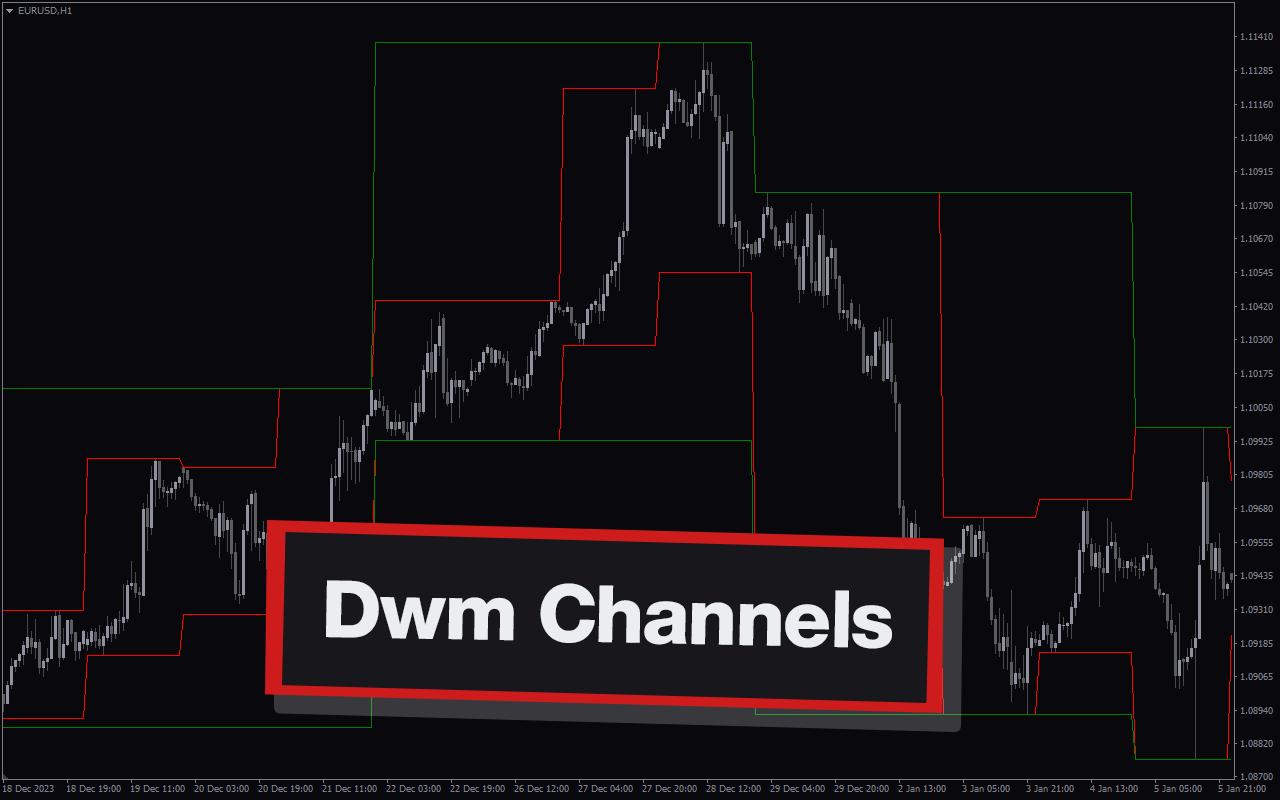
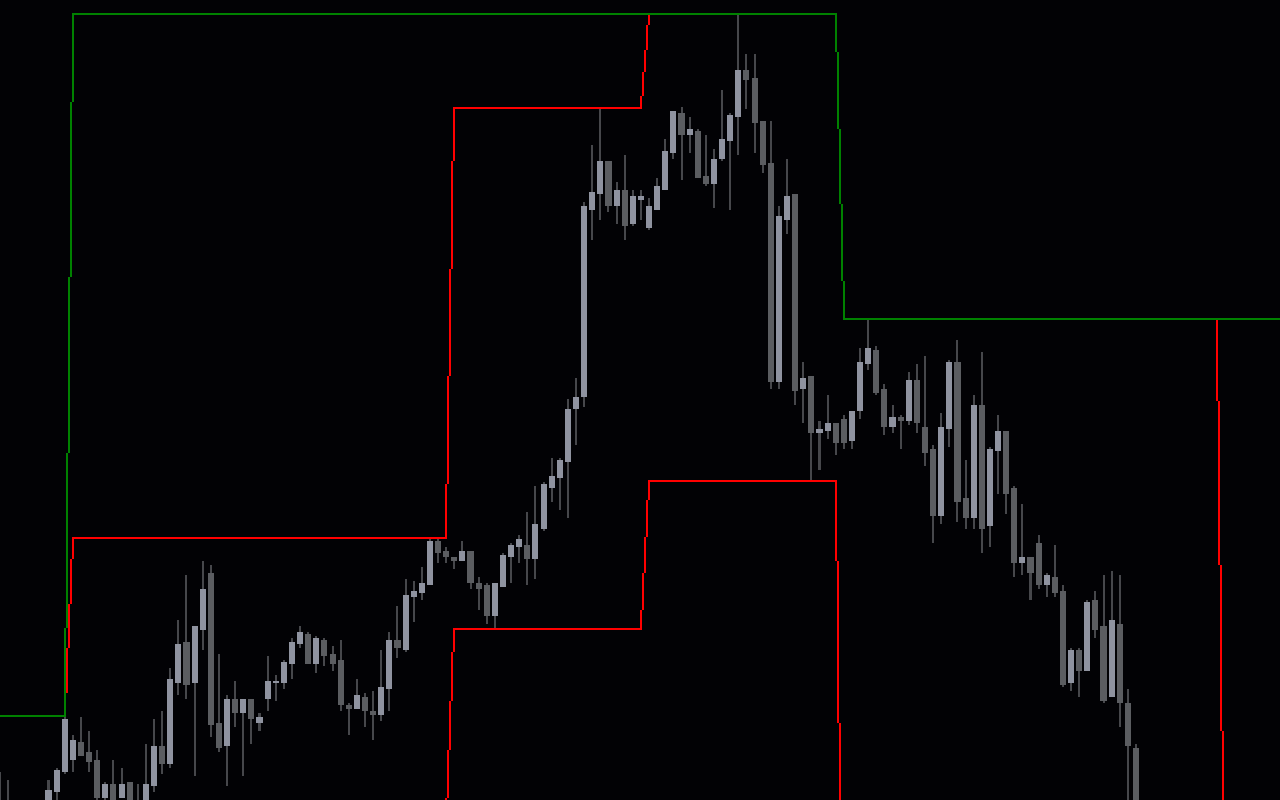
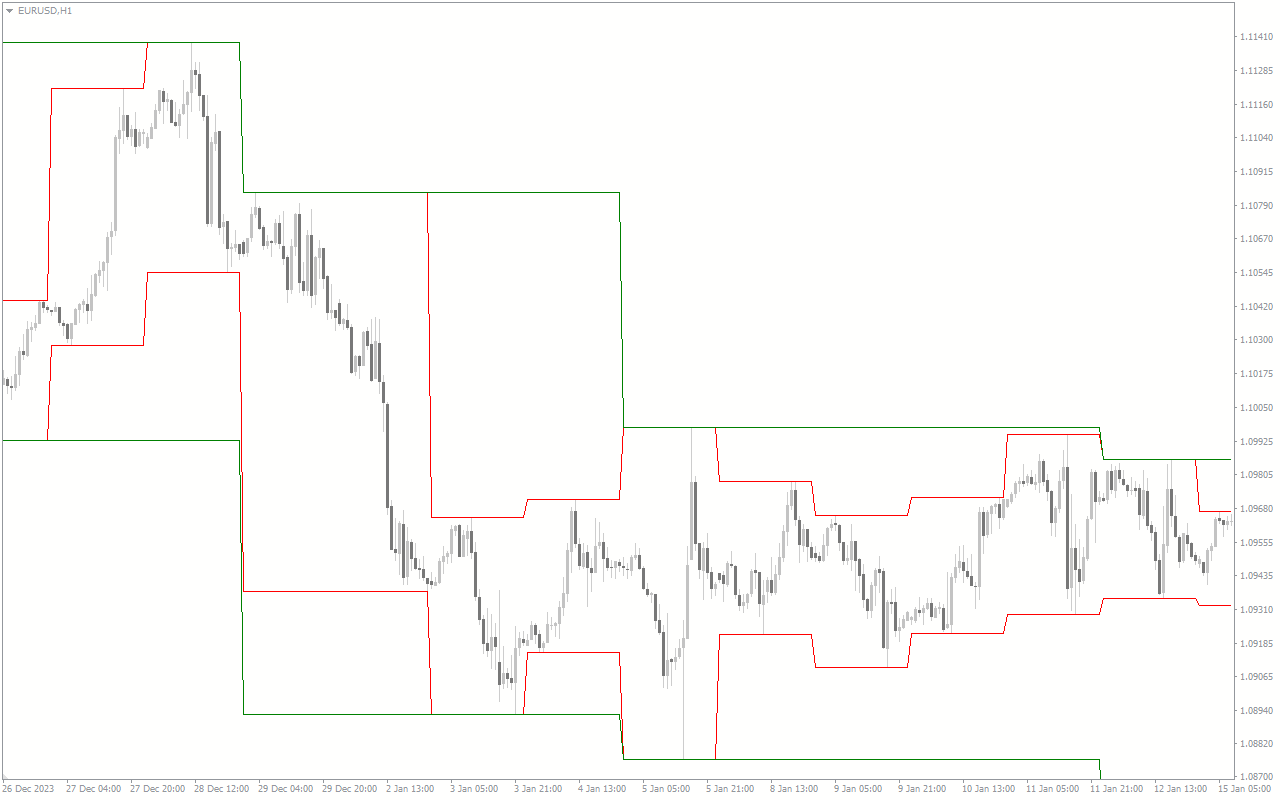
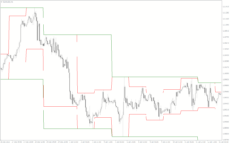
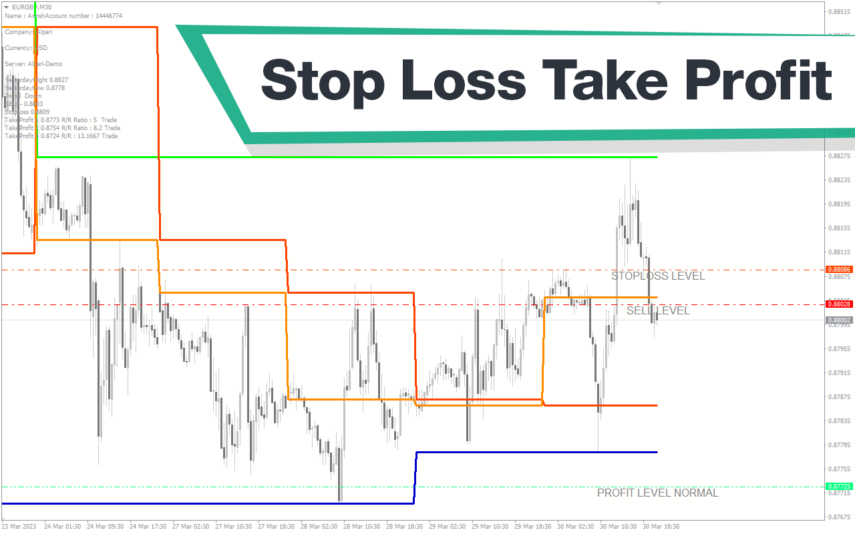
The DWM channels indicator calculates and draws moving channels using specific highs and lows. These channels show the ranges in the daily, weekly, and monthly timeframes and keep changing with more data. As a result, it creates a moving range.
Moreover, the indicator draws a fast, medium, and slow channel. The fast channel uses a shorter period to calculate the range, while the slower channel uses a longer period. Therefore, it allows you to trade ranges in the smaller timeframe while considering the larger timeframe range. The faster channel is colored red, the medium channel is green, and the slower channel is blue.
The red channel is best suited for shorter-term traders, the green channel for swing traders, and the blue channel for position traders.
How the Indicator Can Benefit You
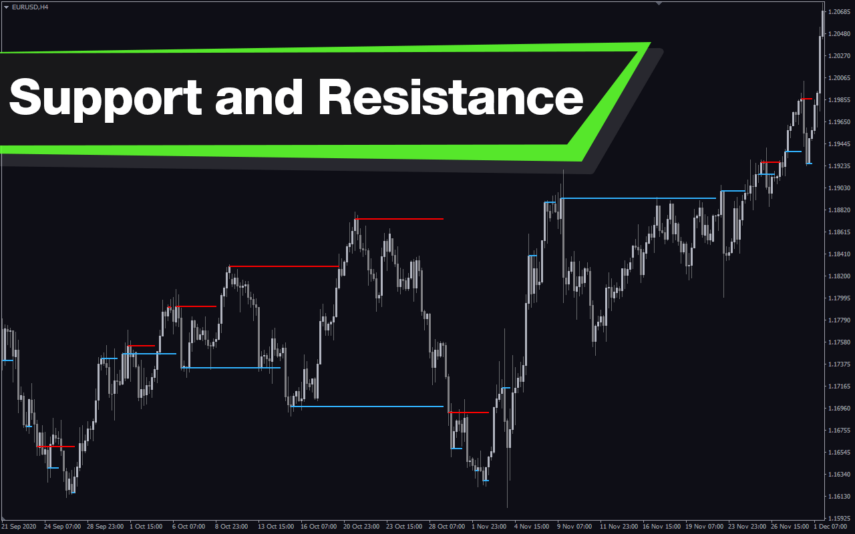
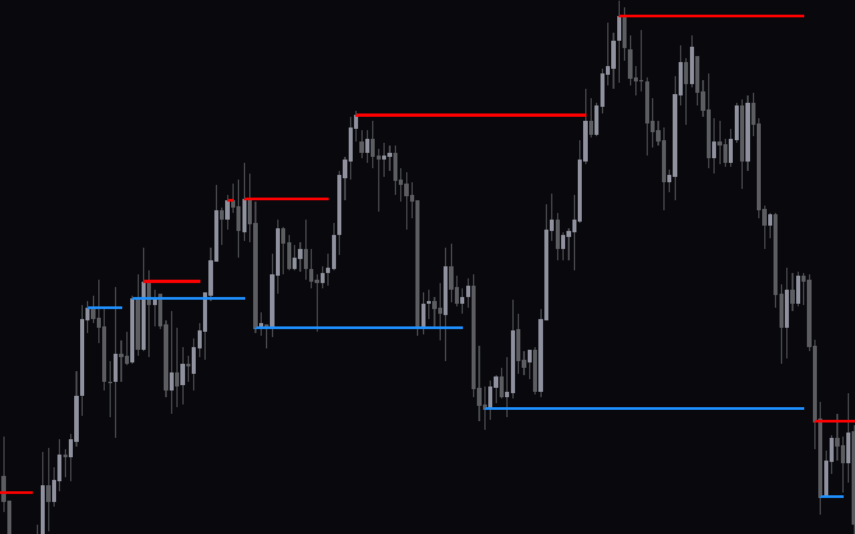
The DWM Channels Indicator allows traders to identify key support and resistance levels that could lead to reversals. Additionally, since the indicator draws the channel with ranges, traders can take advantage of breakout trades.
Short-term traders like scalpers can focus on the red channel when using the indicator for reversals. In this case, they can choose to trade with the trend. If the channel is moving up, the price is in an uptrend. Therefore, traders can focus on the channel’s support line and place buy orders whenever the price returns to this level.
On the other hand, when the channel is moving down, the price is in a downtrend. Therefore, traders can focus on the channel’s resistance line. Place a sell order every time the price pulls back to the resistance.
For breakouts, traders can buy every time the price breaks above the channel resistance and sell every time it breaks below the support.
Indicator Setting Description
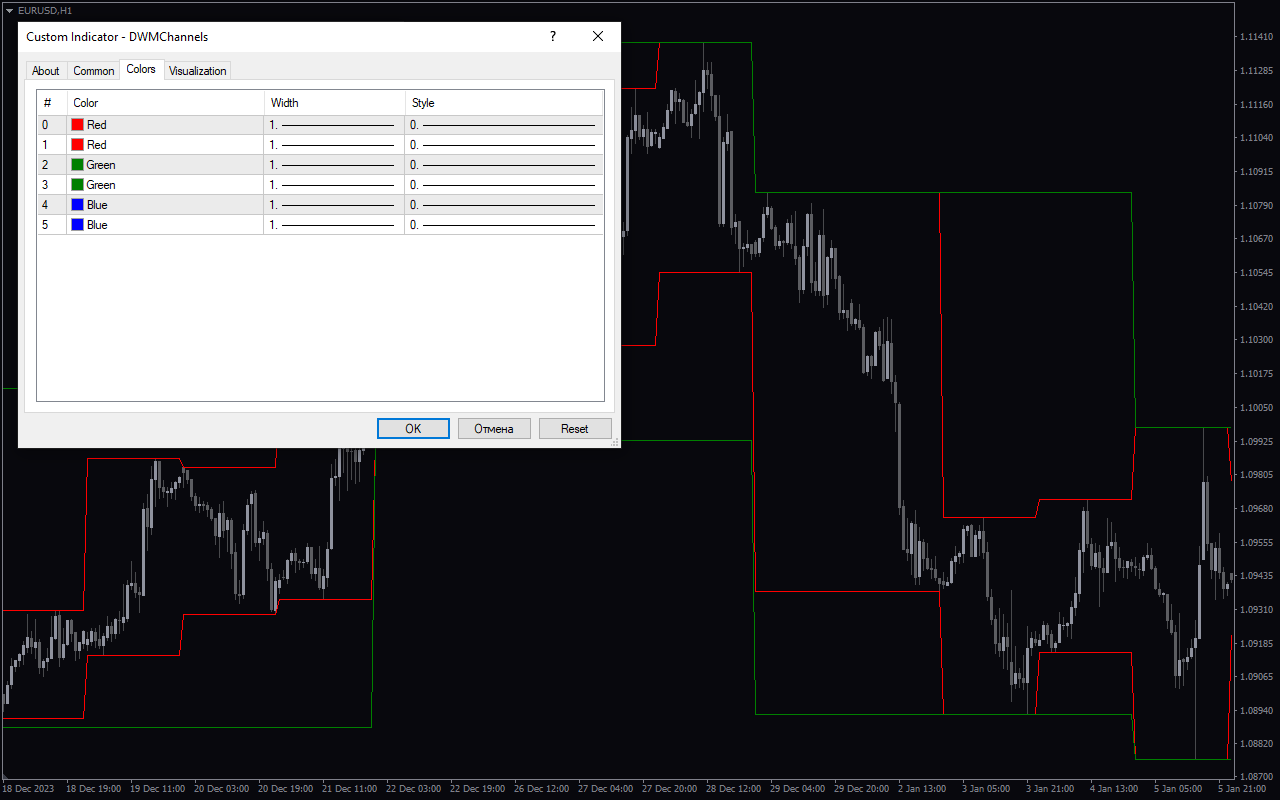
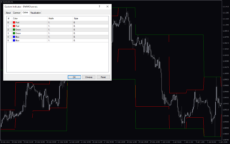
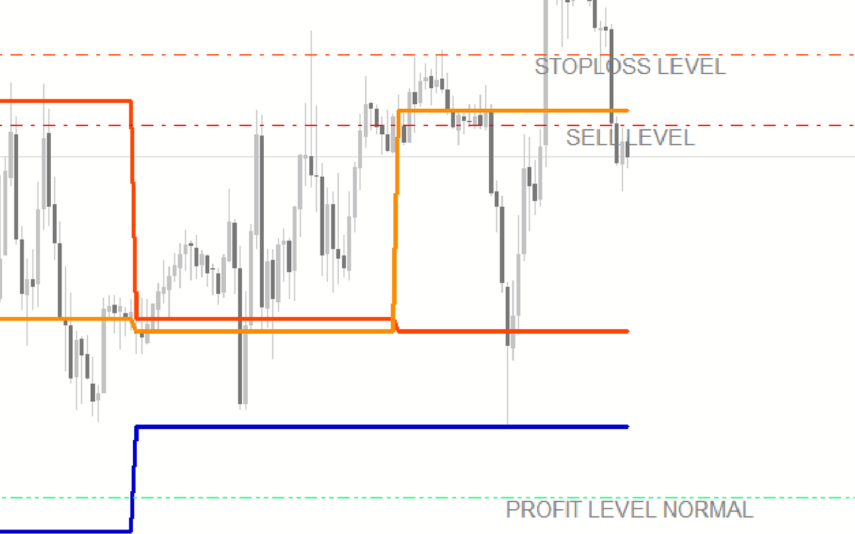
The indicator only allows you to change the colors of the various channels as shown below.

Reviews
There are no reviews yet.