The Exponential Moving Average, known as the EMA, is a versatile technical tool used across the financial market for trend analysis of an instrument. It is highly responsive to price change, which makes it a popular indicator widely used by forex traders to identify the trend direction, reversal zones, and trade entry/exit zones.
However, it isn’t ideal to be used in isolation to make a trade decision. In other words, the indicator is recommended to be used as a confluence with price action/other indicators to make better decisions.
Features of the Indicator
The Exponential Moving Average Indicator tracks and analyzes the trend condition of an asset by calculating the difference between the data of the previous trading days and that of the current price. Furthermore, it is very responsive to the price, which makes it one of the most used technical indicators incorporated by scalpers and day/intraday forex traders into their trading system.
Finally, the Exponential Moving Average Indicator allows users to customize the parameters to suit their trading styles.
Benefits of the Indicator
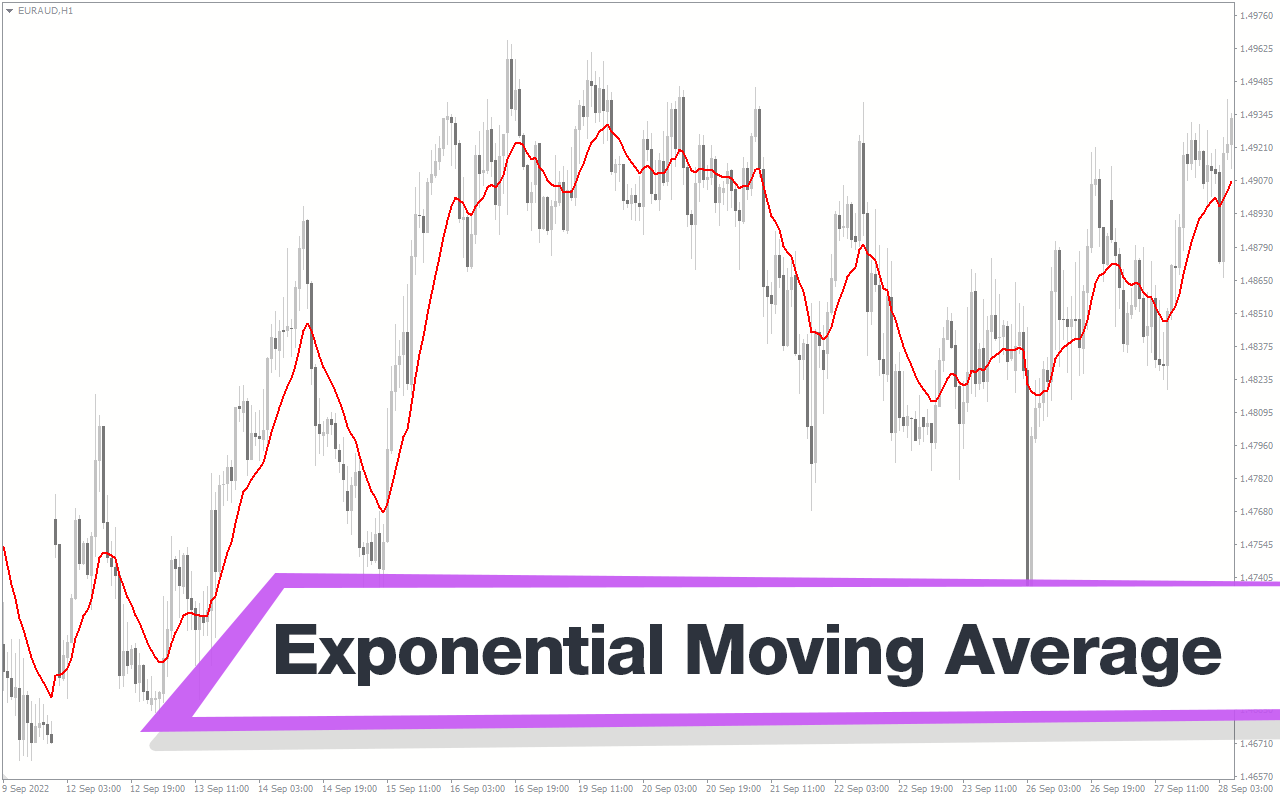
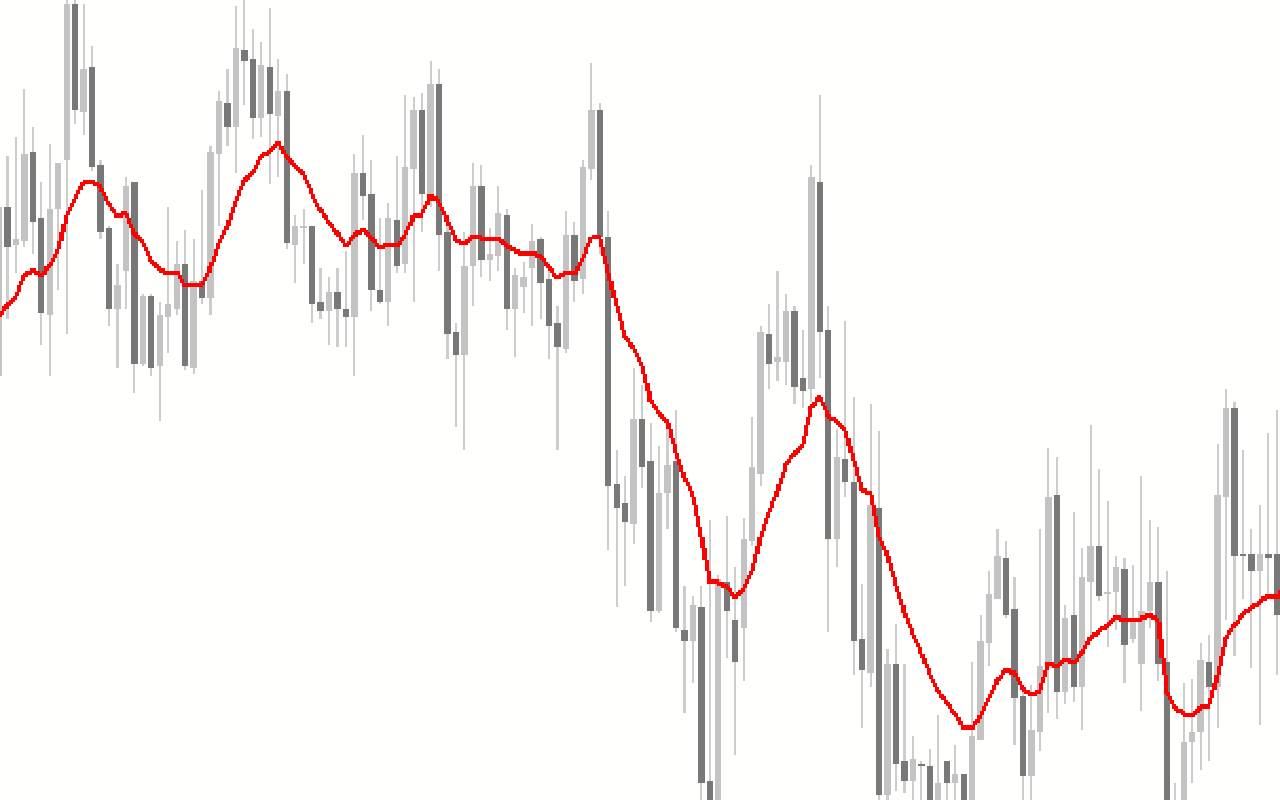
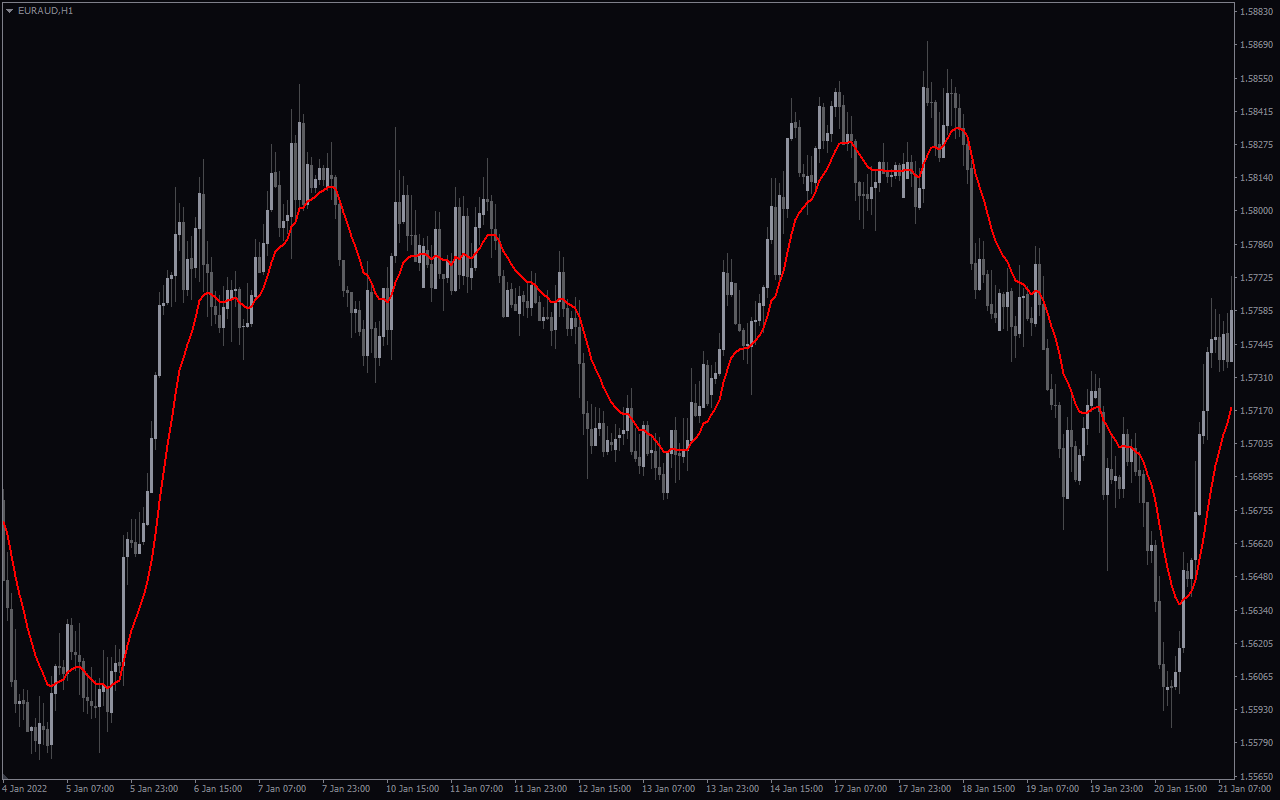
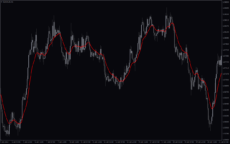
a) Determines Trend Direction: The Exponential Moving Average Indicator delivers valuable insight into the trend direction of an instrument. For instance, it depicts a potential bullish move when the price is above the EMA and posits a bullish trend’s strength when the indicator steadily rises.
b) High Responsiveness: The Exponential Moving Average Indicator is very sensitive to changes in the price direction because it uses more recent price data to analyze the market.
c) Determines Entry/exit zones: The Exponential Moving Average Indicator is one of the most widely used indicators to determine an optimal trade entry/exit zone. So, a buy/sell position may be opened when two EMAs of different parameters crossover, especially when the price is at a significant level.
Indicator Settings Description
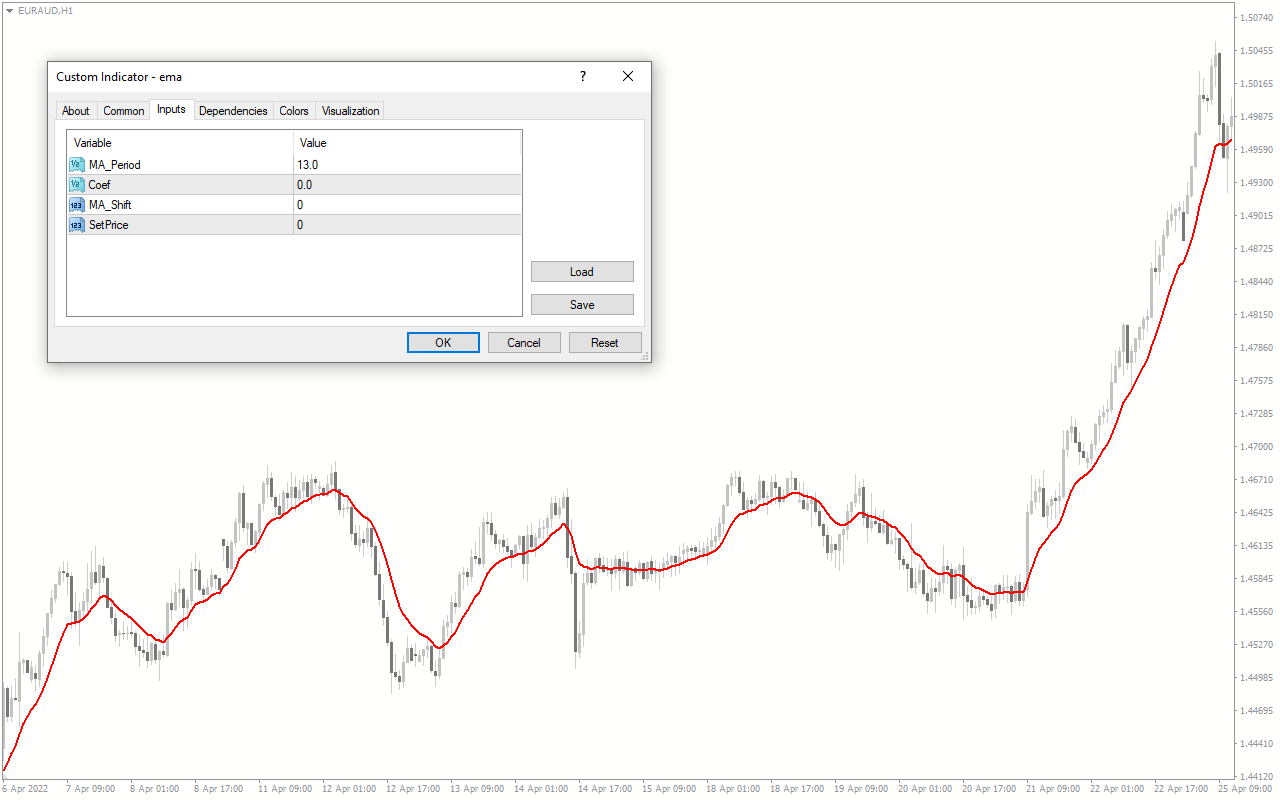
The indicator comes with the following customizable settings:
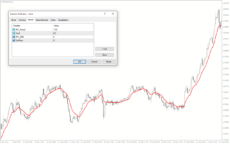
MA_Period: This defines the period of the moving average for trend analysis.
Coef: This shows the coefficient value to calculate the correlation between different financial assets.
MA_Shift: This determines the position of the indicator’s line on the chart.
Set price: This sets a price level for trend analysis.

Reviews
There are no reviews yet.