Features of the Fractals Adjustable Period SR Indicator
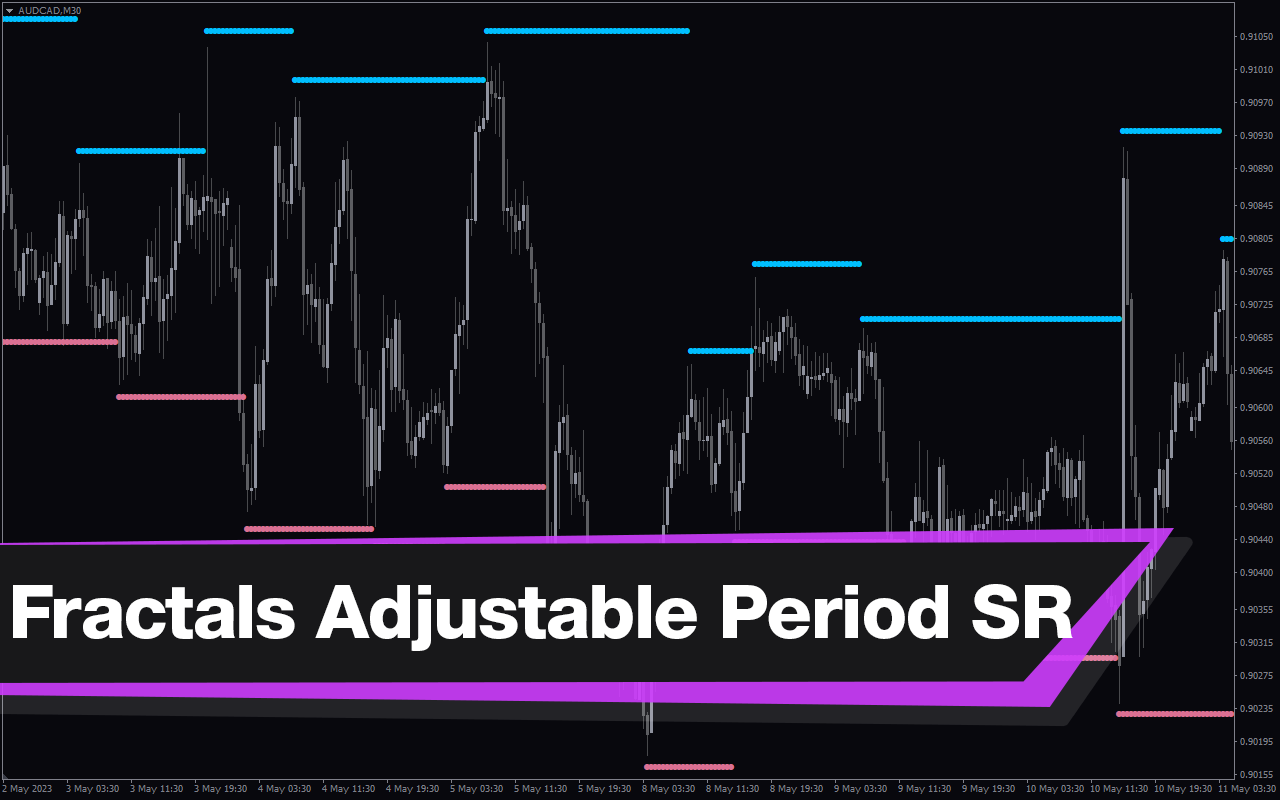
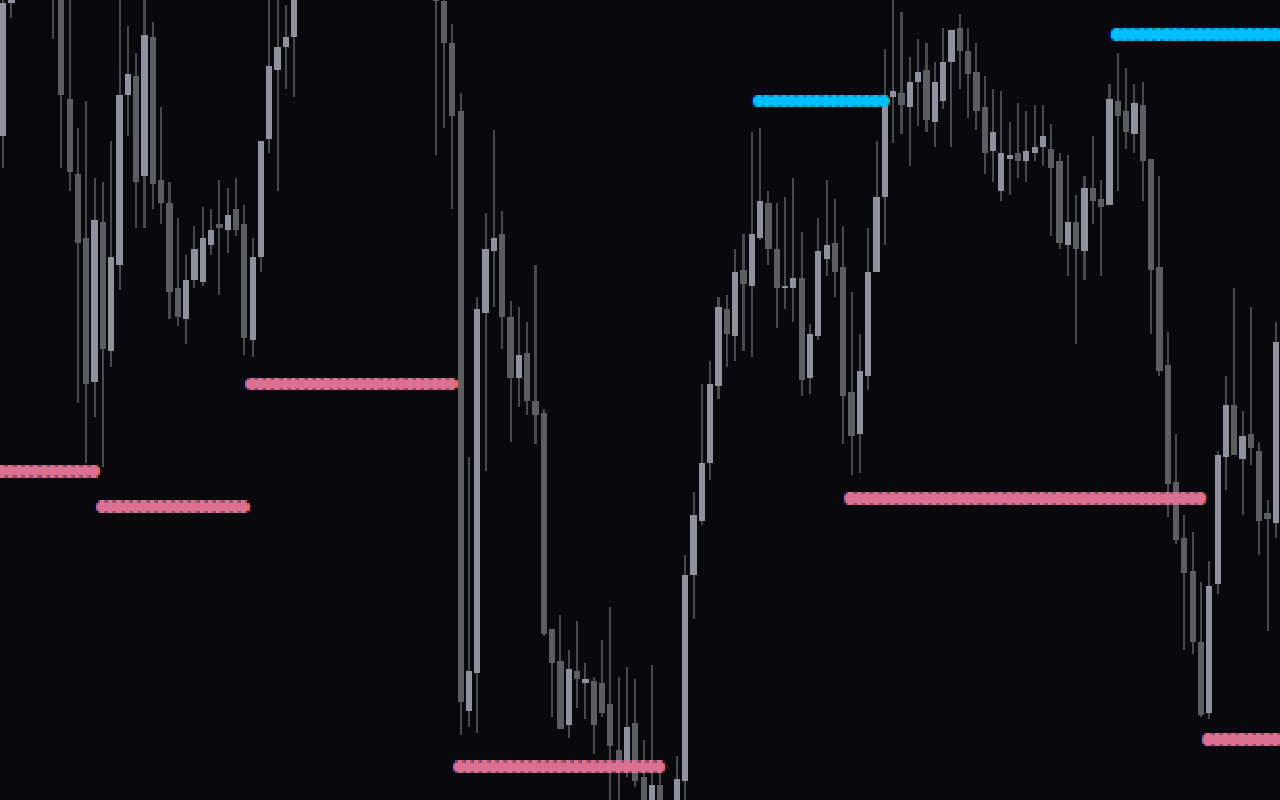
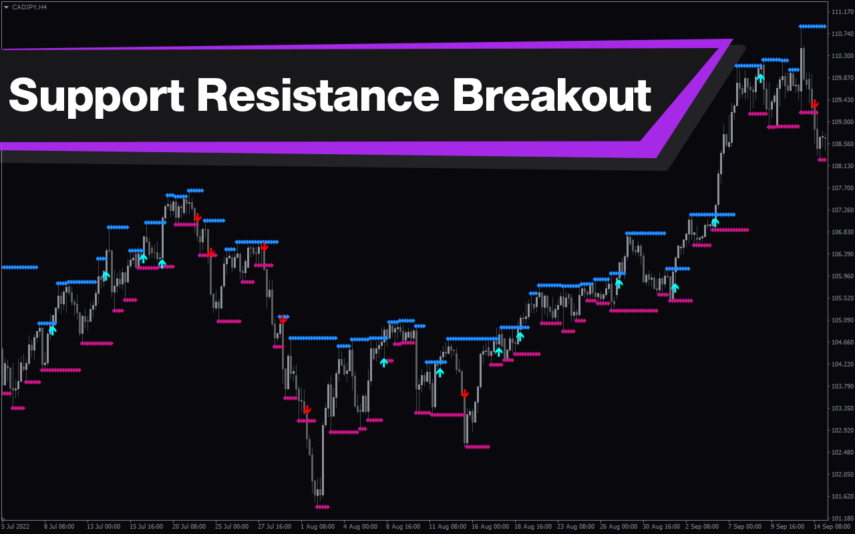
The Fractals Adjustable Period SR draws support and resistance lines on the chart based on fractals. Fractals come when the price makes a U-turn, going from bullish to bearish or bearish to bullish.
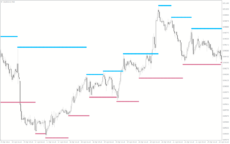
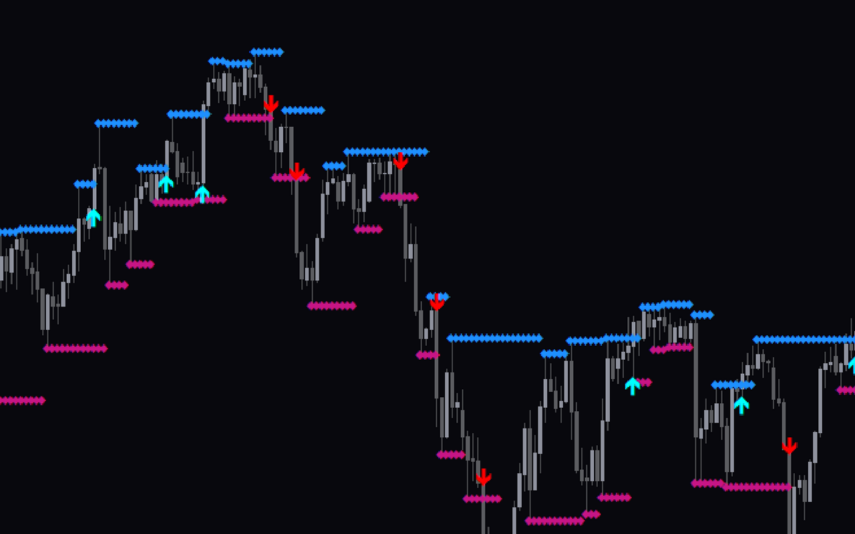
The indicator draws a deep sky-blue resistance line every time the price turns from bullish to bearish. On the other hand, it draws a pale violet-red support line when the price turns from bearish to bullish.
How the Indicator Can Benefit You
The Fractals Adjustable Period SR indicator helps traders identify key reversal areas in the market. At the same time, it is perfect for a breakout strategy. The indicator shows a bullish trend when it makes consistently higher support and resistance lines. In this case, you can wait for the price to pull back to the support line to enter a buy position. Place your stop loss below the previous low and targets according to your strategy. You can also trade a break above the resistance line.
Meanwhile, when the support and resistance lines are consistently lower, it shows a bearish trend. Here, wait for the price to return to the resistance line to place their sell orders. Place your stop loss above the previous high with appropriate targets. You can also trade a break below the support line.
On the other hand, when the support and resistance lines are neither going up or down, it shows a ranging market. Aggressive traders can sell every time the price hits the resistance line and buy when it hits the support line.
Indicator Setting Description
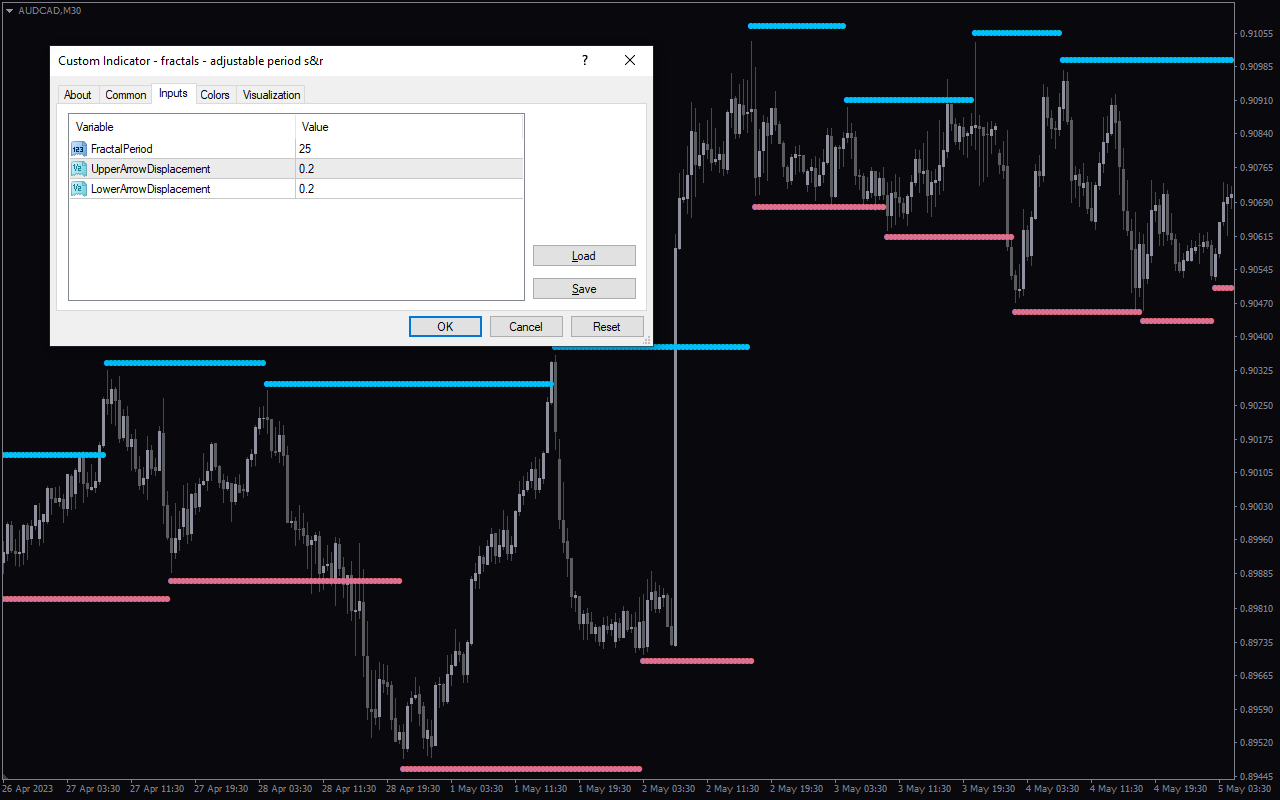
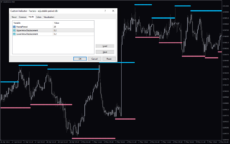
Fractal period: This input allows you to change the indicator period
Upper arrow displacement: This input allows you to change the distance between the bullish signal lines and the candlesticks.
Lower arrow displacement: This input allows you to change the distance between the bearish signal lines and the candlesticks.




Reviews
There are no reviews yet.