The Givonly SnR SnD indicator For MT5 is a multi-timeframe analysis indicator that displays support/resistance and supply and demand zones of the price. It is an ideal technical trading tool for identifying trend reversal and continuation in the financial markets.
The indicator can increase trading efficiency and performance by helping traders identify these key levels without hassle. It can come in handy for beginners and experienced traders during technical analysis and in identifying potential trend reversal or continuation zones.
Features of Givonly SnR SnD Indicator For MT5
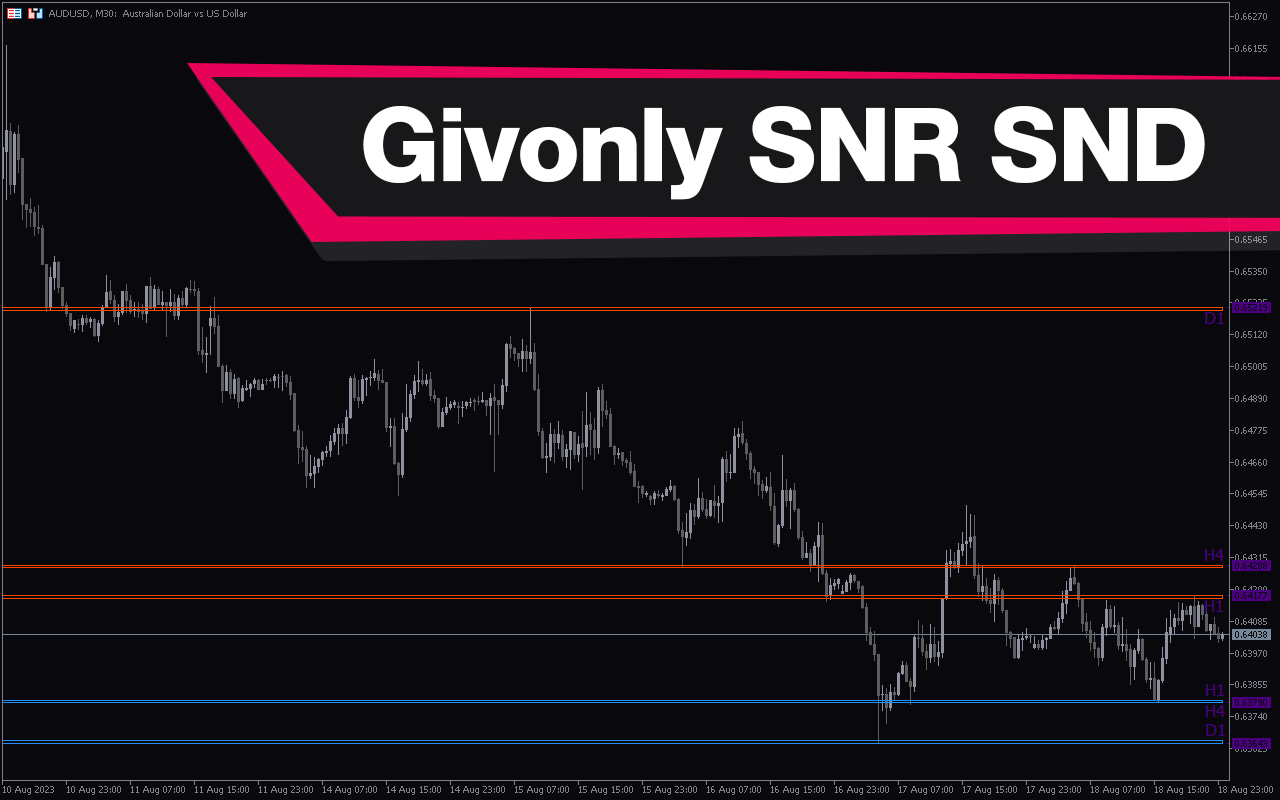
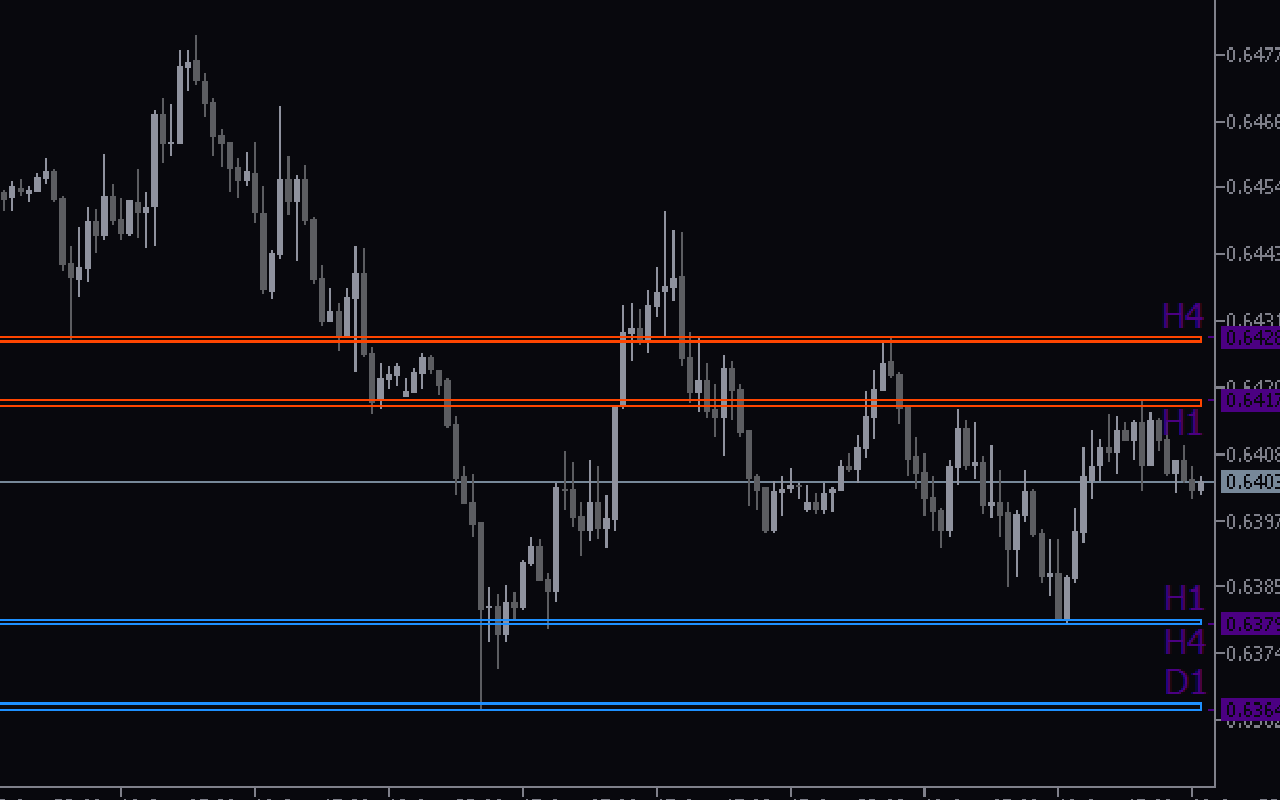
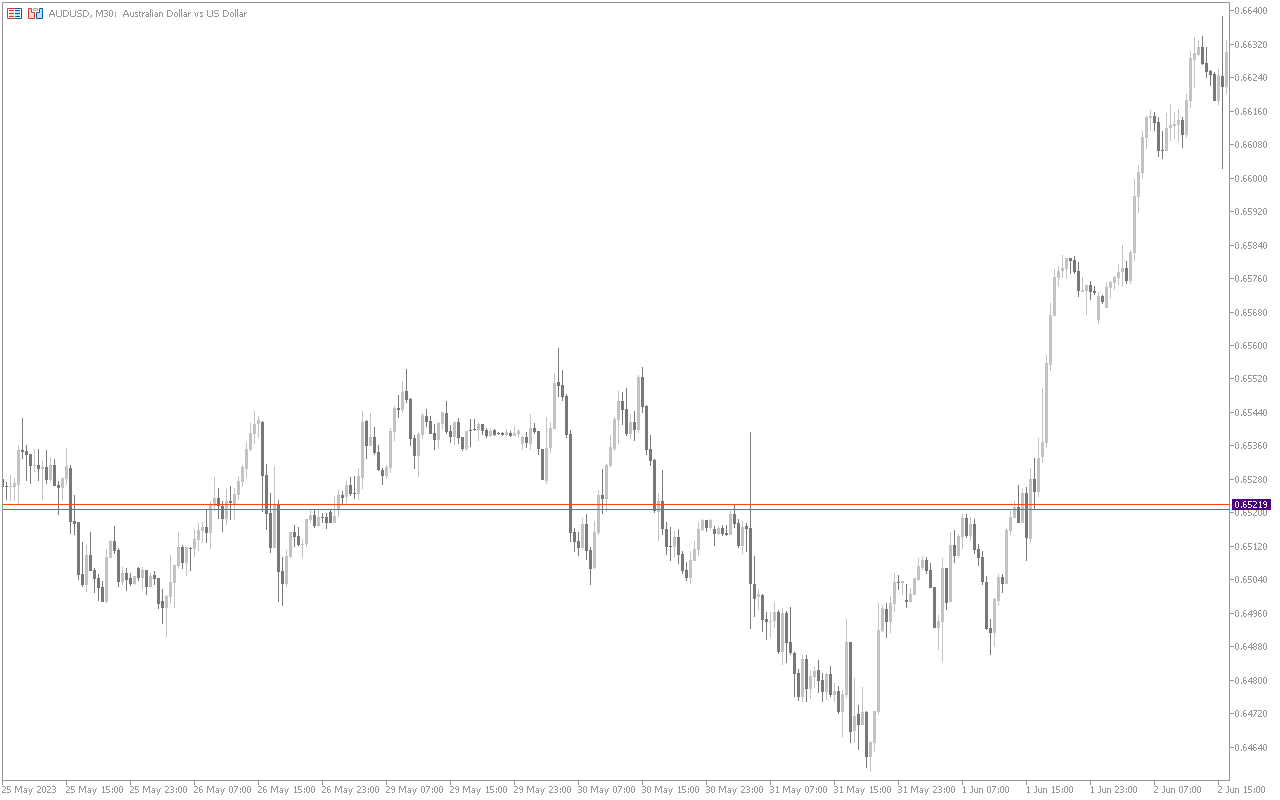
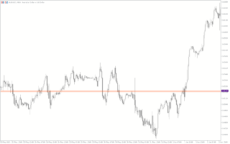
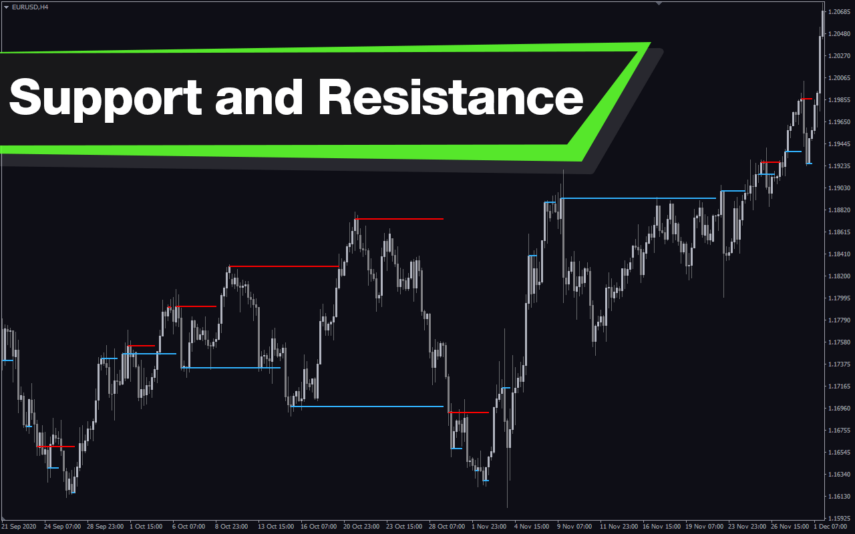
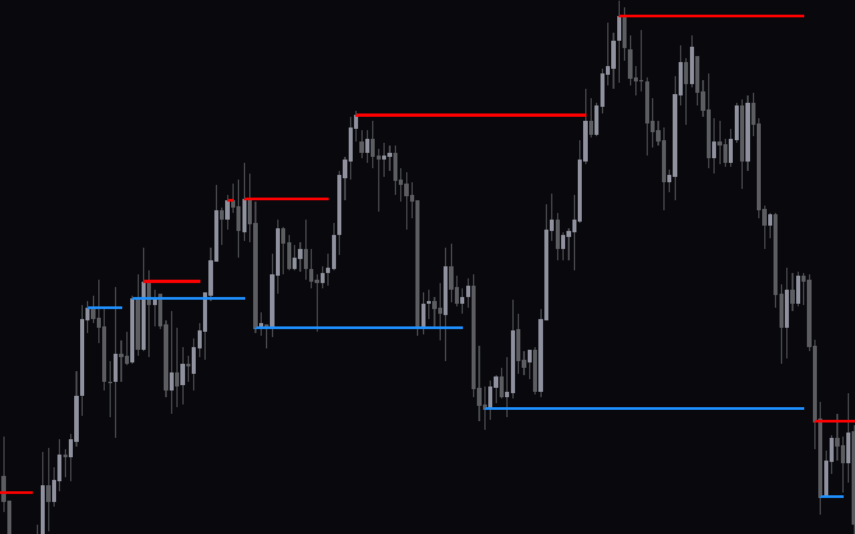
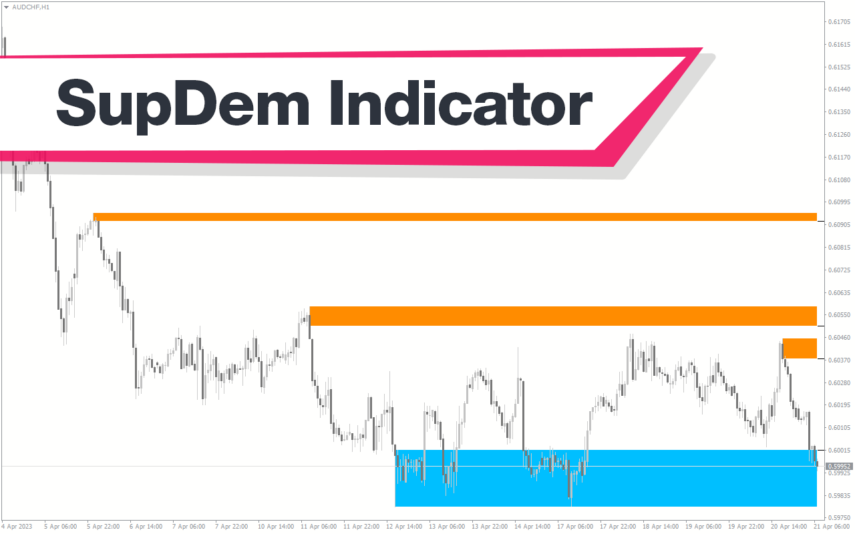
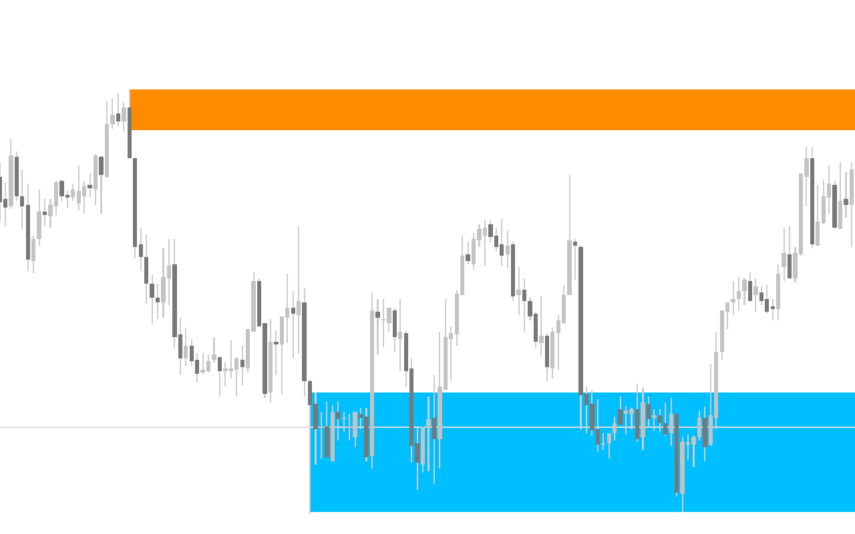
The indicator plots dodger-blue and orange-red horizontal lines, highlighting support/resistance and supply/demand levels. It plots these pivotal levels across the H1 to the W1 time frames, which indicate potential trend reversal and continuation zones.
Benefits of Using the Indicator
- Key Support and Resistance Identification: The indicator assists traders in making better trading decisions by automatically identifying and plotting the support/resistance and the supply/demand zones on the chart.
- Time Efficiency: The indicator saves traders the process of identifying key price support levels, thereby improving technical analysis and overall trading efficiency.
Indicator Settings Description
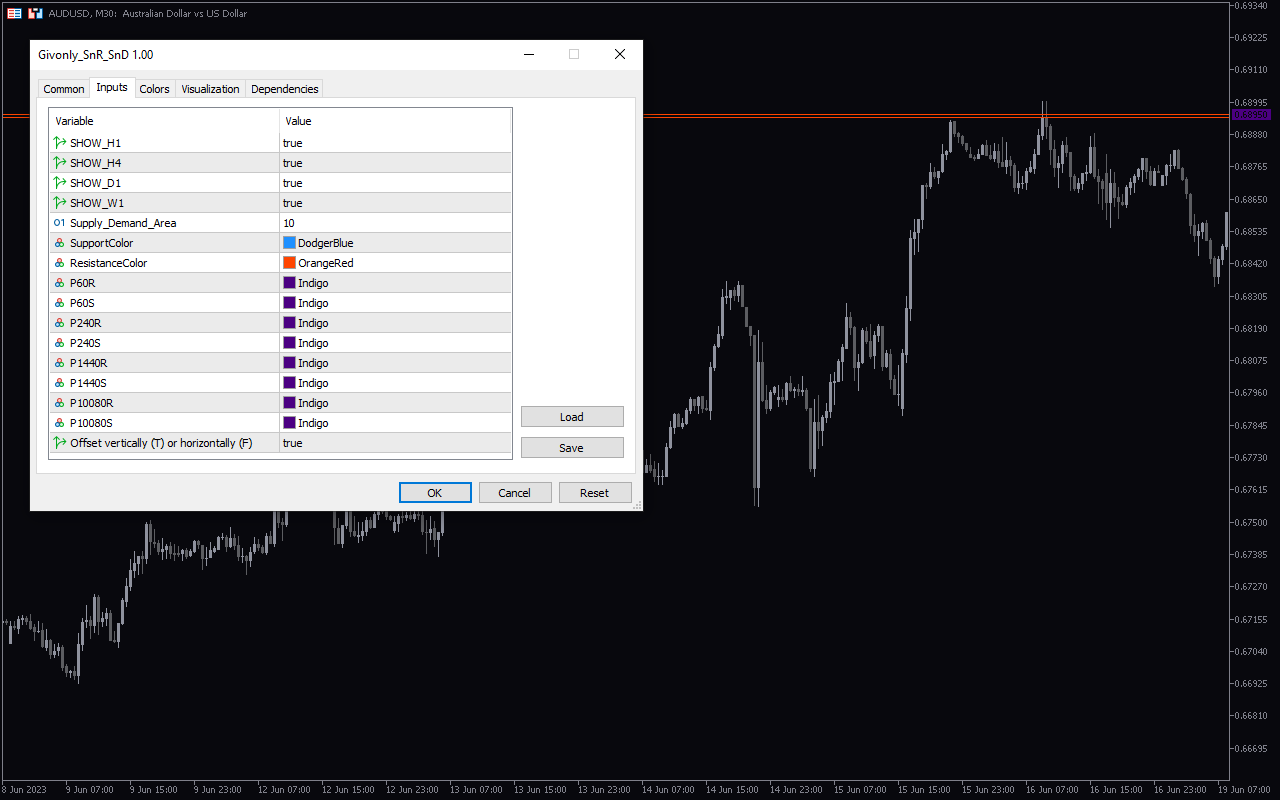
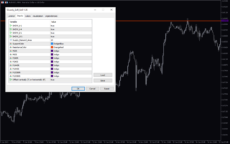
The indicator comes with the following customizable settings:
SHOW_H1: Enables/Disables the H1 support/resistance line.
SHOW_H4: Enables/Disables the H4 support/resistance line.
SHOW_D1: Enables/Disables the D1 support/resistance line.
SHOW_W1: Enables/Disables the W1 support/resistance line.
Supply_Demand_Area: Determines the width of the supply and demand line.
SupportColor: Defines the color to display support levels.
P60R: Resistance level for 1-hour time frame.
P60S: Support level for 1-hour time frame.
P240R: Resistance level for a 4-hour time frame.
P240S: Support level for 4-hour time frame.
P1440R: Resistance level for 1-day time frame.
P1440S: Support level for 1-day time frame.
P10080R: Resistance level for 1-week time frame.
P10080S: Support level for 1-week time frame.
Offset Vertically (T) or Horizontal (F): Determines the indicator’s position vertically or horizontally.

Reviews
There are no reviews yet.