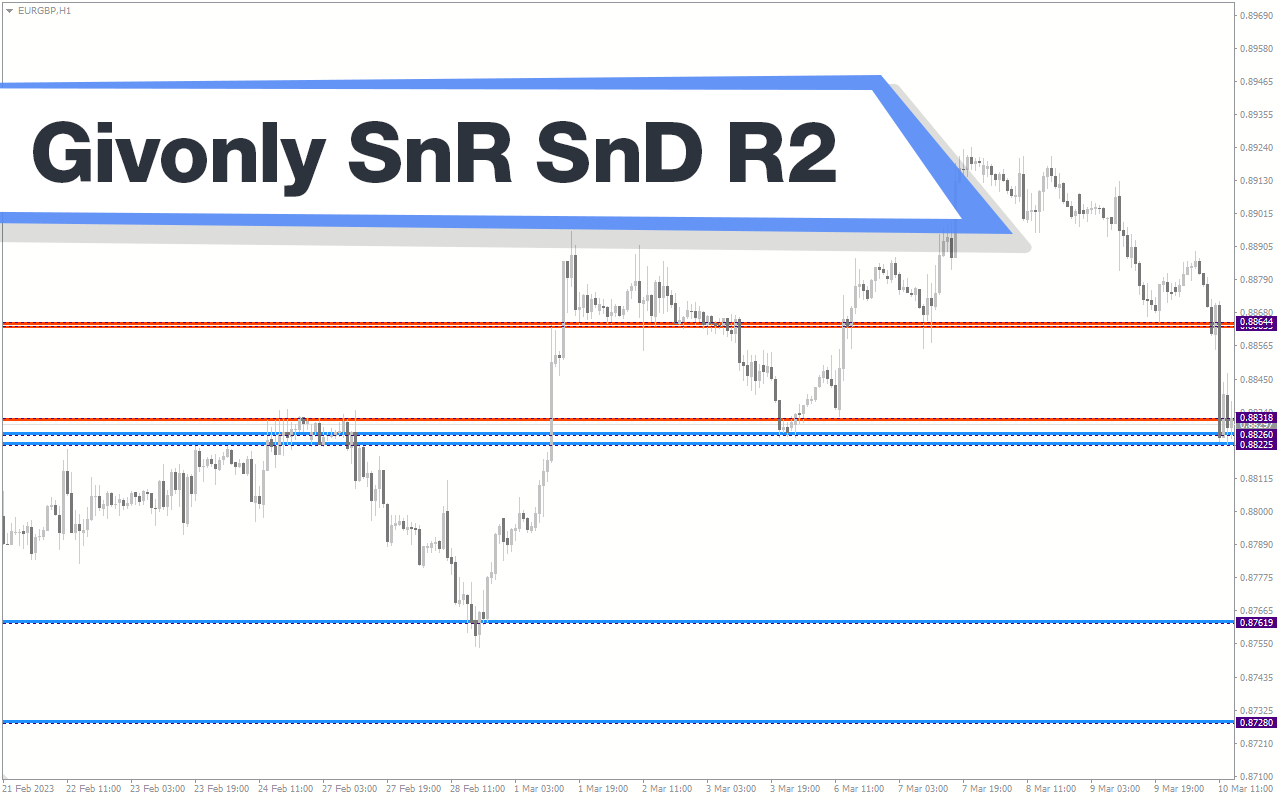
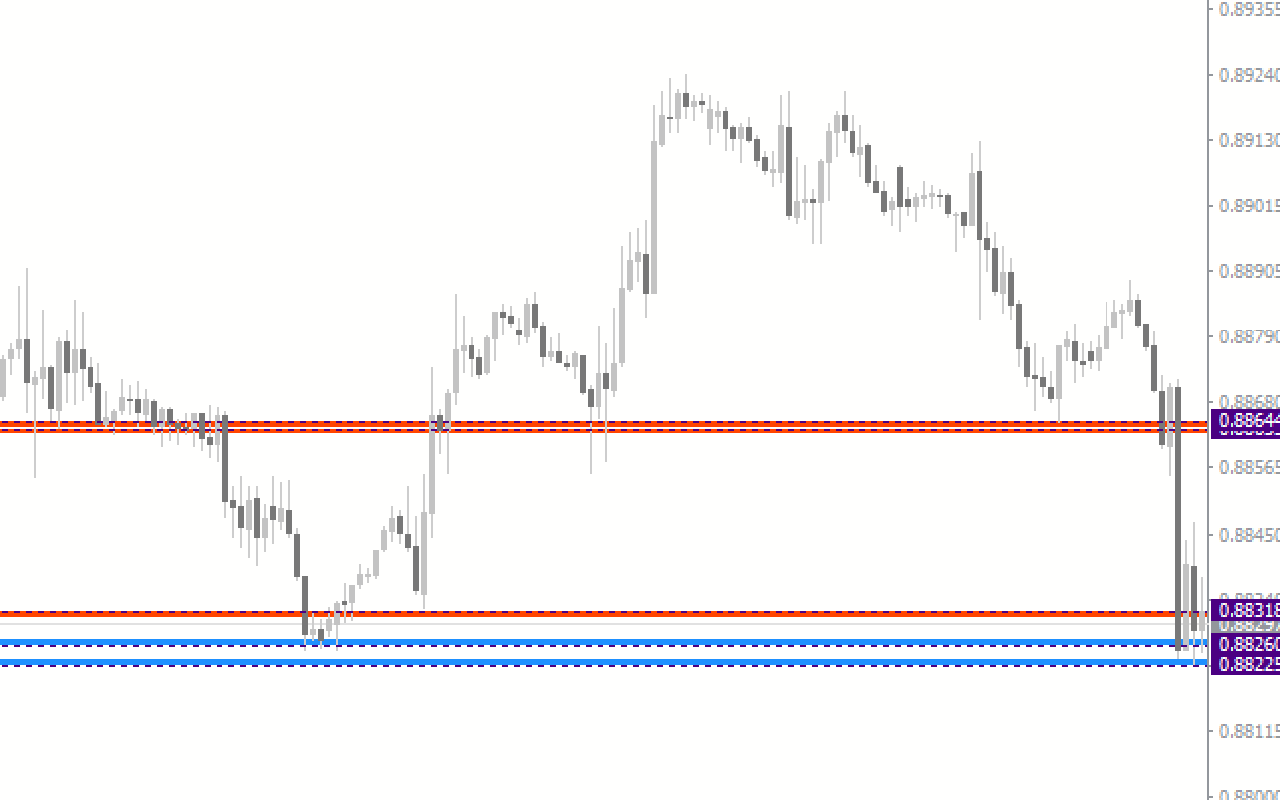
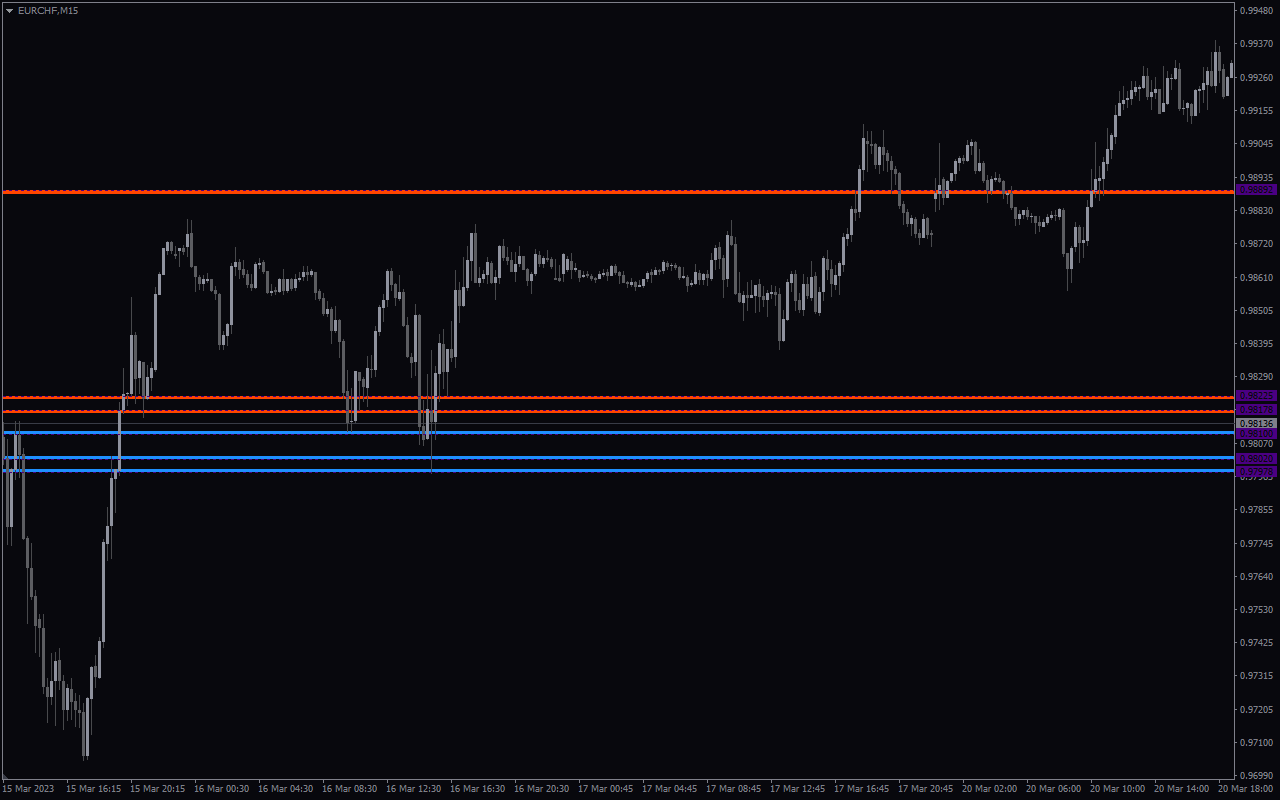
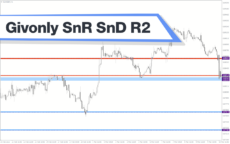
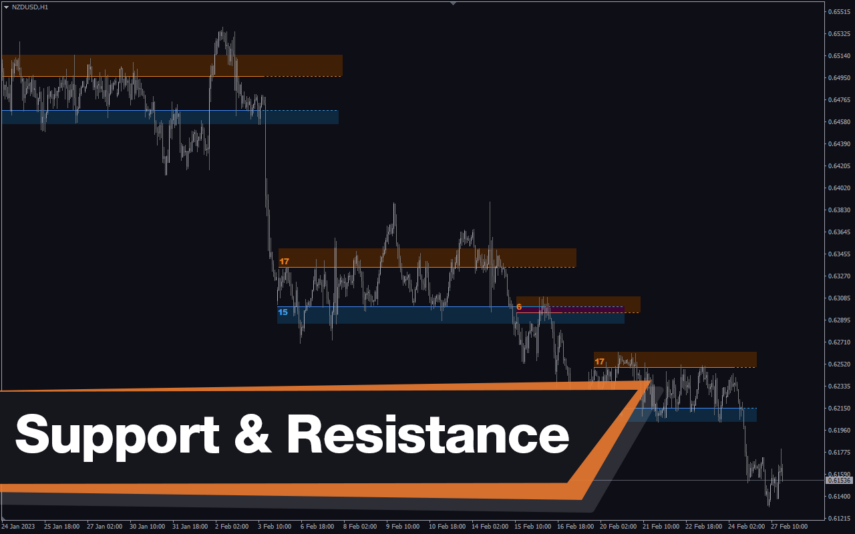
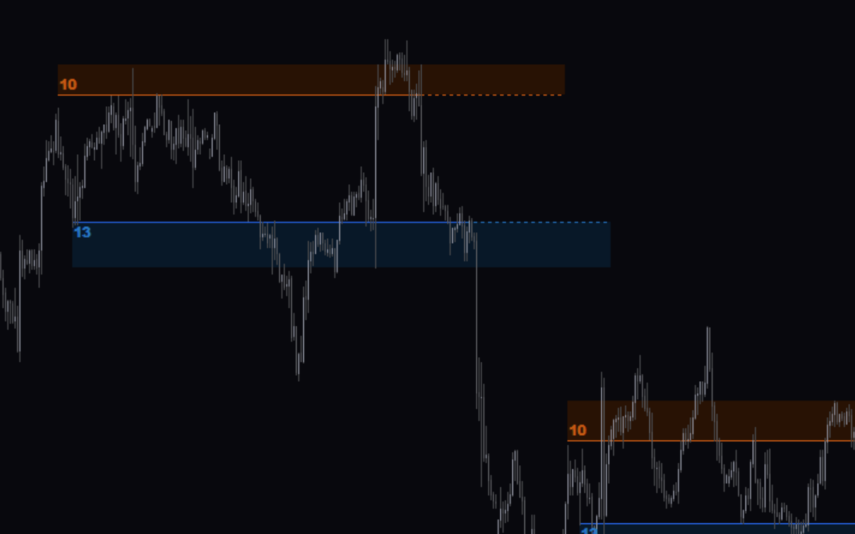
The Givonly SnR SnD R2 indicator for MT4 draws support and resistance lines on the current chart at hourly, daily, and weekly intervals. As a result, the indicator assists forex traders in identifying higher time frame support and resistance levels in lower time frame charts.
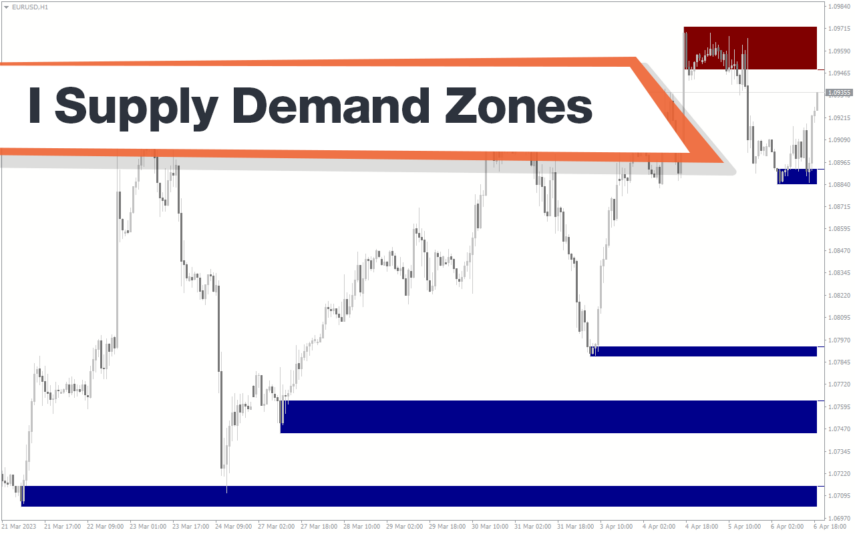
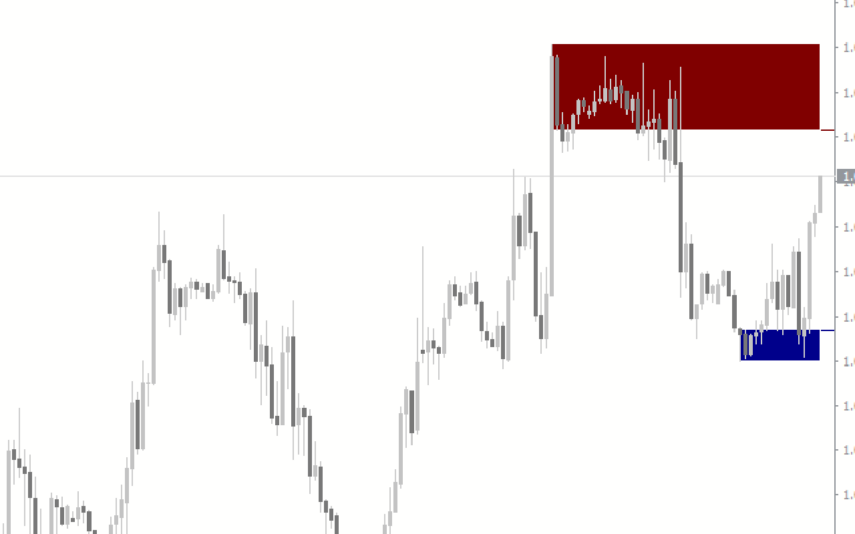
Furthermore, the indicator assists the trader in identifying supply and demand locations. Because supply and demand zones are the finest reversal moments, they offer highly profitable trades with lesser risk. Support and Resistance and Supply and Demand are called Givonly SnR SnD R2.
Features Of The Indicator
Here are some of the features of the Givonly SnR SnD r2 indicator for mt4:
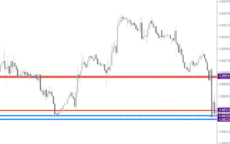
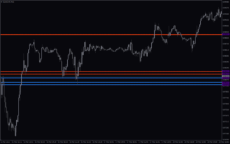
- The indicator plots hourly, daily, and weekly support and resistance levels on the chart that it is currently.
- The indicator identifies supply and demand areas.
- It is a non-repainting indicator;
- You can use the indicator on all currency pairs and time frames.
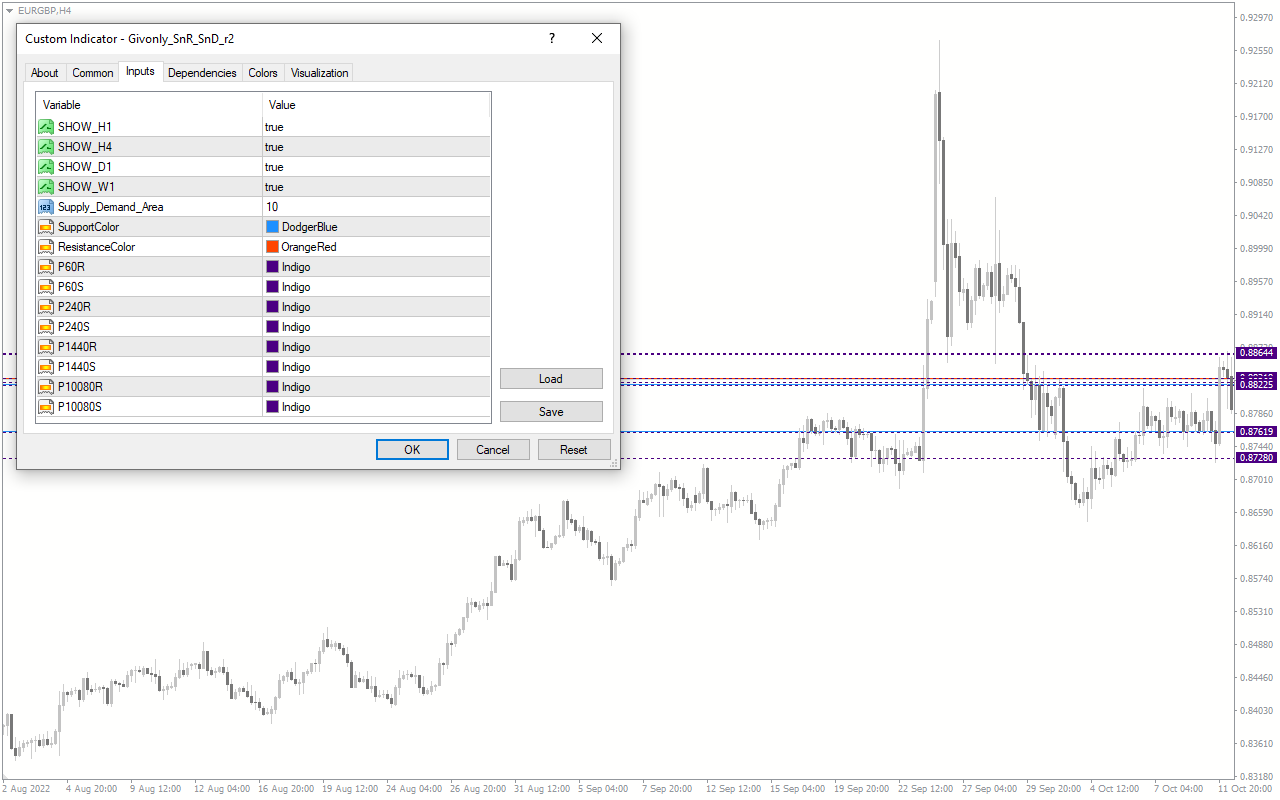
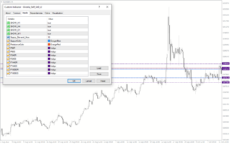
- The indicator has multiple settings that you can customize.
Buy And Sell Entry
For the buy entry, wait for the price to reach a support level. Place a stop loss slightly below the previous swing low. You should place the take profit on the next resistance.
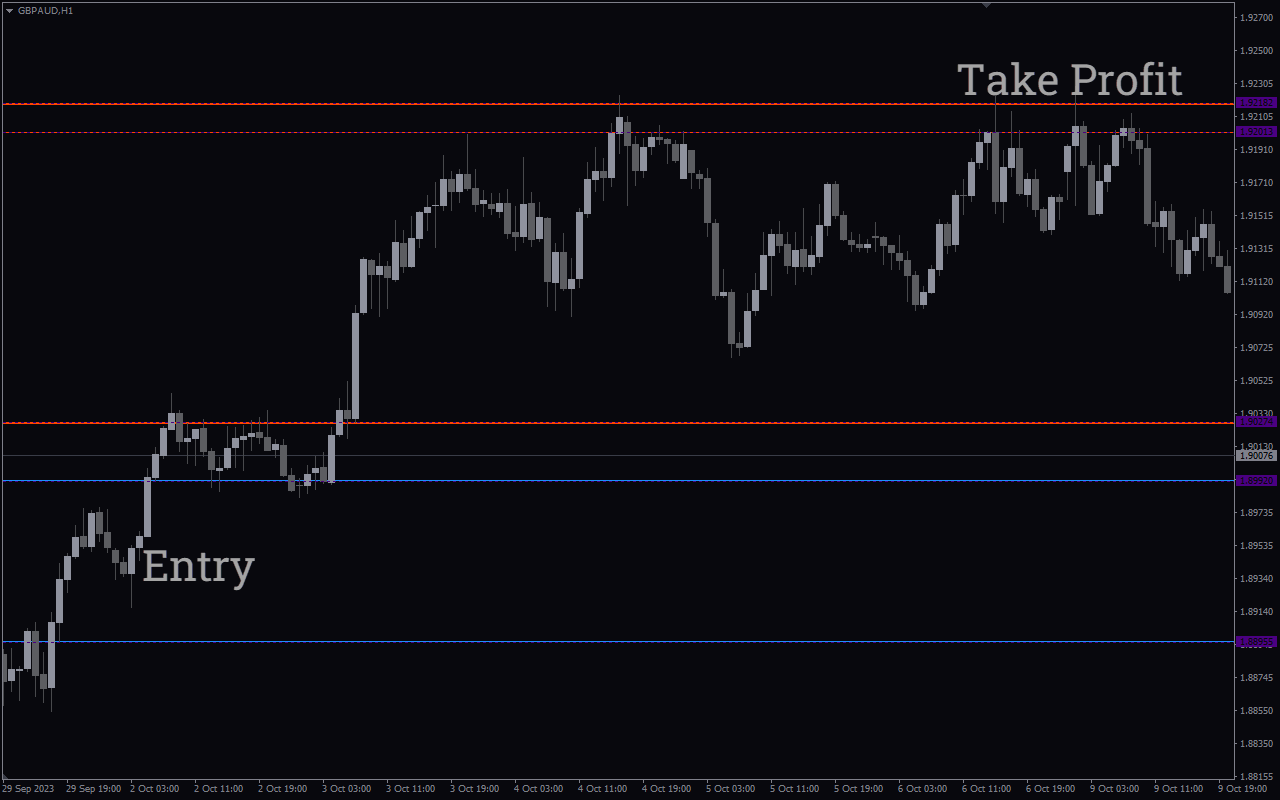
For the sell entry, wait for the price to reach a resistance level. Place a stop loss slightly above the previous swing high. You should place the take profit on the next support.
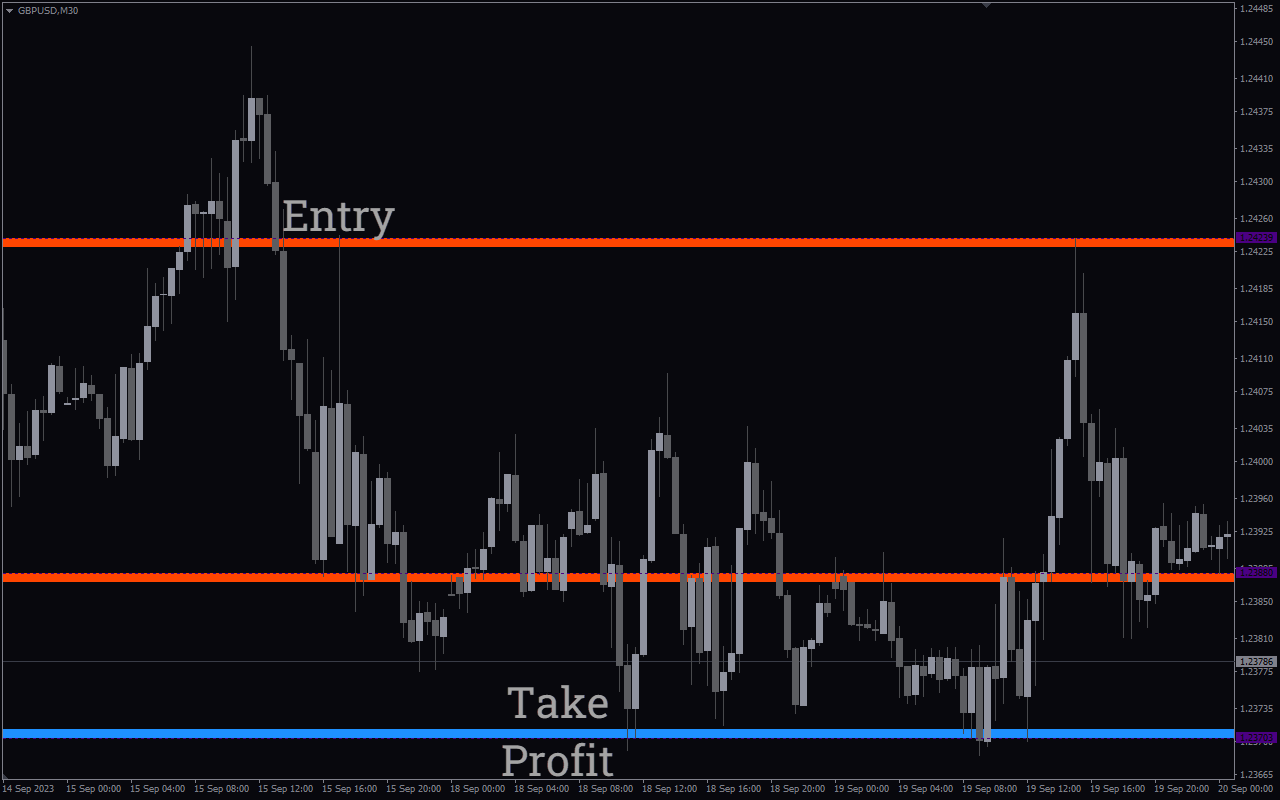
The Givonly SnR SnD r2 indicator for mt4 is an excellent tool for showing support and resistance levels on a chart. These levels can act as trade entry points. You should incorporate this indicator with others when trading for better results.

Reviews
There are no reviews yet.