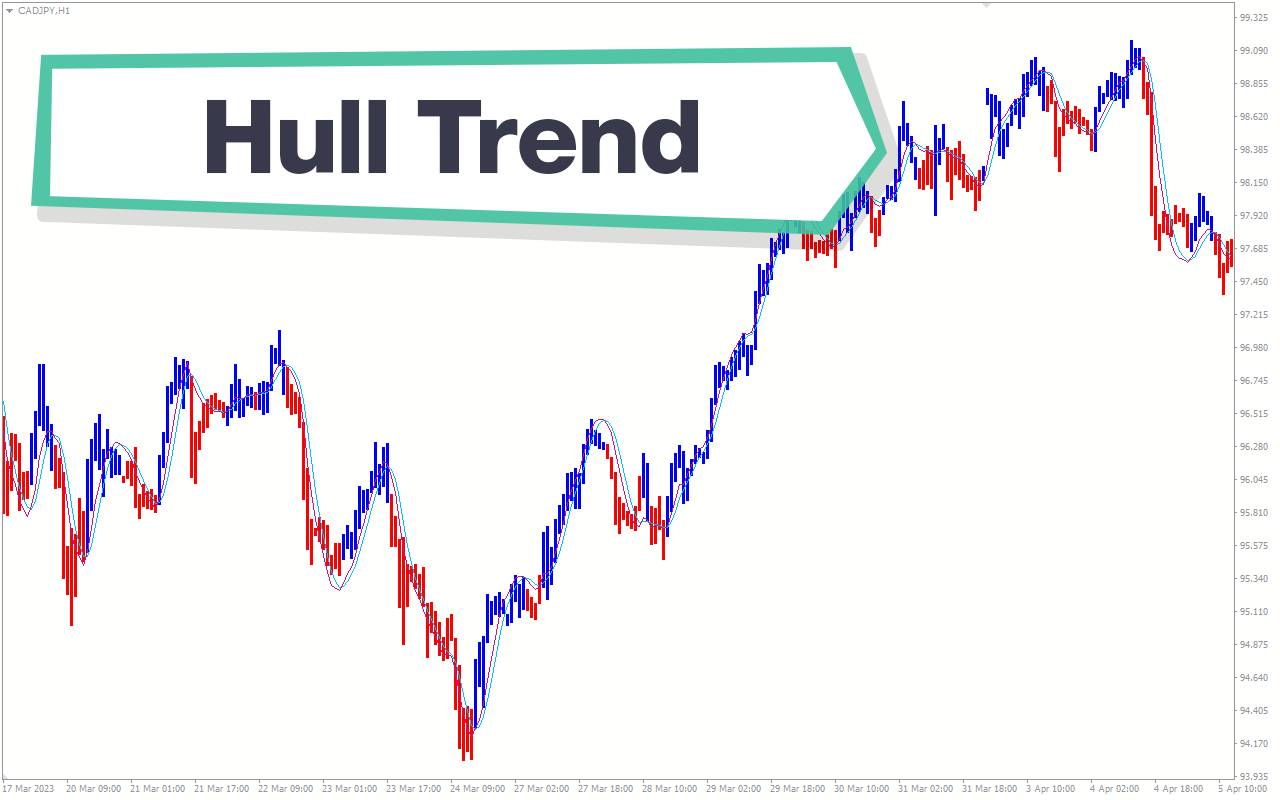
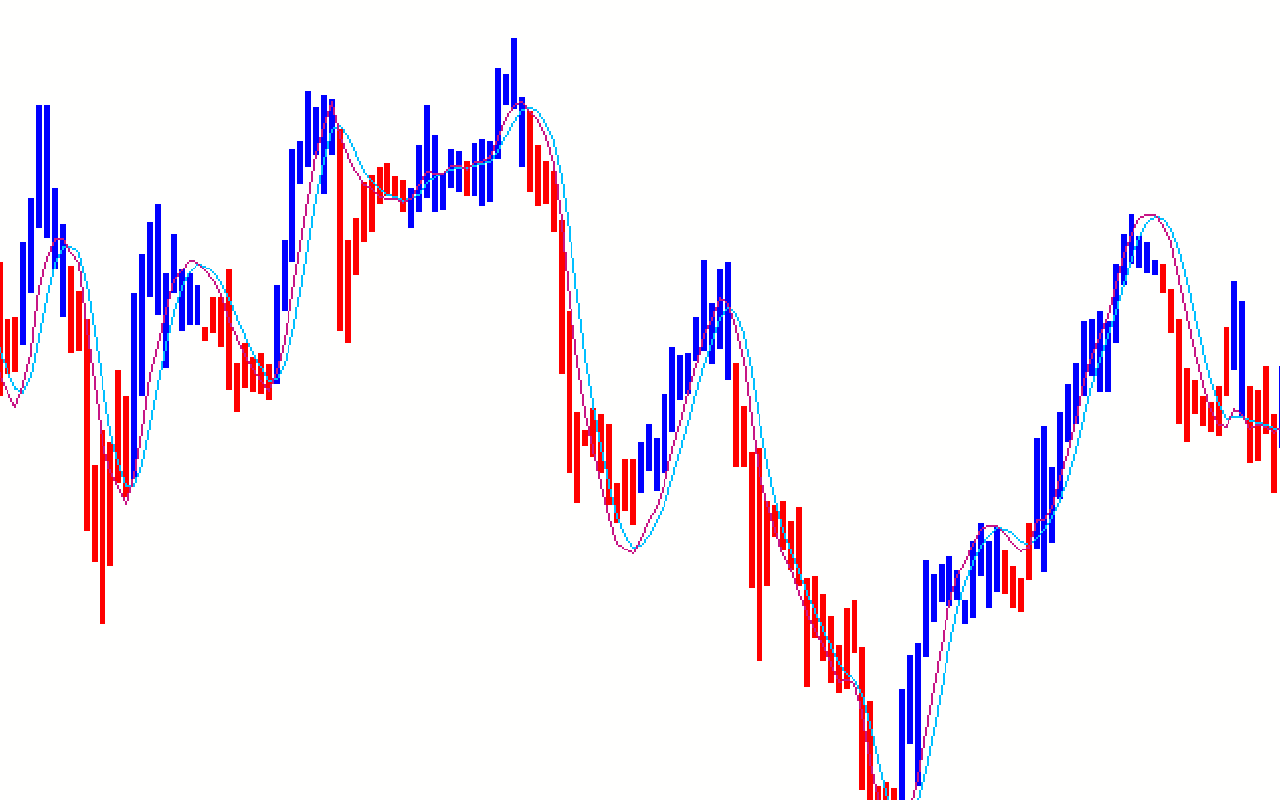
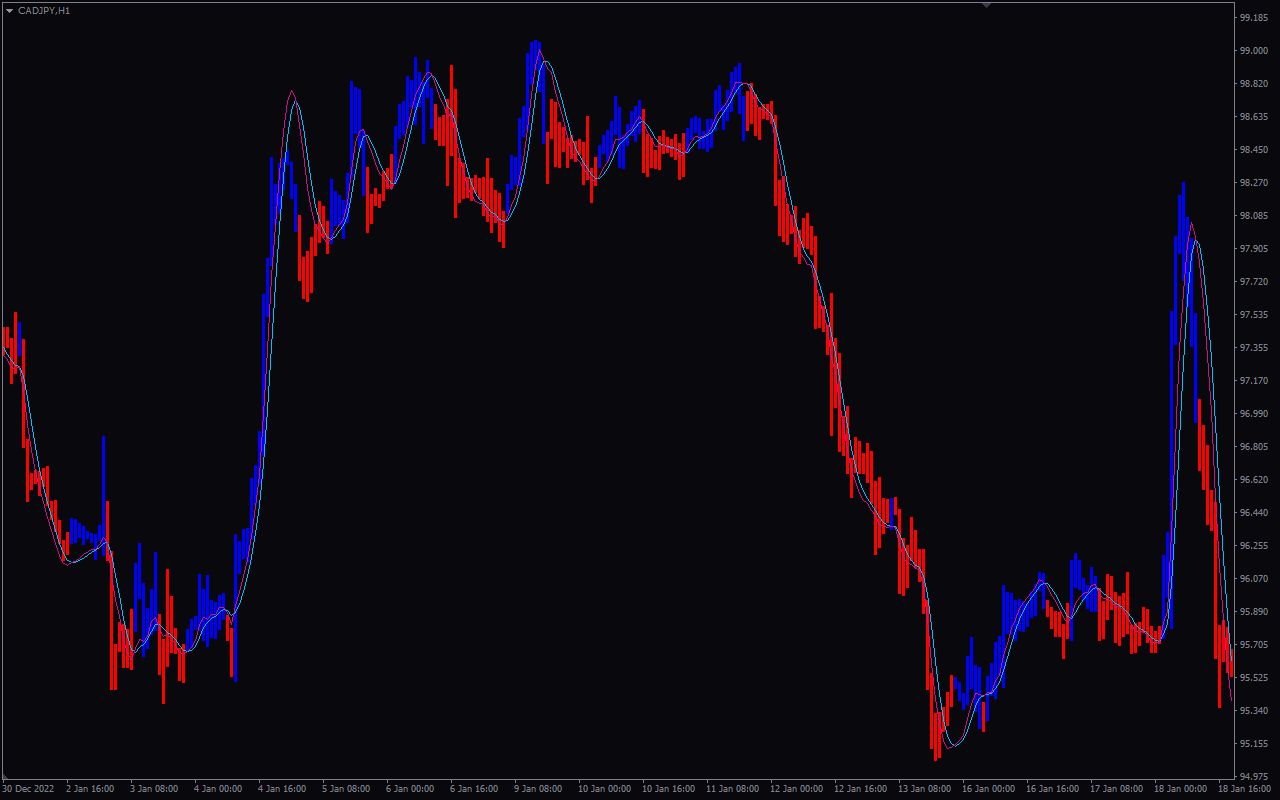
The Hull Trend MT4 indicator calculates the Hull trend using two parameters of High and Low and plots them on the forex price chart. A crossover of the Hull trend high and Hull trend low lines indicate a forex market trend reversal. However, during a trend both lines move in trend direction.
Features of Hull Trend MT4 Indicator
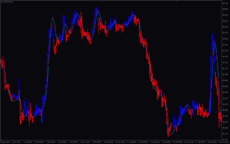
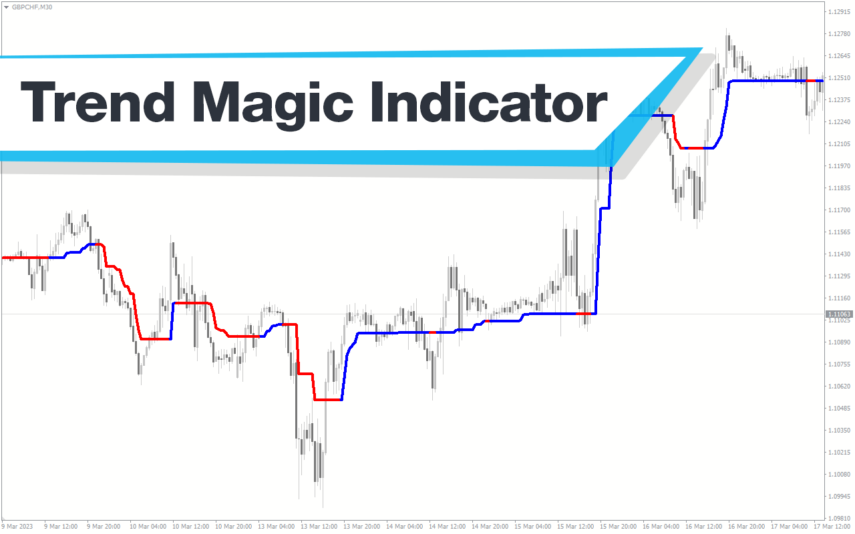
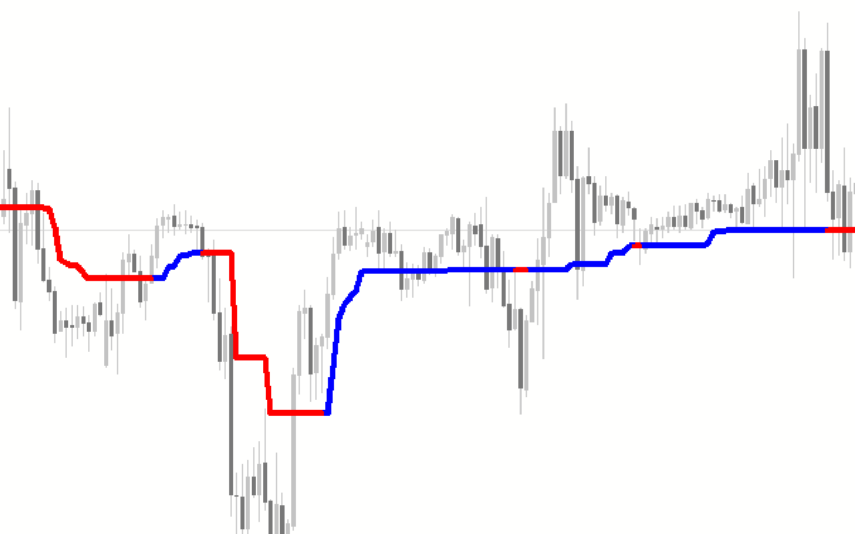
The indicator plots Hull trend high line as red and the Hull trend low as blue. If the Hull trend high is above the Hull trend low line it indicates a bullish market condition. On the other hand, if the Hull trend high is below the low line it is a bearish forex market.
Additionally, the indicator changes the candlestick color to red and blue. In a bullish trend the candles appear blue, and appear red in a bearish market trend. If the Hull trend lines cross each other, it indicates a trend reversal. So, this would be the best entry point for a buy or sell trade.
If the red line crosses the blue line upwards indicating a bullish forex market, traders should open a buy trade. Traders should protect the position with a stop loss below the previous swing low and book profit at an opposite crossover. A similar strategy can be followed in a bearish market with a sell trade.
Benefits of Hull Trend MT4 Indicator
Since the indicator shows the trend direction using the lines, it is easy for new and advanced forex traders to identify the current trend direction. Moreover, this indicator works well in all chart time frames and is effective for all types of forex traders.
In fact, the main benefit is the simplicity of this indicator in displaying the current trend direction and potential trend reversals.
Indicator Settings Description
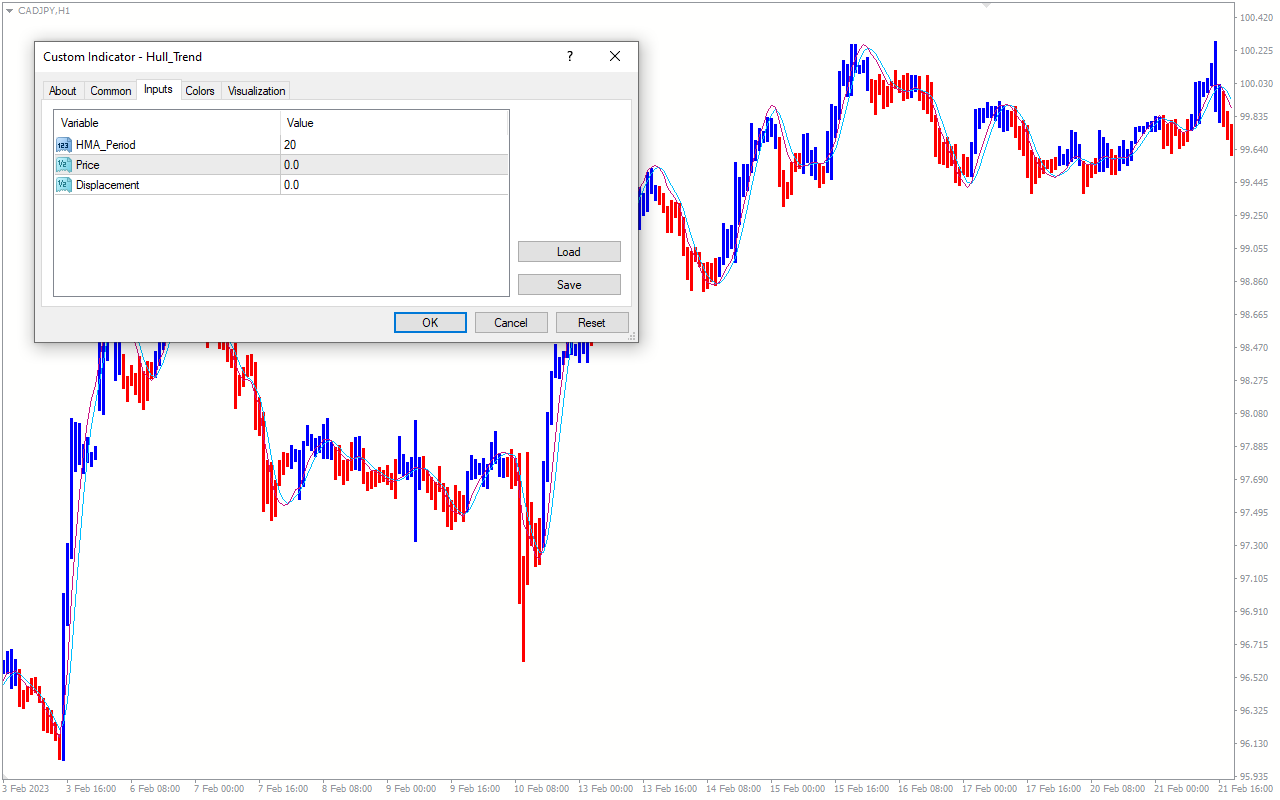
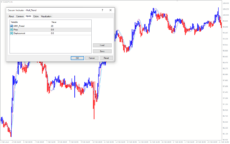
HMA_Period: Period for Hull moving average calculation.
Price: Type of price.
Displacement: Indicator line shift.

Reviews
There are no reviews yet.