Features of the Ichimoku Trend Magic Indicator
The Ichimoku Trend Magic indicator uses part of the traditional Ichimoku Kinko Hyo to show the trend in the market. The indicator picks only the Kijun and Tenkan lines with different periods to show the direction of the price. It is easy to read and can be used by both new and experienced traders on any timeframe.
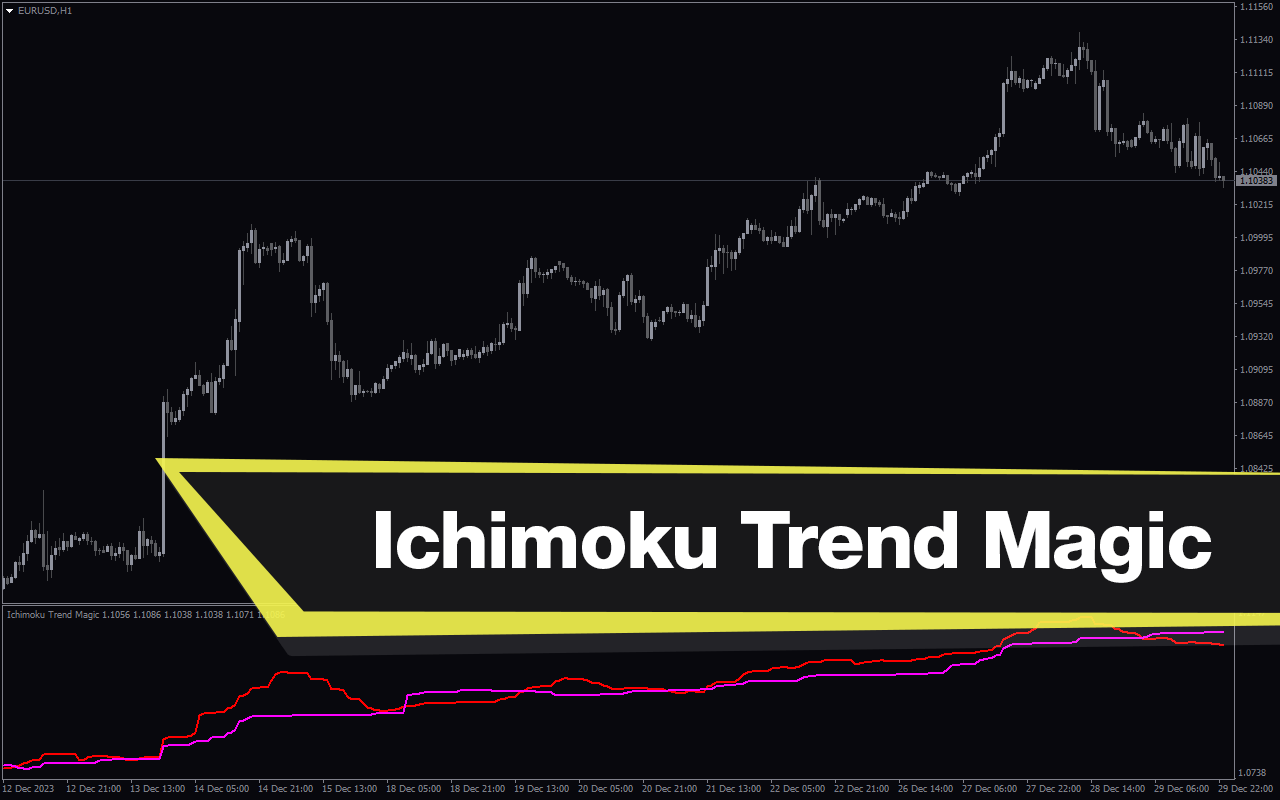
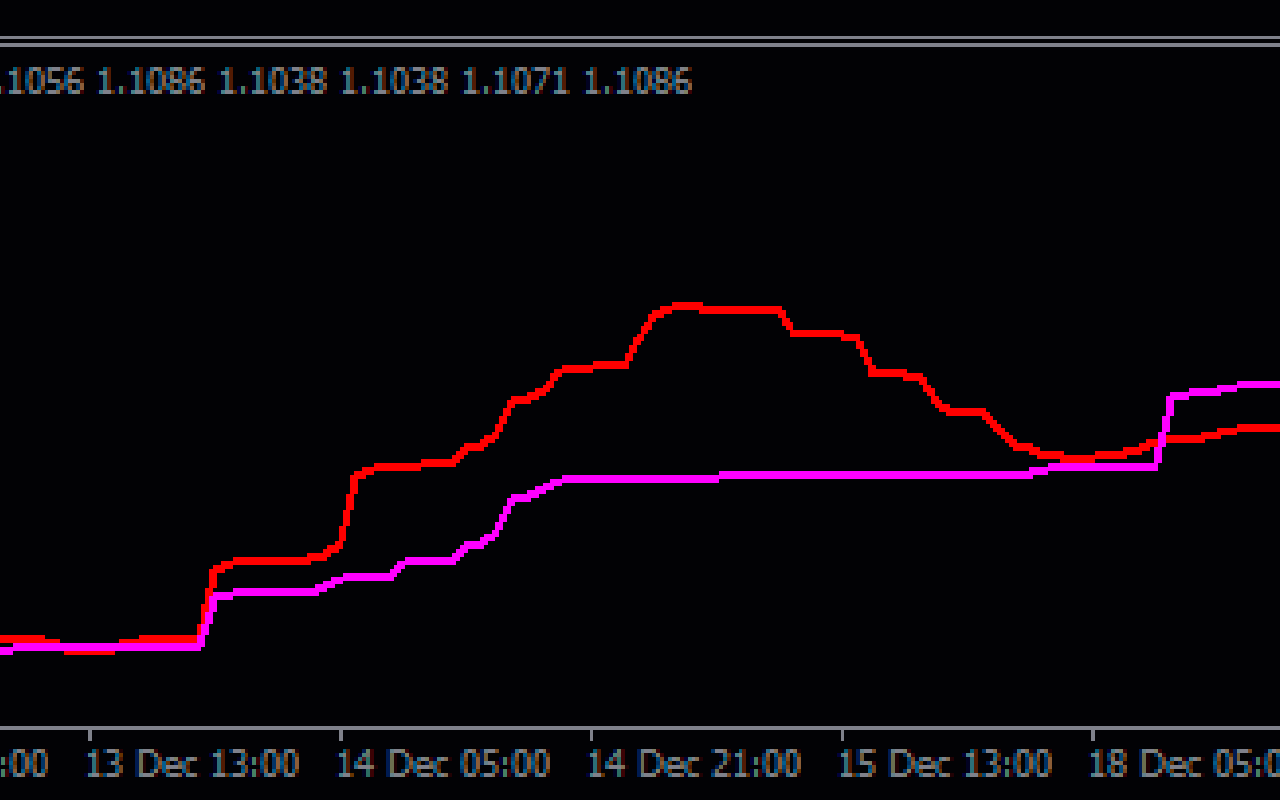
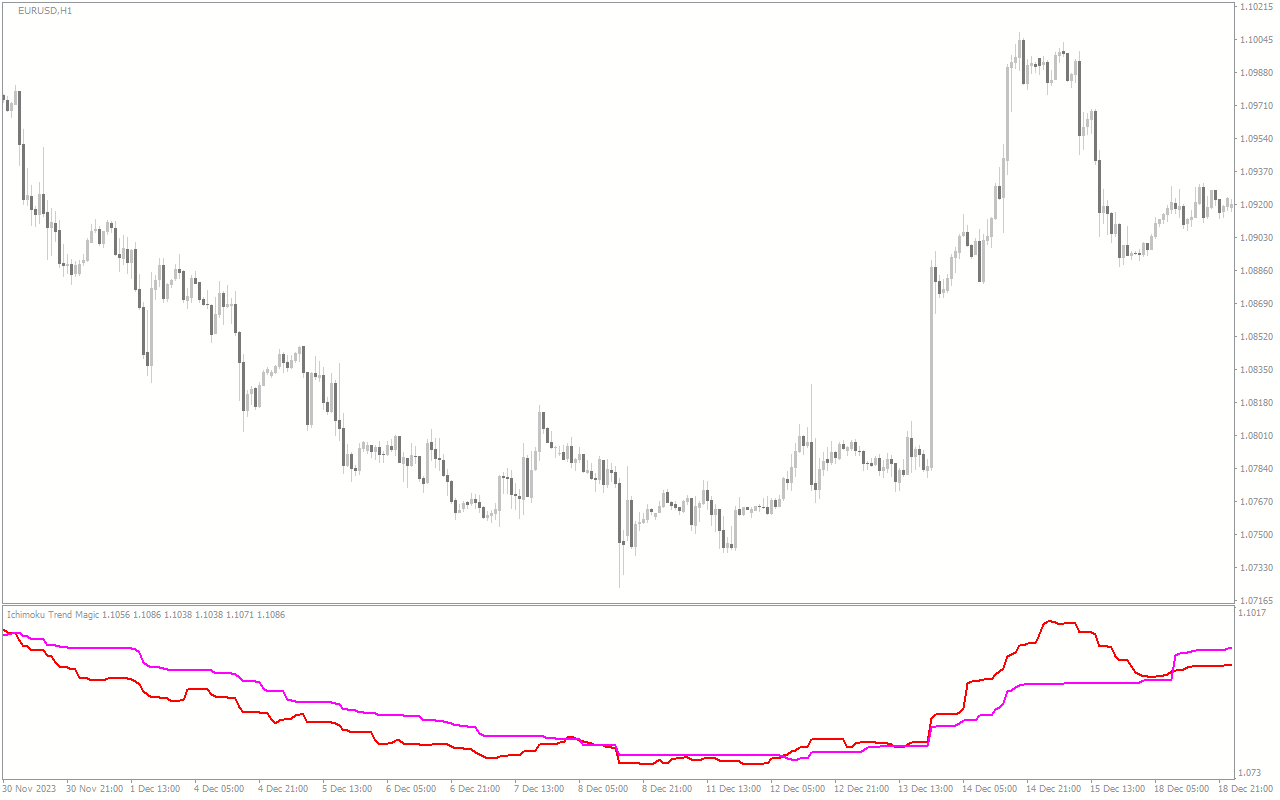
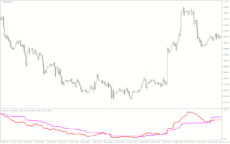
The Tenkan line is red, while the Kijun line is magenta. When the red line crosses below the magenta one, it shows a bearish reversal. Meanwhile, when the red line crosses above the magenta line, it indicates a bullish reversal.
The slope of these lines and the distance between them also determine the strength of the trend. When the distance between the lines is big, it shows a sharp, volatile move. On the other hand, when the distance is small, it shows a shallow trend that could go on for long. Finally, when the lines keep crossing each other, it signals a ranging market.
How the Indicator Can Benefit You
The Ichimoku Trend Magic Indicator is a valuable tool for trend traders. It signals reversals in the price that create great trading opportunities. For a buy signal, wait for the red line to cross above the magenta line. Enter a buy order with your stop loss below the previous low and appropriate targets.
For a sell signal, wait for the red line to cross below the magenta line. Place your sell order with a stop loss above the previous high and appropriate targets.
Indicator Setting Description
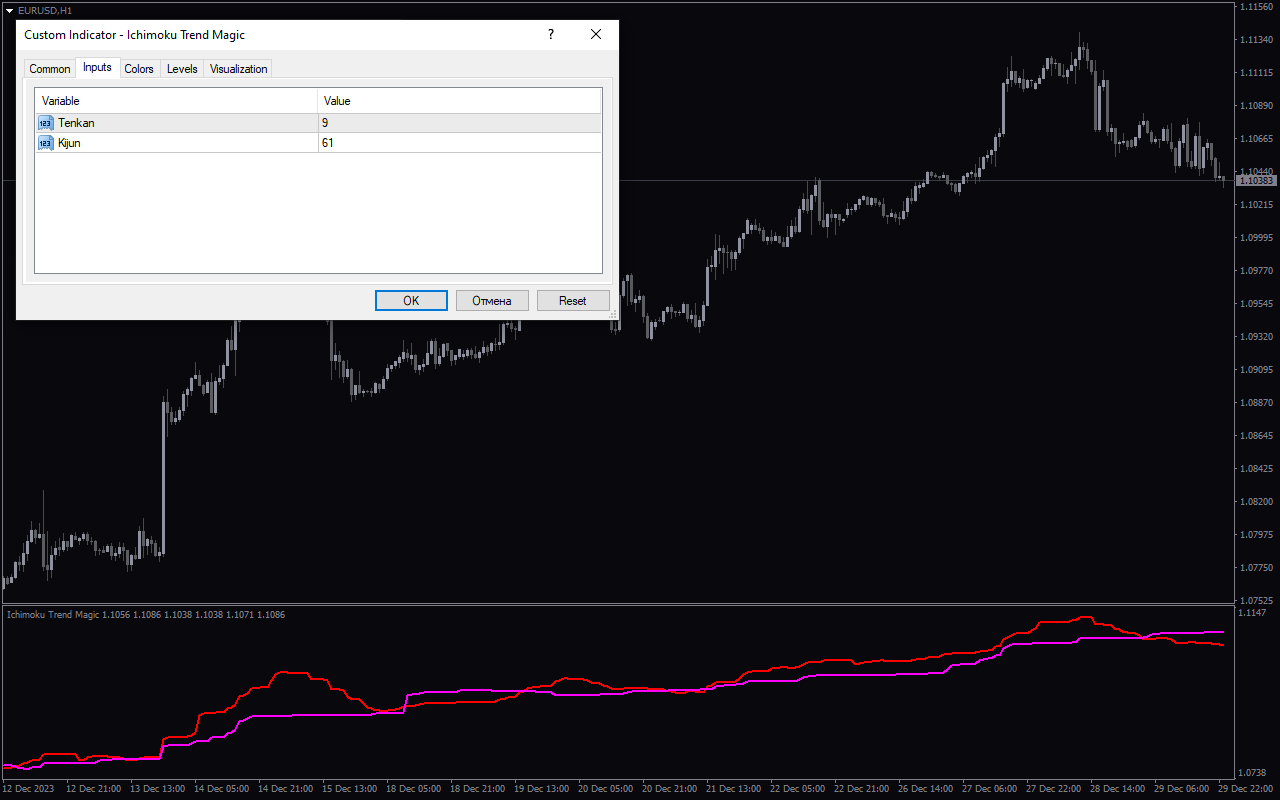
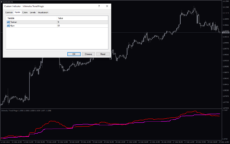
Tenkan: This input allows you to change the period of the turning line.
Kijun: This input allows you to change the period of the base line.

Reviews
There are no reviews yet.