• MT4 Collections
    • Top Indicators Hot
      • Top Rated
      • Top Downloads
      • Most Popular
      • New
      • Recommended
    • Trading Style
      • Beginner For Newbies
      • Scalping
      • Short-Term
      • Day Trading
      • Intraday
      • Swing
    • Indicator Type
      • Accurate
      • Leading
      • Reversal
      • Breakout
      • Sideways
      • Entry & Exit
      • Overbought & Oversold
      • Non-Repaint
    • Categories
      • Trend
      • Signal
      • Support & Resistance
      • Price Action
      • Stochastic
      • Envelope
      • Volume
      • Helpers
    • Timeframes
      • M1-M5
      • M15-M30
      • H1-H4
      • D1-W1
      • Multi Timeframe
    • Platform
      • MT4 Popular
      • MT5
  • Indicators
  • Blog
  • CONTACT US
  • ABOUT US
Menu
Search
Select category
  • Select category
  • Envelope Indicators
  • Helpers
  • Price Action
  • Signal
  • Stochastic
  • Support & Resistance
  • Trend
  • Volume
0 Wishlist
Home Collection Support & Resistance Ii Supdem
DMI Indicator
Back to products
Gap Finder
MT4
Watch video
Click to enlarge

Ii Supdem

II SupDem: MT4 indicator revealing forex supply & demand zones. Identify potential reversals & adjust positions with customizable settings. It is a great tool for both beginner and experienced traders alike and can help them make informed trading decisions.

Trading Style

Swing

Indicator Type

Breakout

Timeframe

D1-W1

,

H1-H4

Platform

MT4

Add to wishlist
0 People watching this product now!
Category: Support & Resistance
Share:

Downloads - 149

Download now
  • Description
  • Reviews (0)
  • How to Install
Description

Features of the Ii SupDem Indicator

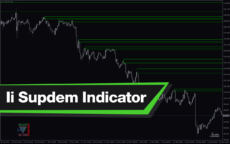
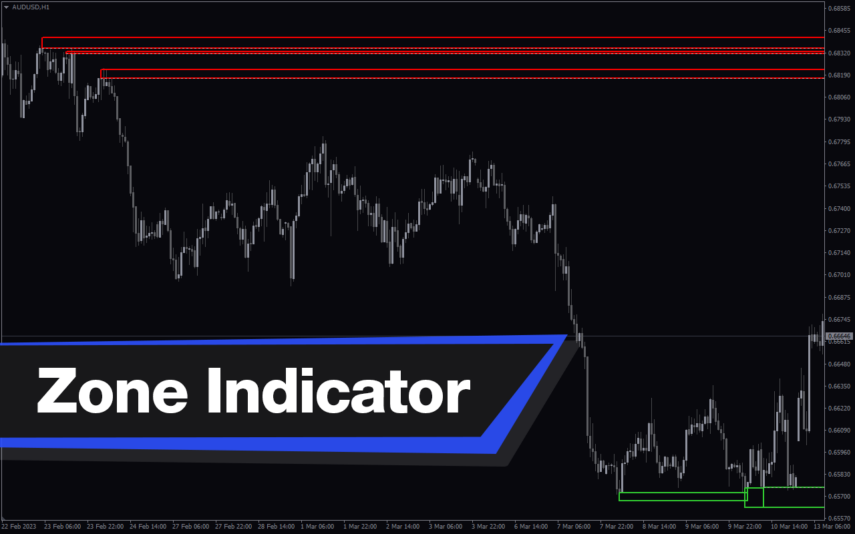
The II SupDem is a straightforward MT4 indicator that lists forex pairs’ supply and demand zones. The abbreviation for supply and demand is SupDem.

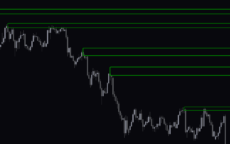
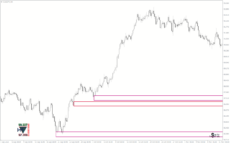
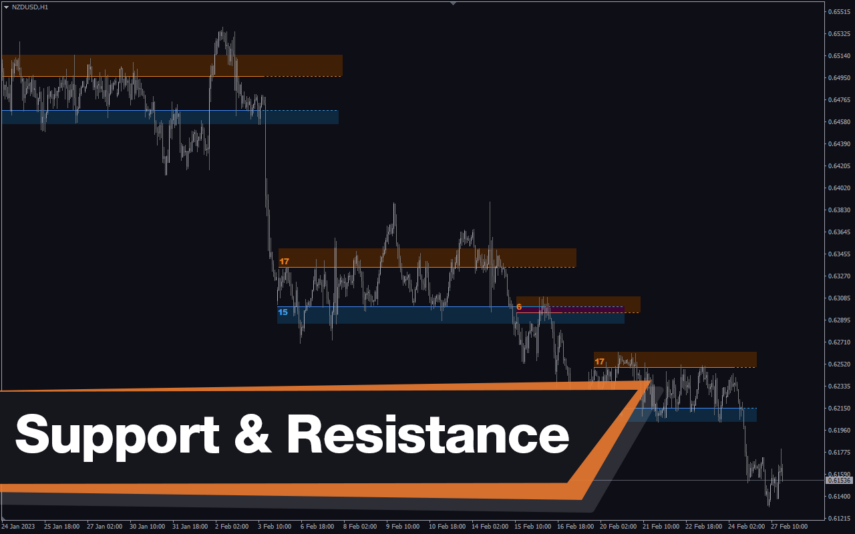
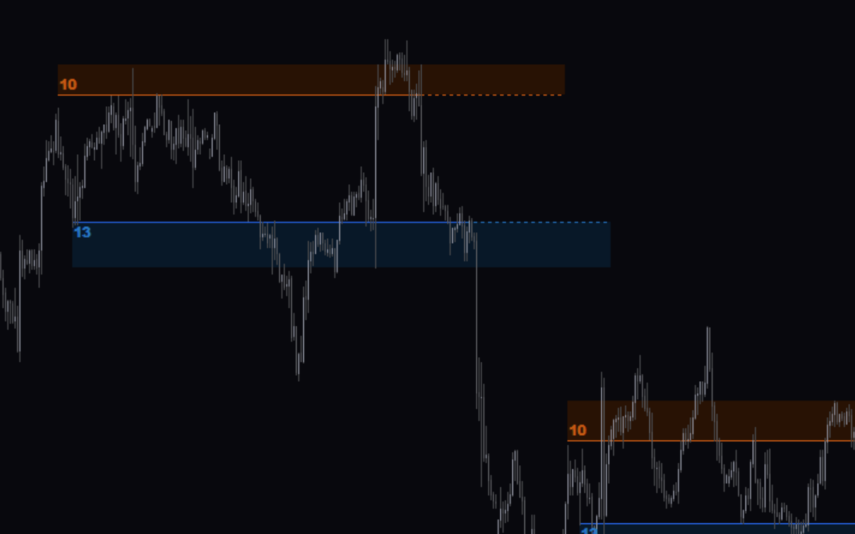
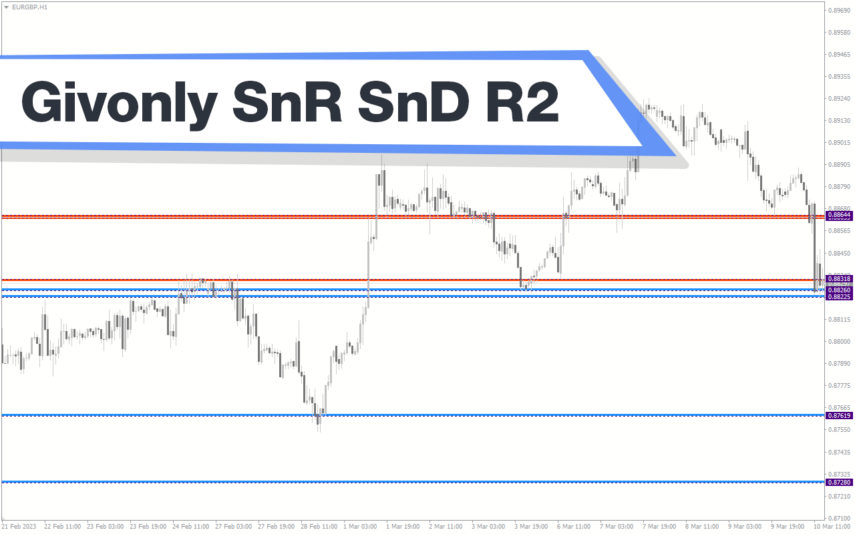
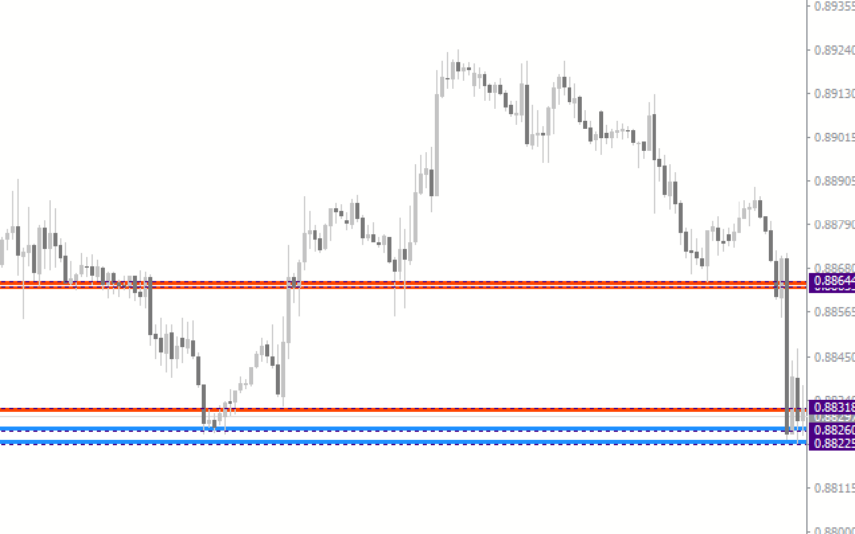
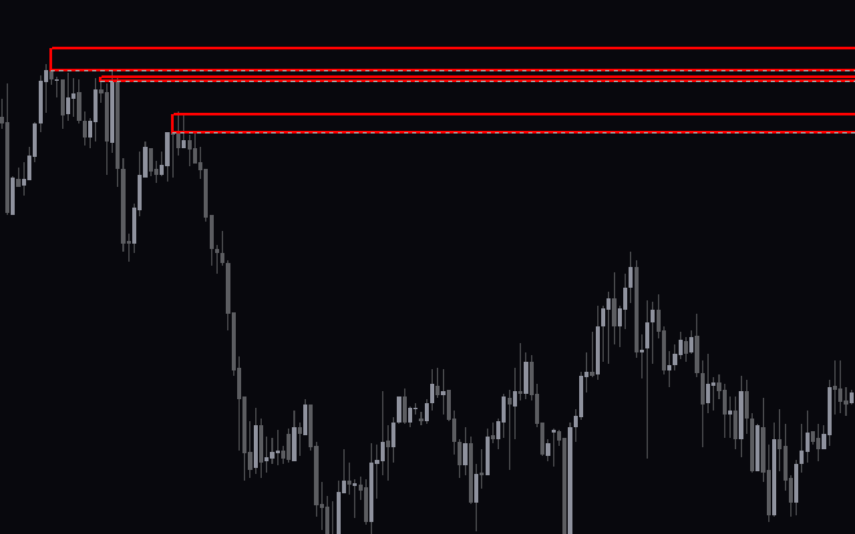
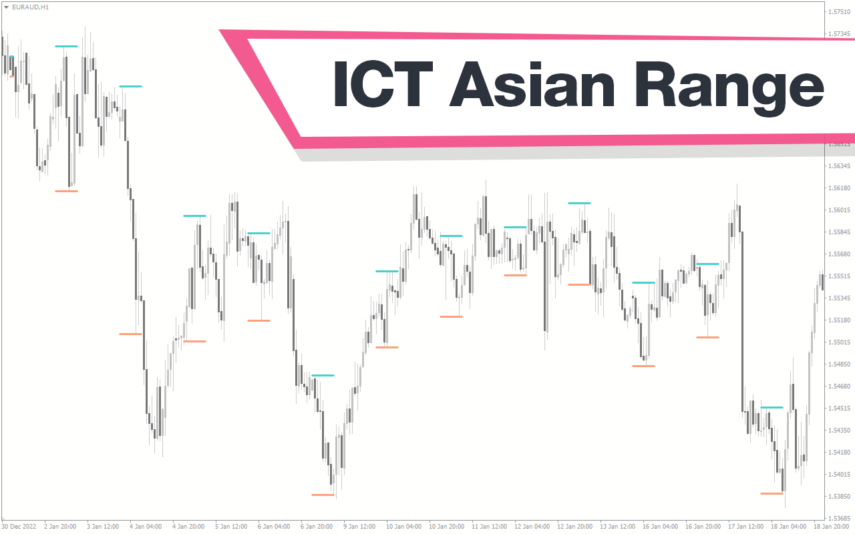
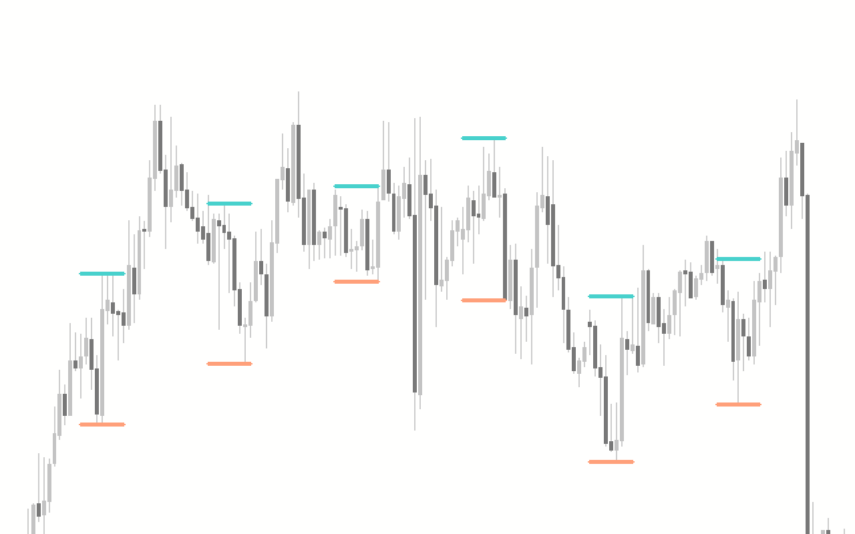
The indicator plots supply and demand zones that represent support and resistance levels. SupDem plots supply and demand zones whenever there is significant volatility or a high trading volume.

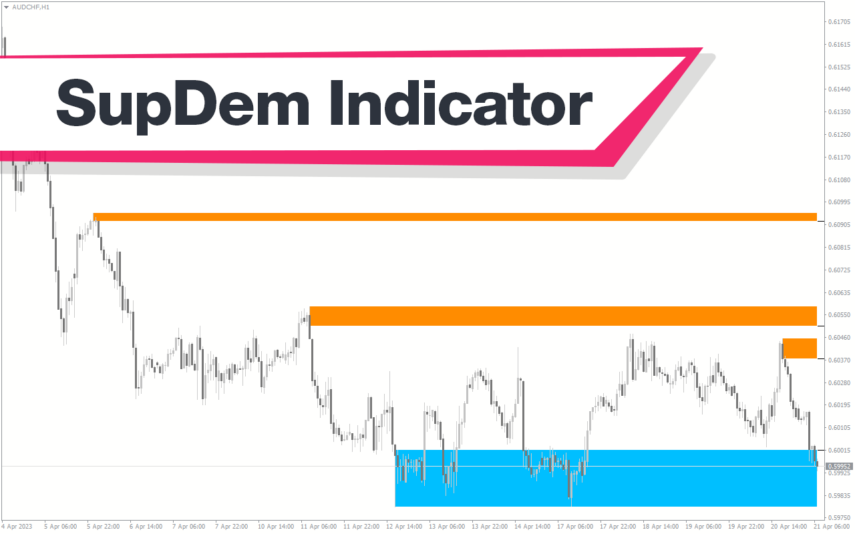
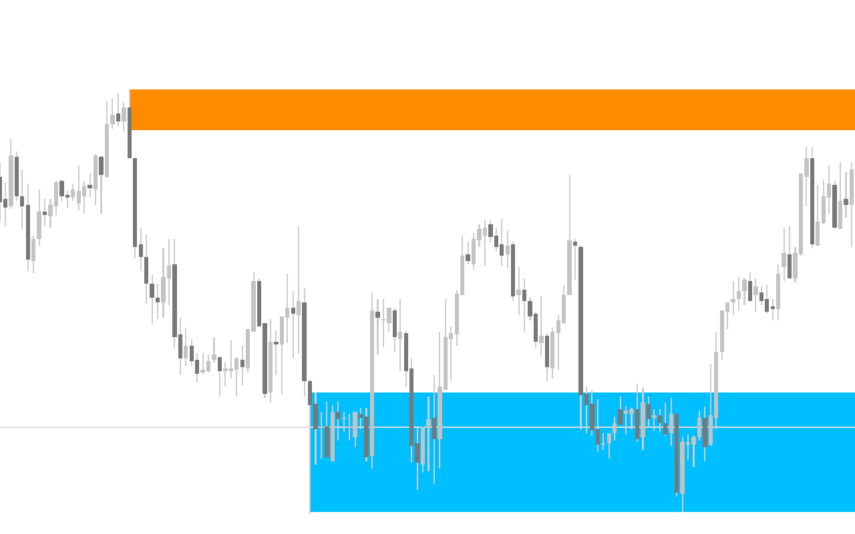
The supply levels are shown in the red zone, while the demand levels appear in the green zone. The indicator shows a potential reversal whenever it charts the zones.

How the Indicator Can Benefit You

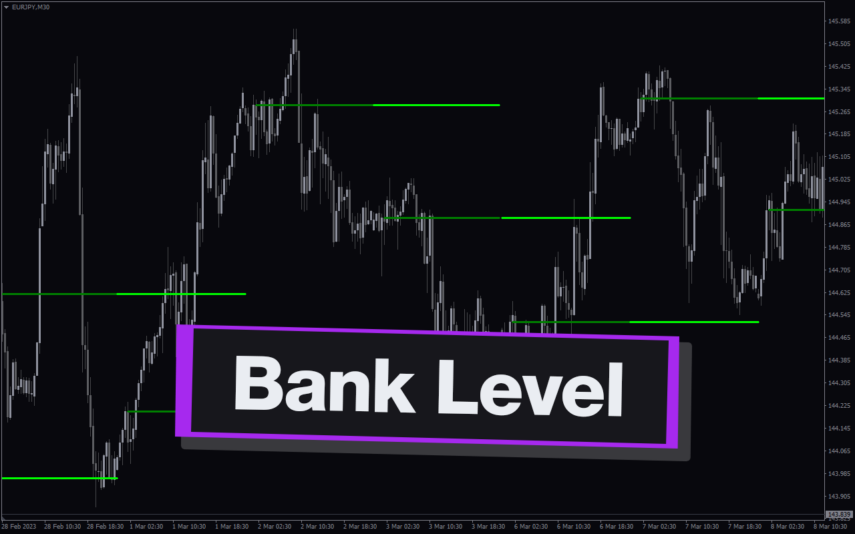
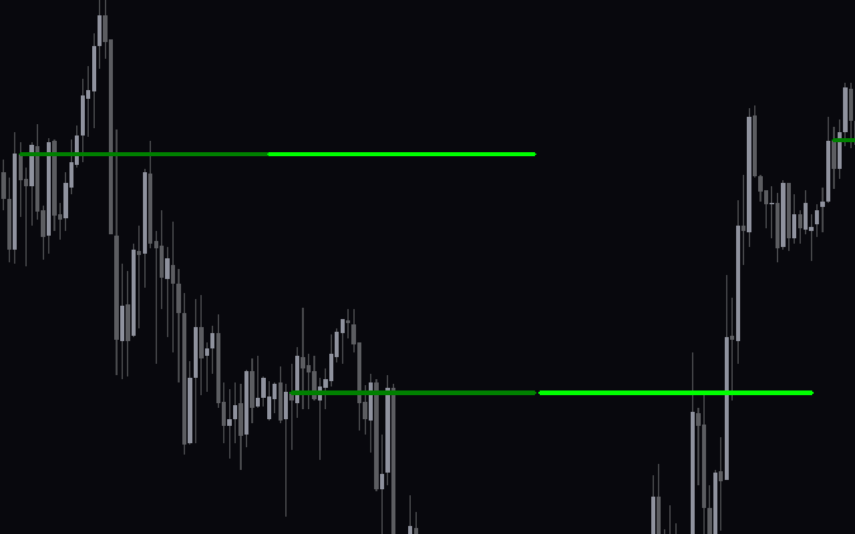
The II SupDem indicator plots supply and demand zones to suggest a potential trend reversal. Traders should go short if the green zone occurs since it indicates the resistance levels. Conversely, traders can initiate long positions if the indicator displays red zones.

One of the advantages of the indicator is that it shows the general sentiment of the market. Therefore, forex traders can benefit from this and adjust their positions accordingly.

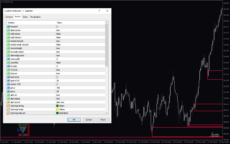
Indicator Setting Description

forced.tf: It allows you to change the period of the indicator.

Draw. zones: Enables/disables the drawing of supply and demand zones.

Solid.zones: Enables/disables the displaying of supply and demand zones in solid.

solid.retouch: Enables/disables the retouching of solid zones.

recolor.retouch: Enables/disables the recoloring of the zones.

recolor.weak.retouch: Enables/disables the recoloring of weak zones.

zone.strength: Enables/disables the showing of the strength of the zones.

no.weak.zones: Enables/disables the showing of weak zones.

draw.edge.price: Enables/disables the mentioning of price edges.

zone.width: It allows you to change the width of zones.

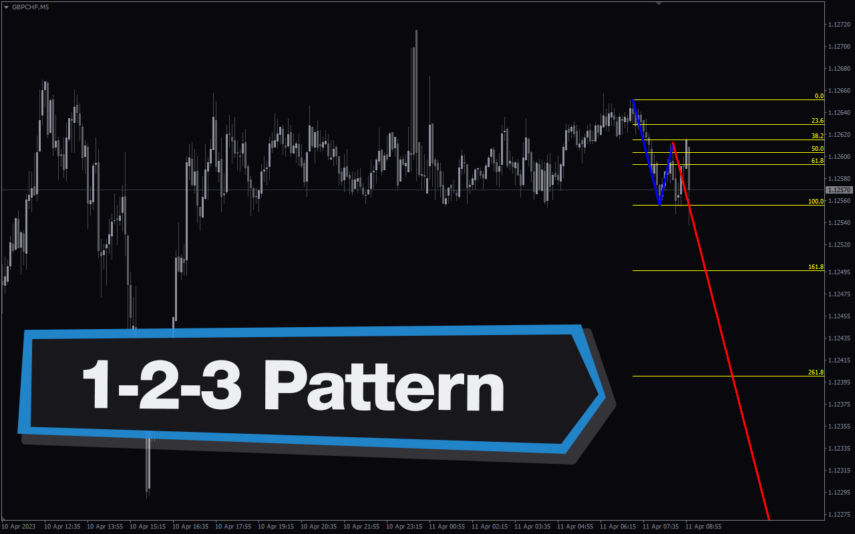
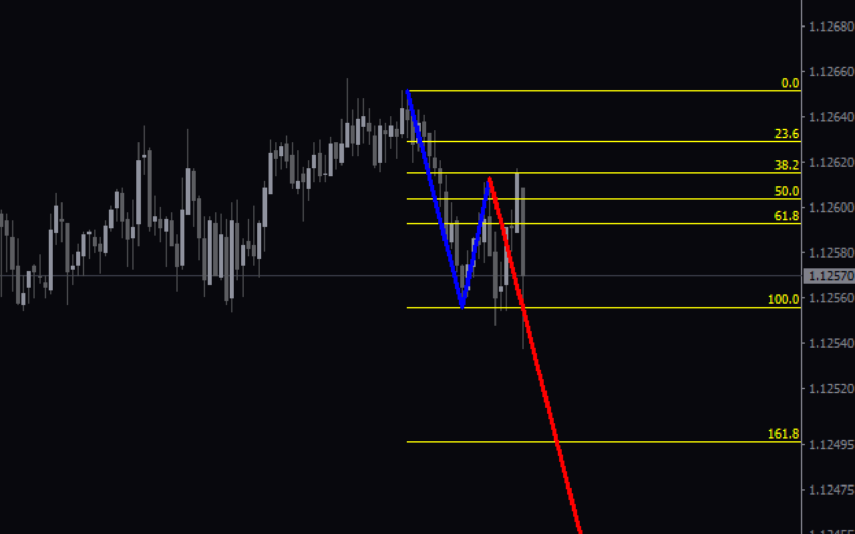
zone.fibs: Enables/disables the drawing of fib levels.

fib.style: It allows you to change the style of fib levels.

HUD.on: Enables/disables the displaying of the strength meter.

Timer.on: Enables/disables the displaying of a timer.

layer.zone: The default value is 0.

layer.HUD: The default value is 20.

corner.HUD: The default value is 2.

pos.x: The default value is 100.

pos.y: The default value is 2.

alert.on: Enables/disables the showing of alerts whenever it creates a zone.

alert.sound: It allows you to change the alert sound.

color. sup. strong: It allows you to change the color of a strong supply zone.

color. sup. weak: It allows you to change the color of a weak supply zone.

color. sup. retouch: It allows you to change the retouch color of the supply zone.

color. dem. strong: It allows you to change the color of a strong demand zone.

color. dem. weak: It allows you to change the color of the weak demand zone.

color. dem. retouch: It allows you to change the retouch color of the demand zone.

color.fib: It describes the fib color.

color.HUD.tf: It allows you to change the color of HUD.

color. arrow. up: It allows you to change the arrow up color.

color. arrow. down: It allows you to change the arrow down color.

color. timer. back: It allows you to change the timer color.

Color.timer.bar: It allows you to change the timer color.

color. Shadow: It allows you to change the shadow color of the arrow.

limit. zone.vis: If set to false, the indicator doesn’t limit its supply and demand zones.

same. tf.vis: If set to true, the indicator fluctuates between zones.

show. on.m1: Shows the indicator on the M1 timeframe.

show. on.m5: Shows the indicator on the M5 timeframe.

show. on.m15: Shows the indicator on the M15 timeframe.

show. on.m30: Shows the indicator on the M30 timeframe.

show. on.h1: Shows the indicator on the H1 timeframe.

show. on.h4: Shows the indicator on the H4 timeframe.

show. on.d1: Shows the indicator on the daily timeframe.

show. on.w1: Shows the indicator on the weekly timeframe.

show. on.mn: Shows the indicator on a monthly timeframe.

Price_Width: The default value is 1. It shows the width of the price.

time. offset: The default value is 0. It mentions the offset time.

globals: If set to false, the indicator doesn’t show global time.

Reviews (0)

Reviews

There are no reviews yet.

Be the first to review “Ii Supdem” Cancel reply

Your email address will not be published. Required fields are marked *

1 2 3 4 5
1 2 3 4 5
1 2 3 4 5

How to Install

How install MT4/5 indicator in the terminal?

To install an MT4/5 indicator in the terminal, follow these steps:

  1. Download the indicator file (.ex4 or .mq4/.ex5 or .mq5) to your computer.

  2. Open the MT4/5 terminal and click on “File” in the top left corner.

  3. Select “Open Data Folder” from the dropdown menu.

  4. In the window that opens, double-click on the “MQL4/5” folder.

  5. Double-click on the “Indicators” folder.

  6. Drag and drop the indicator file from your computer into the “Indicators” folder.

  7. Close the data folder window and restart the MT4/5 terminal.

  8. The indicator should now be available in the “Navigator” window on the left-hand side of the terminal. Simply double-click on the indicator to add it to a chart.

Note: If the indicator is in a .zip file, you will need to extract it first before following the above steps.

And if asks to confirm DLL?

If the indicator you are installing requires access to external Dynamic Link Libraries (DLLs), you may see a pop-up message asking you to confirm the use of DLLs.

DLLs are external libraries that contain code that can be used by other programs. In the case of MT4/5 indicators, they are often used to perform complex calculations or connect to external data sources.

If you trust the source of the indicator and want to use it, click “Yes” to confirm the use of DLLs. If you are not sure or do not trust the source, click “No” to cancel the installation.

It’s worth noting that some indicators may not work properly without access to their required DLLs. If you choose not to allow access to DLLs and the indicator does not work as expected, you may need to reinstall the indicator and confirm the use of DLLs to get it to work properly.


Related products

MT4
Quick view
Add to wishlist

Multi Time Frame Breakout

Trend, Support & Resistance
The Multi-Time Frame Breakout indicator is a new and popular forex indicator that is available for free on the MT4 platform. This indicator helps traders identify breakout points by analyzing multiple timeframes at the same time. It works by plotting support and resistance levels based on the highest and lowest price levels over multiple time frames. This is a valuable tool for traders who use multiple timeframes in their analysis and want to improve their accuracy in identifying potential breakout points.
HotMT4
Quick view
Add to wishlist

Support & Resistance

Support & Resistance
Rated 5.00 out of 5
The Support & Resistance indicator for MT4 is the best support/resistance indicator for trend reversal/continuation detection.
MT4
Quick view
Add to wishlist

1-2-3 Pattern

Trend, Support & Resistance
The 1-2-3 Pattern indicator is a technical trading tool for MT4 that finds the potential end of a trend and the possible new direction. Download for Free! Try now!
MT4
Quick view
Add to wishlist

Givonly SnR SnD R2

Support & Resistance
Identify key support, resistance, and profitable trade moments with Givonly SnR SnD R2 indicator for MT4. Indicator is easy to use and can be used by both beginner and experienced traders alike.
MT4
Quick view
Add to wishlist

Bank Level

Support & Resistance
Elevate Forex Trading with Bank Levels Indicator for MT4 – Key Price Levels, Customizable Alerts, Buy & Sell Signals, Trade Like a Pro!
MT4
Quick view
Add to wishlist

Zone Indicator

Support & Resistance
The Zone Indicator is a popular MT4 Forex trading tool that is new to the market and is available as a free download. This is essential for forex traders who rely on support and resistance strategies, trend traders and traders who want to anticipate price action. The Zone indicator automatically displays strong support or resistance levels on the chart.
MT4
Quick view
Add to wishlist

SupDem

Support & Resistance
The SupDem indicator is a new and popular Forex trading tool that is available for free on MT4. It is designed to determine support and resistance levels by analyzing the supply and demand zones on the chart. The indicator uses color-coded columns to highlight areas of strong support and resistance, allowing traders to easily identify potential trading opportunities. By accurately analyzing supply and demand zones, the SupDem indicator can help traders make more informed trading decisions.
MT4
Quick view
Add to wishlist

ICT Asian Range

Support & Resistance
Are you an ICT forex trader? Do you trade ICT Asian breakout strategy? Download this simple ICT Asian range MT4 indicator and improve your forex trading results. This allows traders to quickly identify support and resistance levels for the Asian session, which is a useful tool for traders looking to trade the Asian session.
    Close
    Indicator Categories
    • Envelope Indicators 303
    • Helpers 405
    • Price Action 165
    • Signal 1110
    • Stochastic 1675
    • Support & Resistance 558
    • Trend 890
    • Volume 145
    • MT4 COLLECTION HOT
      • Top Rated
      • Top Downloads
      • Most Popular
      • New
      • Recommended
    • Trading Style
      • Beginner For Newbies
      • Scalping
      • Short-Term
      • Day Trading
      • Intraday
      • Swing
    • INDICATOR TYPE
      • Accurate
      • Leading
      • Reversal
      • Breakout
      • Sideways
      • Entry & Exit
      • Overbought & Oversold
      • Non-Repaint
    • CATEGORIES
      • Trend
      • Signal
      • Support & Resistance
      • Price Action
      • Stochastic
      • Envelope
      • Volume
      • Helpers
    • Timeframe
      • M1-M5
      • M15-M30
      • H1-H4
      • D1-W1
      • Multi Timeframe
    • Platform
      • MT4 Popular
      • MT5
    • USEFUL LINKs
      • Privacy Policy
      • Cookie Policy
      • Terms of Use
      • Disclaimer
      • About Us
      • Contact Us
    Logo-grayscale-transparent-720
    Unlock your trading potential with our powerful indicator library.

    Follow us:

    MT4COLLECTION.COM © 2024 All Rights Reserved.
    • Menu
    • Categories
    • Signal
    • MT4 Collections
    • Collection
    • Blog
    • About us
    • Contact us
    • Wishlist
    Get Sentiment Indicators with 70% OFF. Only on Black Friday! View Offer Only till DEC, 2
    Sidebar
    We use cookies to improve your experience on our website. By browsing this website, you agree to our use of cookies.
    Accept