

The KG Fibonacci MA Indicator is a popular and free Forex indicator that is highly useful for traders. It is a MetaTrader 4 (MT4) indicator that is based on the Fibonacci sequence. The indicator works by plotting two moving averages on the chart. The first is a fast moving average and the second is a slow moving average. The fast moving average is used to identify short-term price movements while the slow moving average is used to identify long-term price movements. The indicator is designed to help traders identify potential entry and exit points in the Forex market. It does this by plotting the two moving averages in relation to each other. If the fast moving average crosses above the slow moving average, it is generally seen as a signal to buy. Conversely, if the fast moving average crosses below the slow moving average, it is generally seen as a signal to sell. The KG Fibonacci MA Indicator is a great tool for traders who want to take advantage of short-term price movements. It is easy to use and can be quickly implemented into any trading strategy. The indicator is also free and can be downloaded directly from the MetaTrader 4 platform. This makes it an ideal choice for traders who are looking for a useful and popular Forex indicator that is also free.
MT4


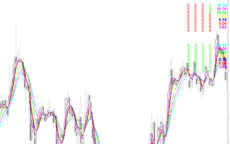
KG Fibonacci MA
The KG Fibonacci MA Indicator is a useful and popular free Forex indicator for MT4. It works by plotting two Moving Averages on the chart, one based on a Fibonacci sequence and the other based on the price action. When the price action crosses above or below the Fibonacci Moving Average, it indicates a potential entry or exit point in the market. The indicator also displays support and resistance levels, which can be used to identify potential areas of reversal. The KG Fibonacci MA Indicator is a great tool for any trader looking to improve their trading strategy and identify potential entry and exit points in the market.
| Trading Style | , |
|---|---|
| Indicator Type | |
| Timeframe | |
| Platform |
0
People watching this product now!
Downloads - 39
Description
Reviews (0)
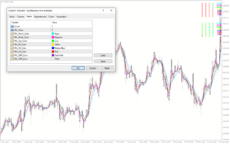
How to Install
Related products
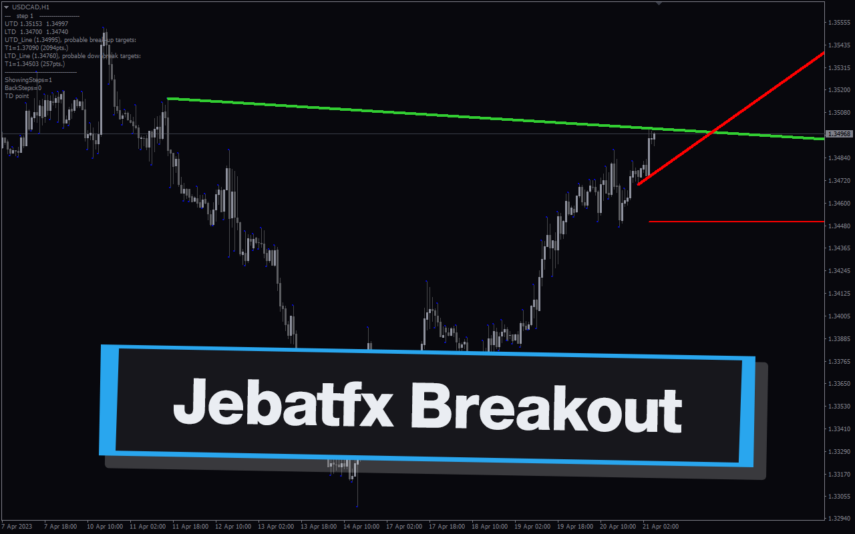
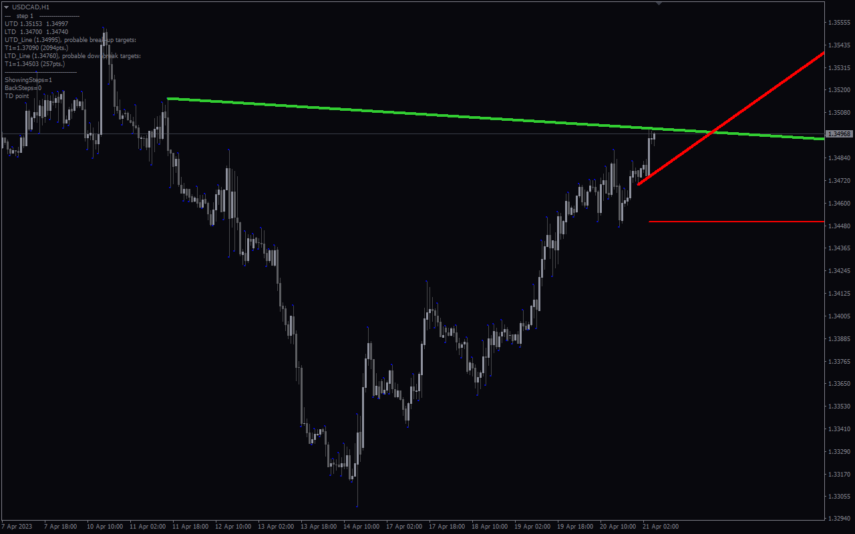
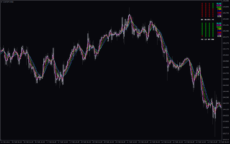
Jebatfx Breakout Trendline
The JebatFX Breakout Trendline Indicator is a new and popular forex indicator available for free on the MT4 platform. It is designed to identify breakout trendline opportunities by plotting trendlines and highlighting breakout signals. The indicator uses complex algorithms to analyze price movements and identify key support and resistance levels to generate trading signals. The JebatFX Breakout Trendline Indicator is user-friendly and easy to use, making it suitable for both novice and experienced traders.
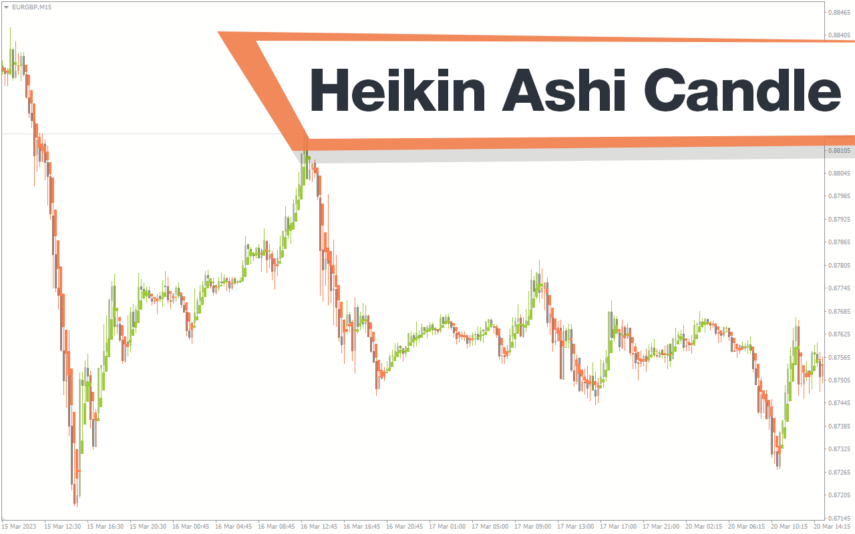
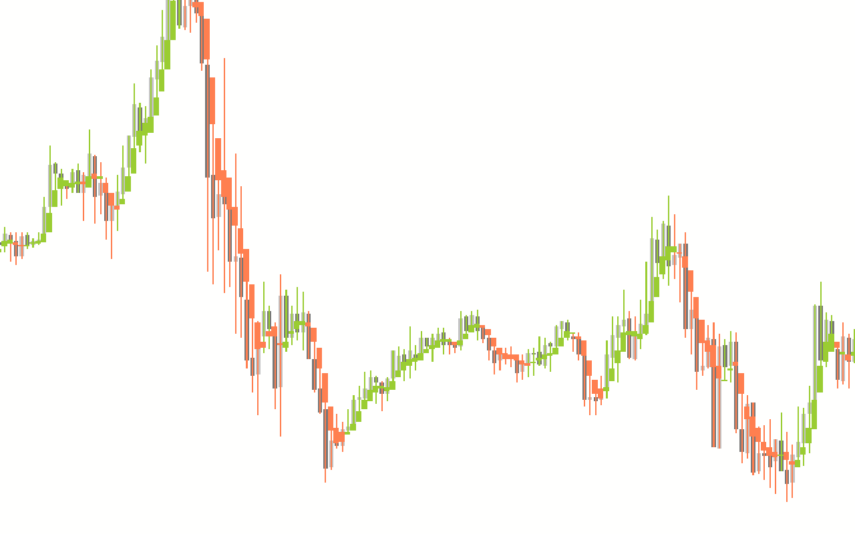
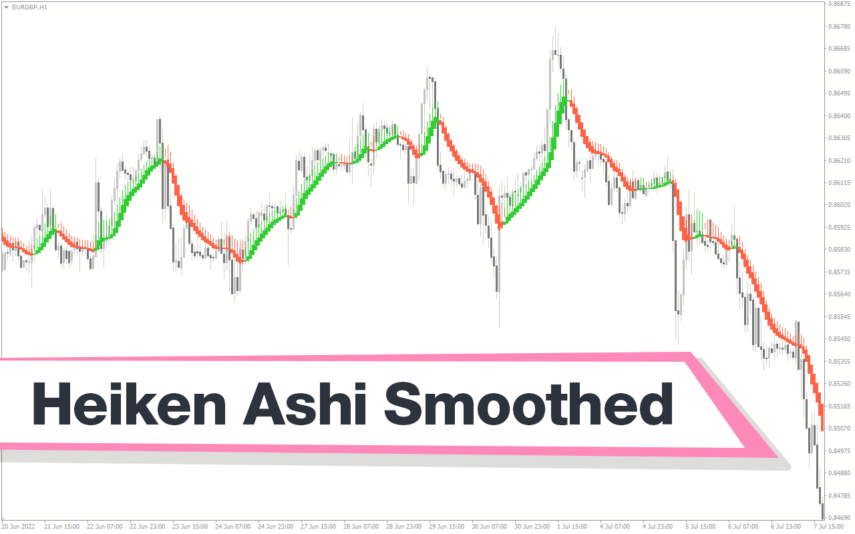
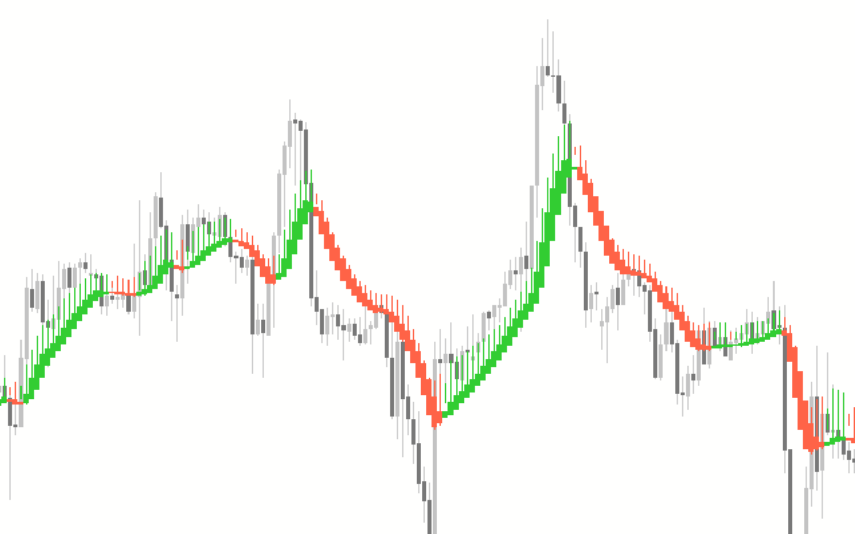
Heikin Ashi Candle
The Heikin Ashi Candle Indicator is a new and popular forex indicator for MT4 that provides traders with a unique way to analyze price movements. It is designed to display candles on a chart in a way that filters out market noise and shows a clearer picture of the trend. The Heikin Ashi Candle indicator averages the open, close, high and low prices of each candle to create a smoother and more readable trend. This indicator is useful for traders of all skill levels as it simplifies the process of spotting trends and potential market reversals.
Reviews
There are no reviews yet.