Features of the Linear Regression Slope Indicator
The Linear Regression Slope indicator allows traders to read the strength of the current move. It shows momentum, which is important for finding the best trading opportunities. The indicator is simple to use and easy to read, allowing all types of traders to use it.
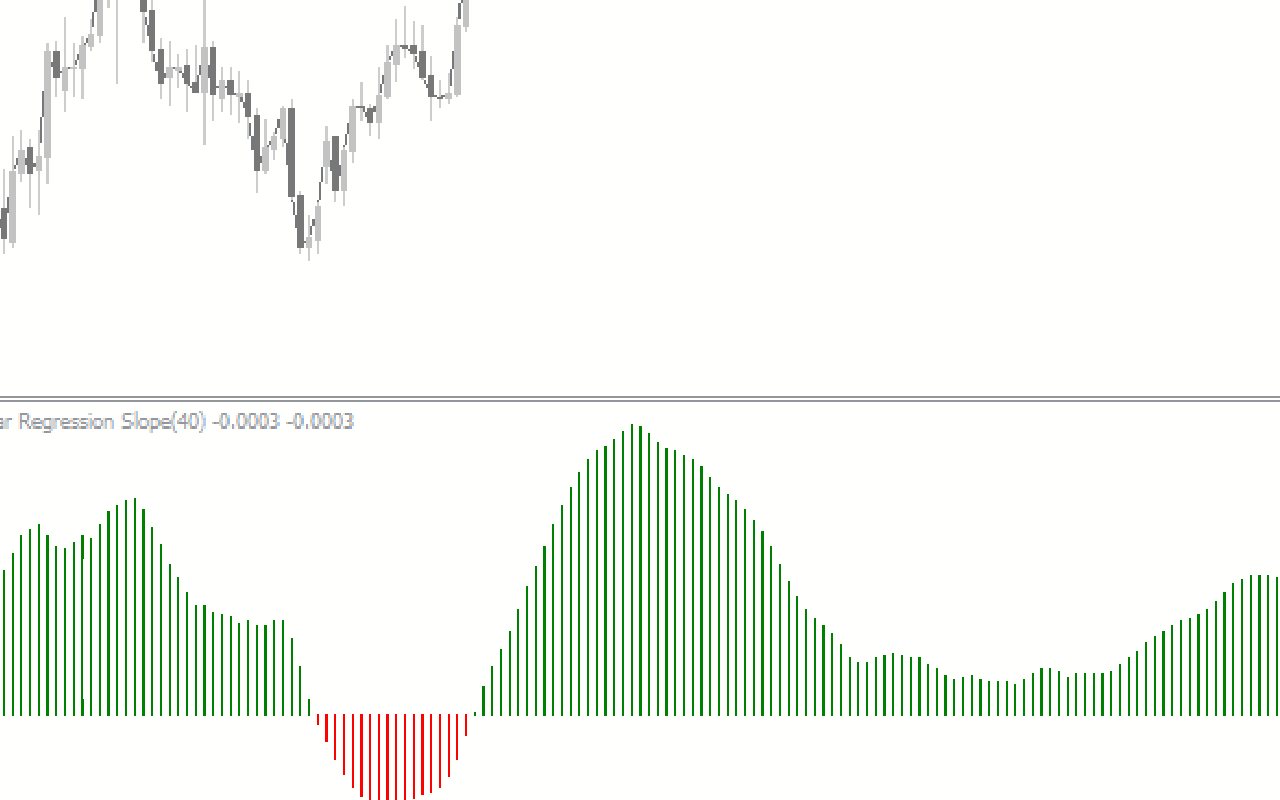
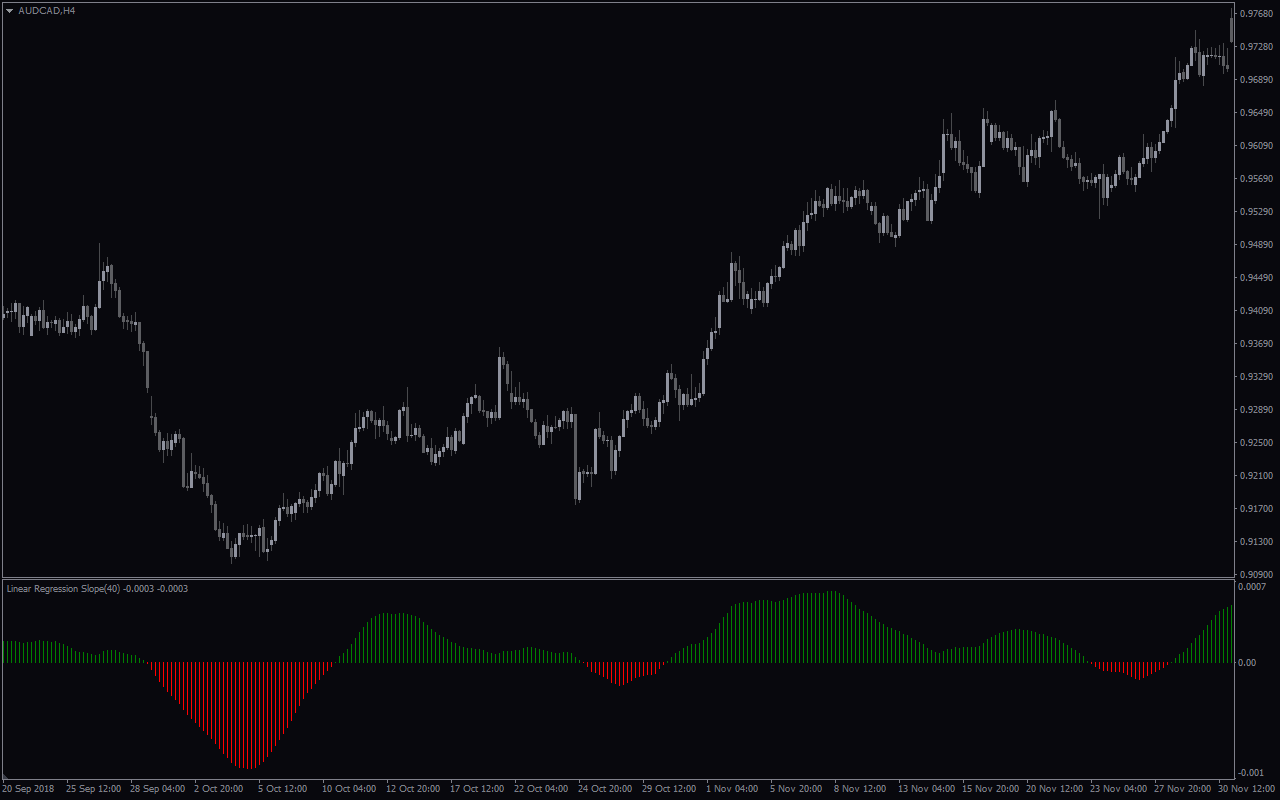
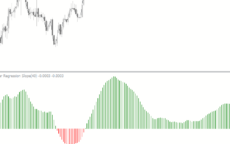
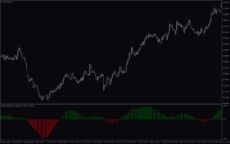
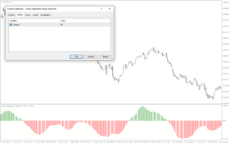
It draws histogram bars at the bottom of the screen with some above the zero line and some below. Those above are green and show a bullish market, while the red ones show a bearish market. When the bars are short, it shows the trend is weak as momentum is low. On the other hand, when the bars are long, it signals a strong trend with solid momentum.
How the Indicator Can Benefit You
The Linear Regression Slope indicator gives great buy and sell signals. When the bars cross above the zero line and turn green, it is a good time to buy. Hold your position until the bars either shorten to show dwindling momentum or cross below the zero line.
For a sell position, wait for the histogram bars to cross below the zero line and turn red. This is a sign that the trend is bearish. Hold the position as long as the bars are below zero and exit when they cross back above.
However, there can be a lot of false signals when you use this indicator alone. Therefore it should be used with other tools that identify the trend. This way, you can filter out short pullbacks. In this case, you only trade in the direction of the trend. When the trend is up and the bars turn red, wait for them to turn green for a buy entry. When the trend is down and the bars turn green, wait for them to turn red and sell.
Indicator Setting Description
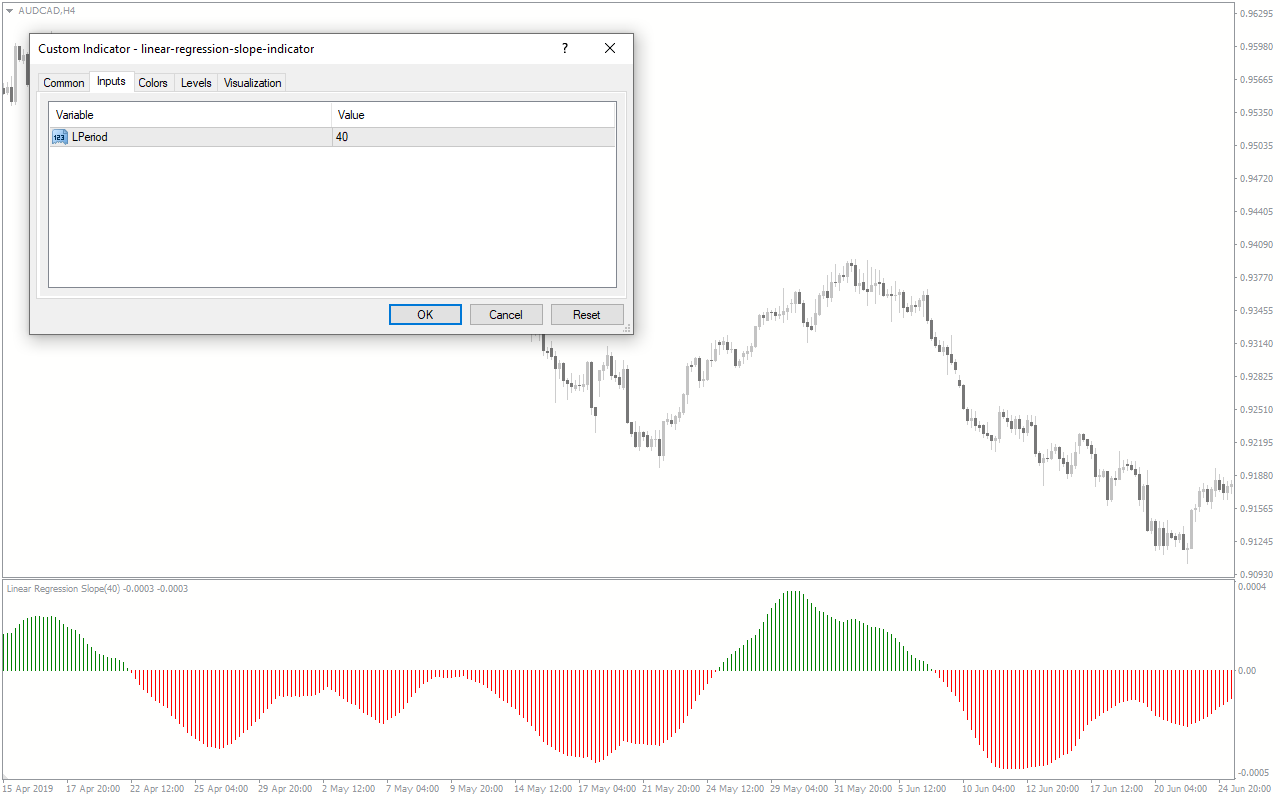
L-Period: This input allows you to change the number of bars the indicator uses to calculate the low of previous trading sessions.


Reviews
There are no reviews yet.