The Market Profile indicator for MT5 is an incredible technical indicator that detects and displays the market structure, volume dynamics, and sentiments. This indicator helps traders visualize the collective impacts of the activities of market participants, which assist in making objective trading decisions.
The indicator is a versatile trading tool that helps Forex traders identify optimal zones for support and resistance zones, trade entry, and take profit/stop loss. Besides, it is a great tool for identifying short and long-term trading opportunities in the Forex market.
Features of the Market Profile Indicator for MT5
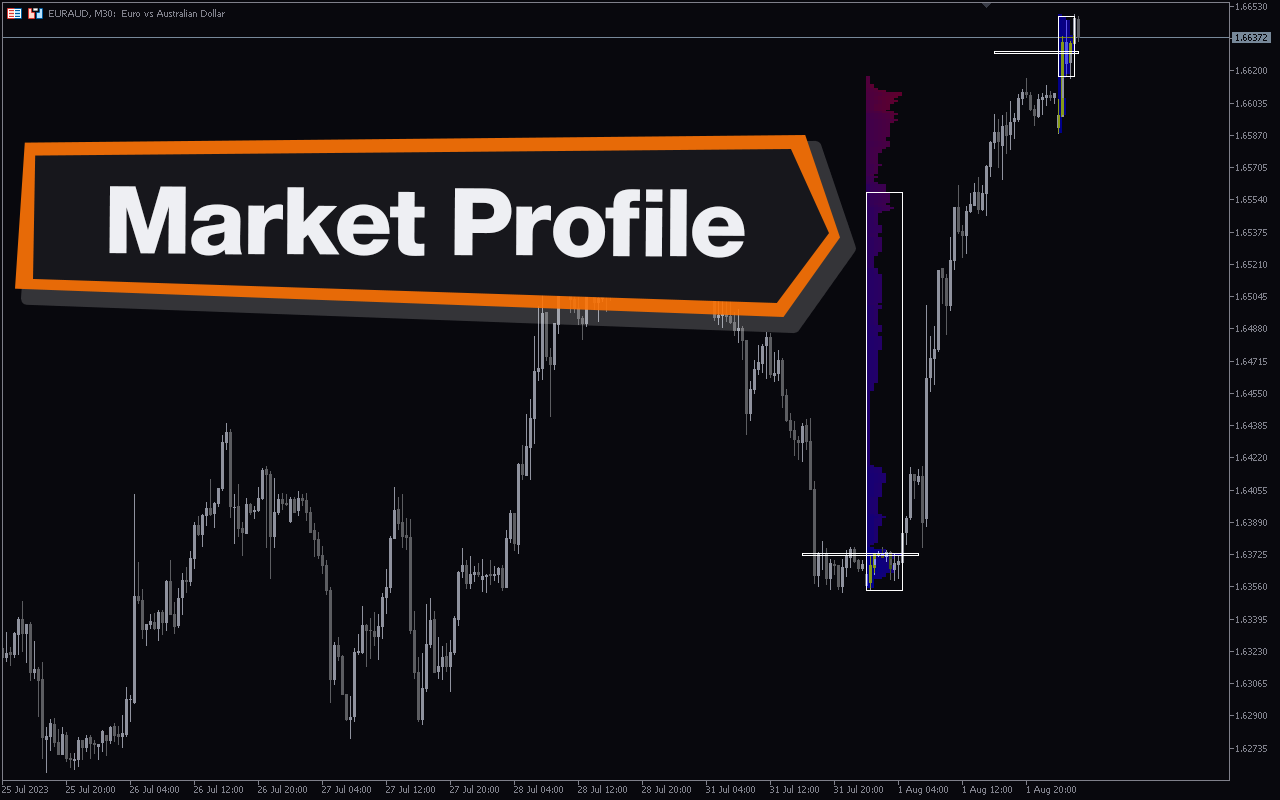
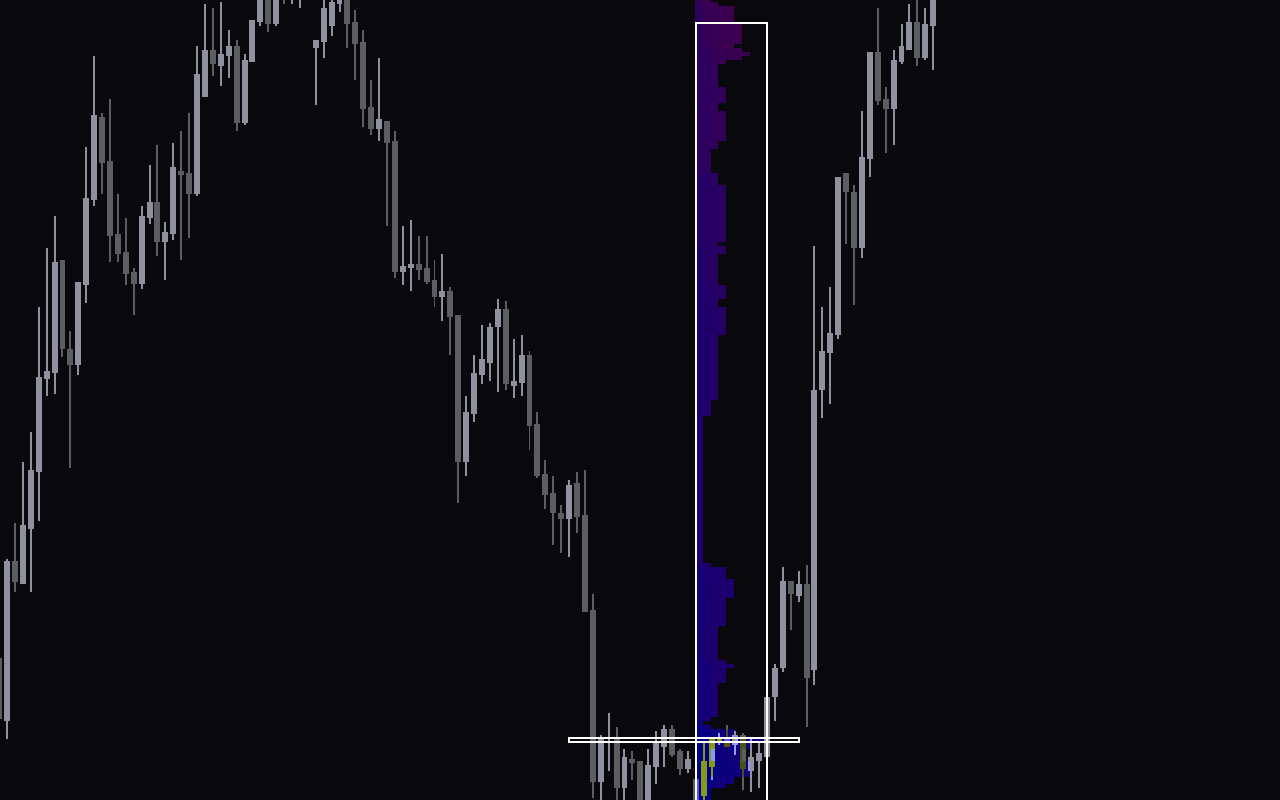
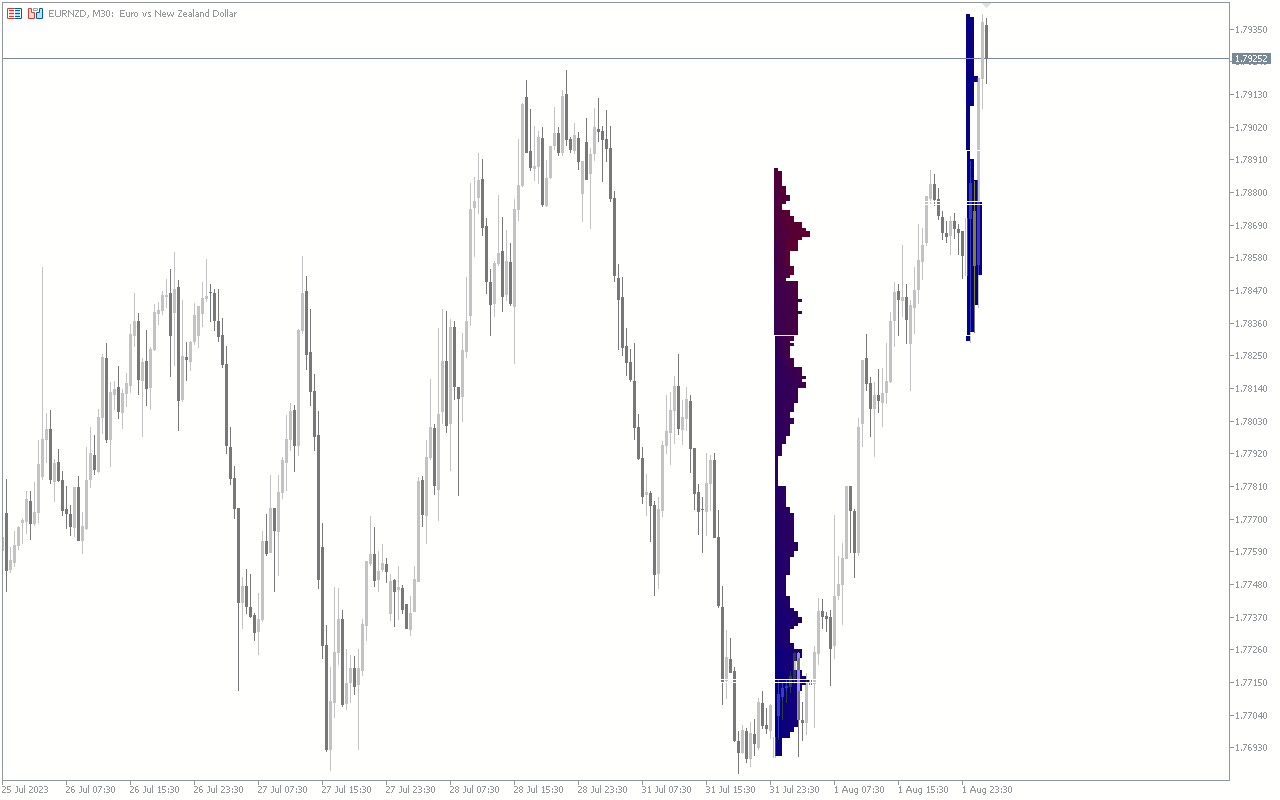
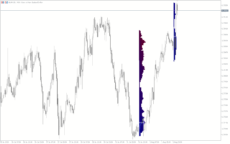
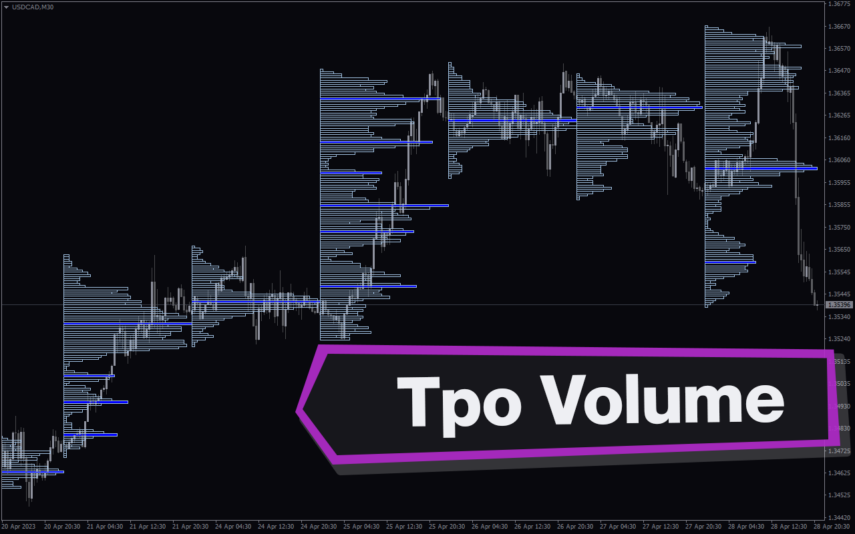
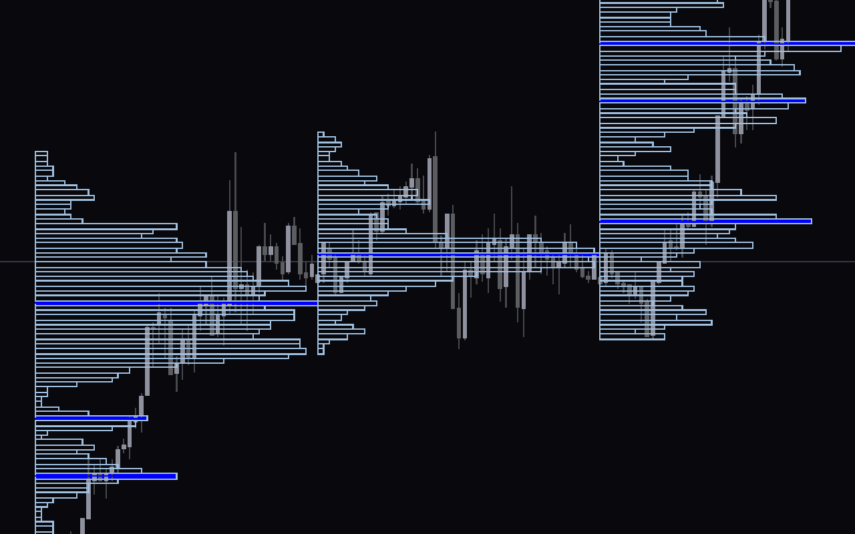
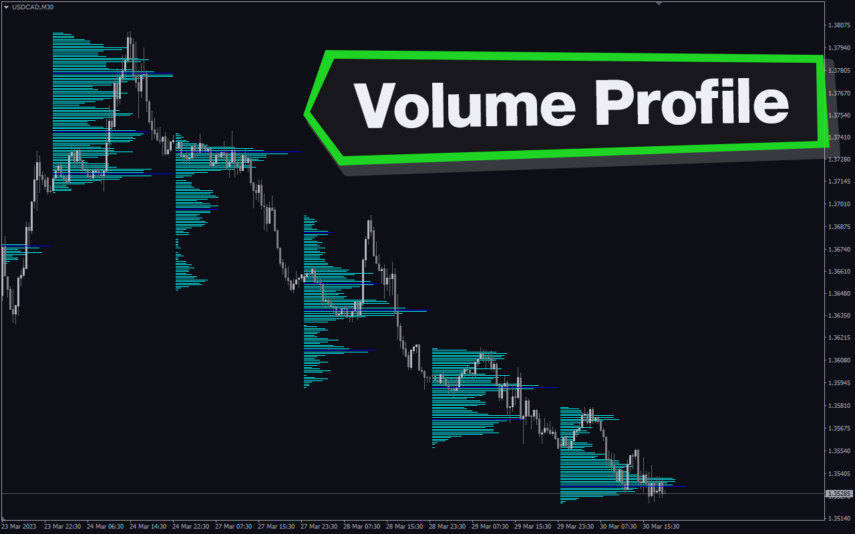
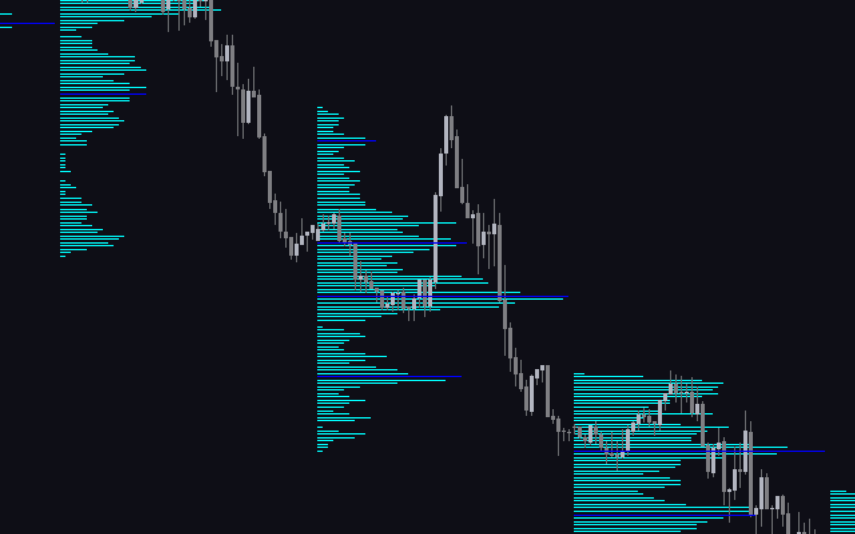
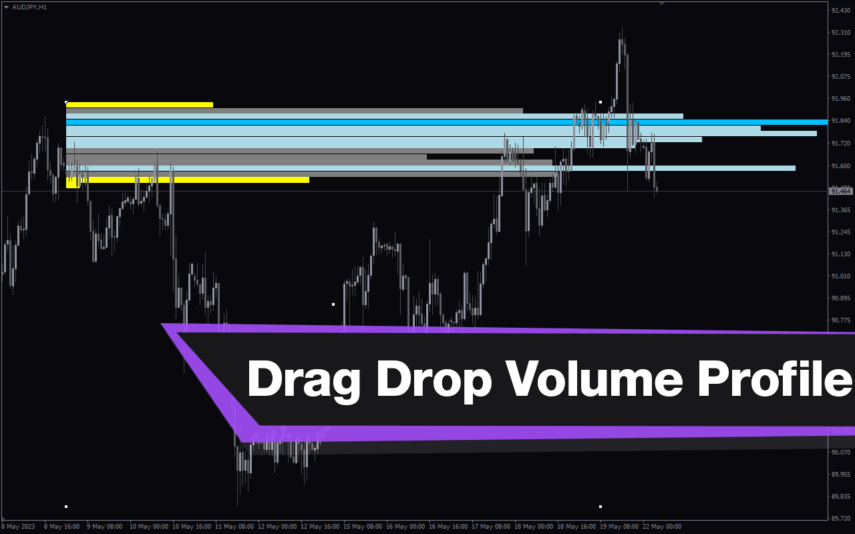
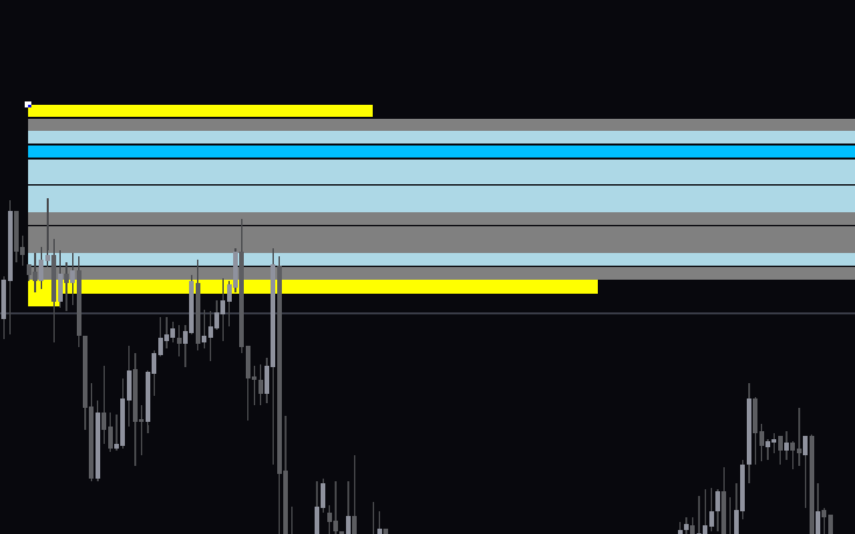
The indicator is a multi-timeframe financial market analyzer that groups the market data based on time, price, and volume distribution. It calculates and displays the value area, point of control, and oversell volume profile, represented as histogram bars.
The value area indicates zones with significant trading activities. On the other hand, the point of control depicts the price level with significant trading volume, while the volume profile shows the amount of volume traded at each level. These levels are potential support and resistance zones in the market.
Benefits of Using the Indicator
- Market Structure Analysis: The Market Profile indicator for MT5 makes technical analysis a lot easier for beginners and experienced traders. The market structure displayed by the indicator assists Forex traders in understanding the market sentiment, which helps in projecting the potential direction of the price.
- Trading Opportunities: Forex traders can use the indicator to identify trading opportunities. For instance, in an uptrend, traders might look for a trading opportunity to go long (buy) if the price retraces to the point of control.
- Risk Management: Finally, the indicator can improve traders’ risk management techniques. For example, traders can set take profit at a key support zone displayed by the indicator.
Indicator Settings Description
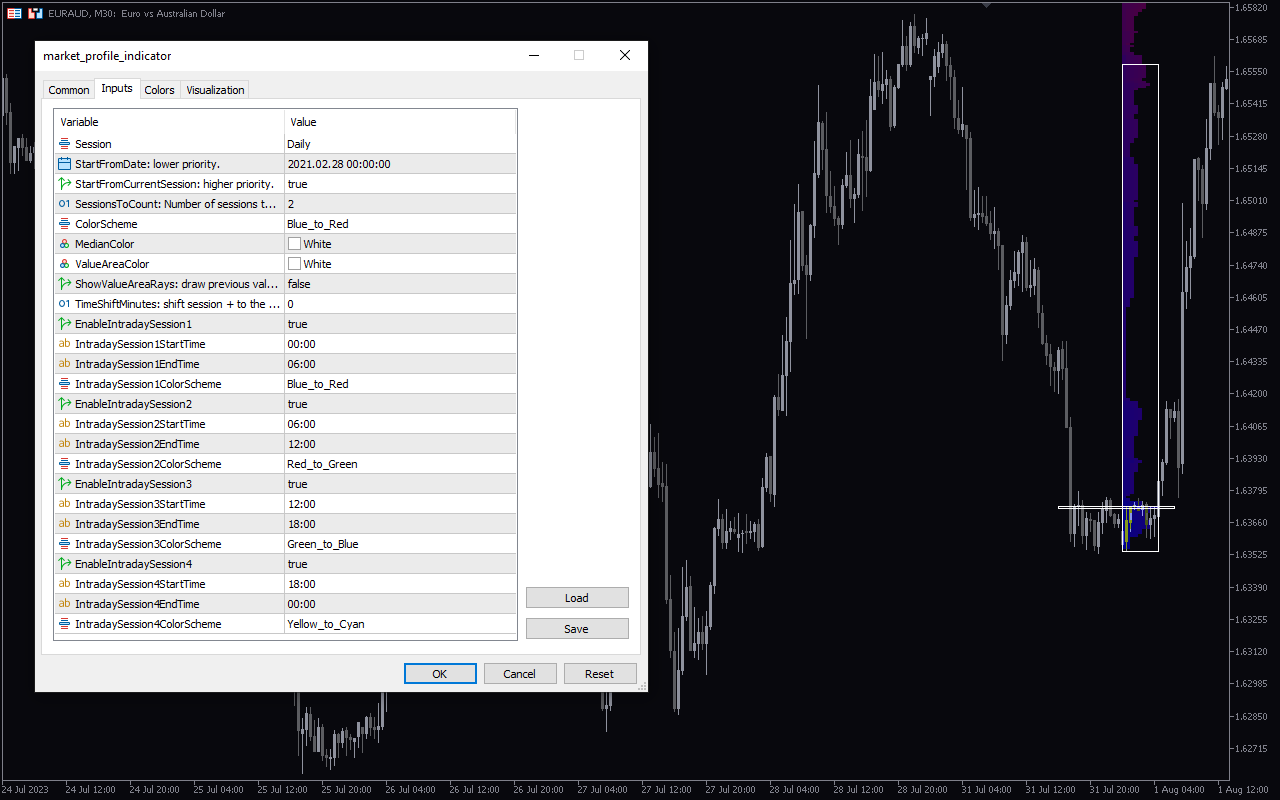
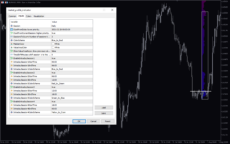
The indicator comes with the following customizable settings:
StartFromDate: lower priority: Determines the start date to draw the volume profile.
StartFromCurrentSession: higher priority: Determines the start session to draw the volume profile.
SessionsToCount: Number of sessions: Determines the number of sessions for the market profile analysis.
color scheme: Determines the colors for the market profile blocks.
MedianColor: Determines the median color.
ValueAreaColor: Determines the border color for the price area.
ShowValueRays: draw previous: Enables/Disable the display of previous value areas rays.
TimeShiftMinutes: shift session: Determines shift session time for analysis.
EnableIntradaySessions 1: Enables/Disables first intraday session analysis.
IntradaySession1StartTime: Determines start time for first intraday session analysis.
IntradaySession1EndTime: Defines end time for the first intraday session analysis.
IntraDaySession1ColorScheme: Defines the color for the first intraday session.
EnableIntradaySession2: Enables/Disables second intraday session analysis.
IntradaySession2StartTime: Determines start time for second intraday session analysis.
IntradaySession2EndTime: Defines end time for the second intraday session analysis.
IntraDaySession2ColorScheme: Defines the color for the second intraday session.
EnableIntradaySession3: Enables/Disables third intraday session analysis.
IntradaySession3StartTime: Determines start time for third intraday session analysis.
IntradaySession3EndTime: Defines end time for the third intraday session analysis.
IntraDaySession3ColorScheme: Defines the color for the third intraday session.
EnableIntradaySession4: Enables/Disables fourth intraday session analysis.
IntradaySession4StartTime: Determines start time for the fourth intraday session analysis.
IntradaySession4EndTime: Defines end time for the fourth intraday session analysis.
IntraDaySession4ColorScheme: Defines the color for the fourth intraday session.

Reviews
There are no reviews yet.