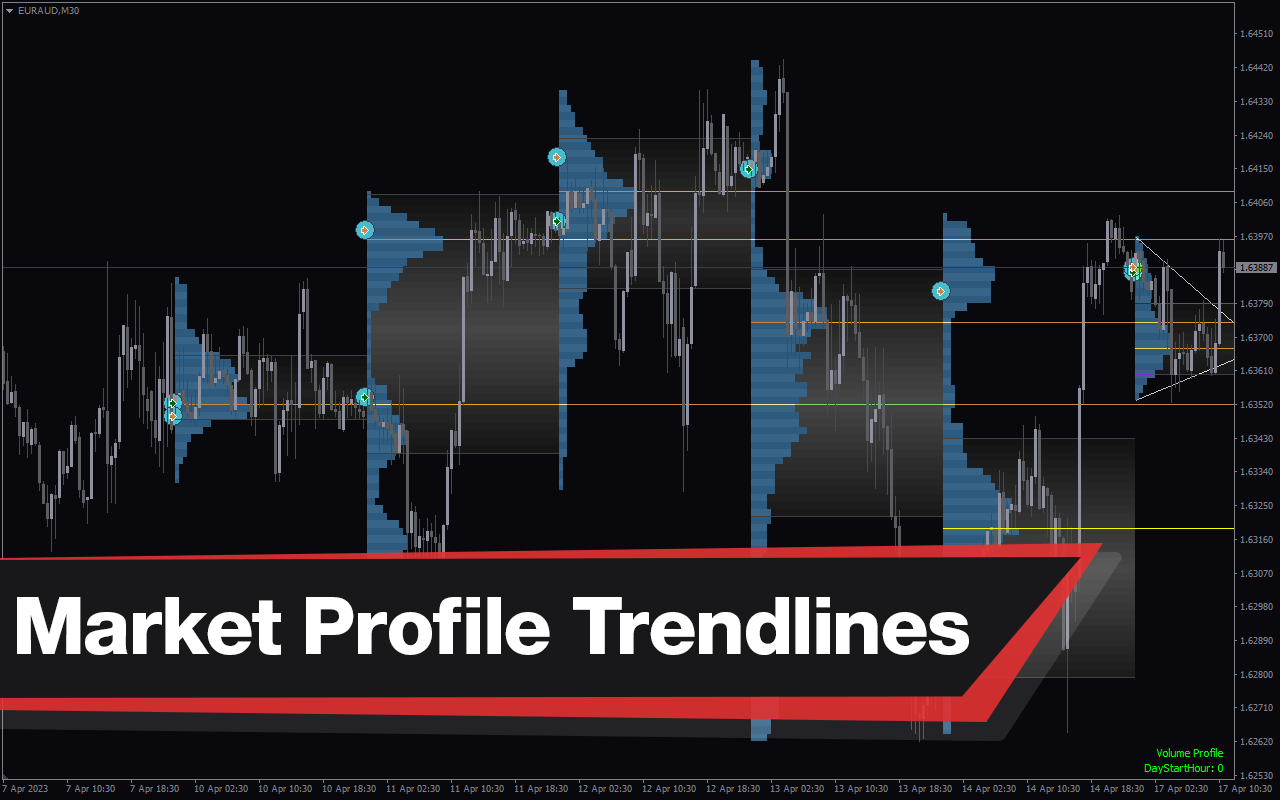
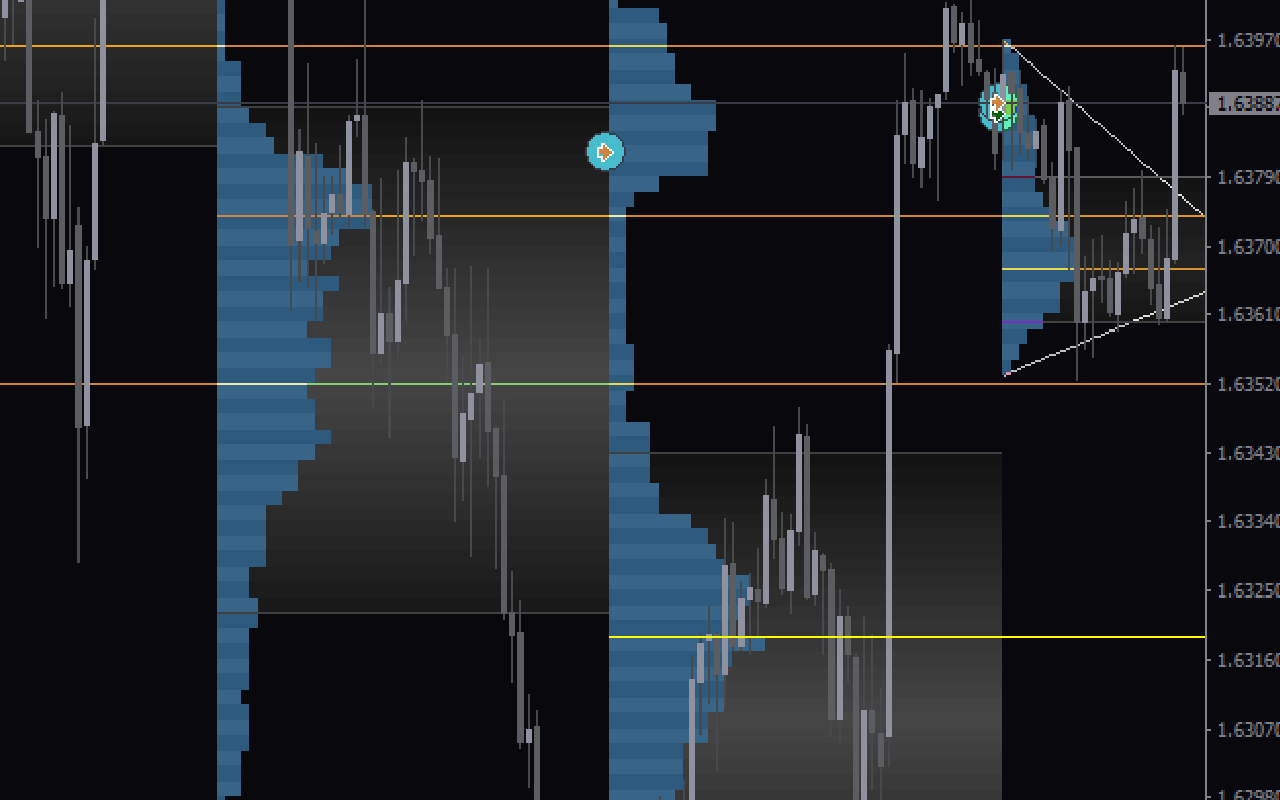
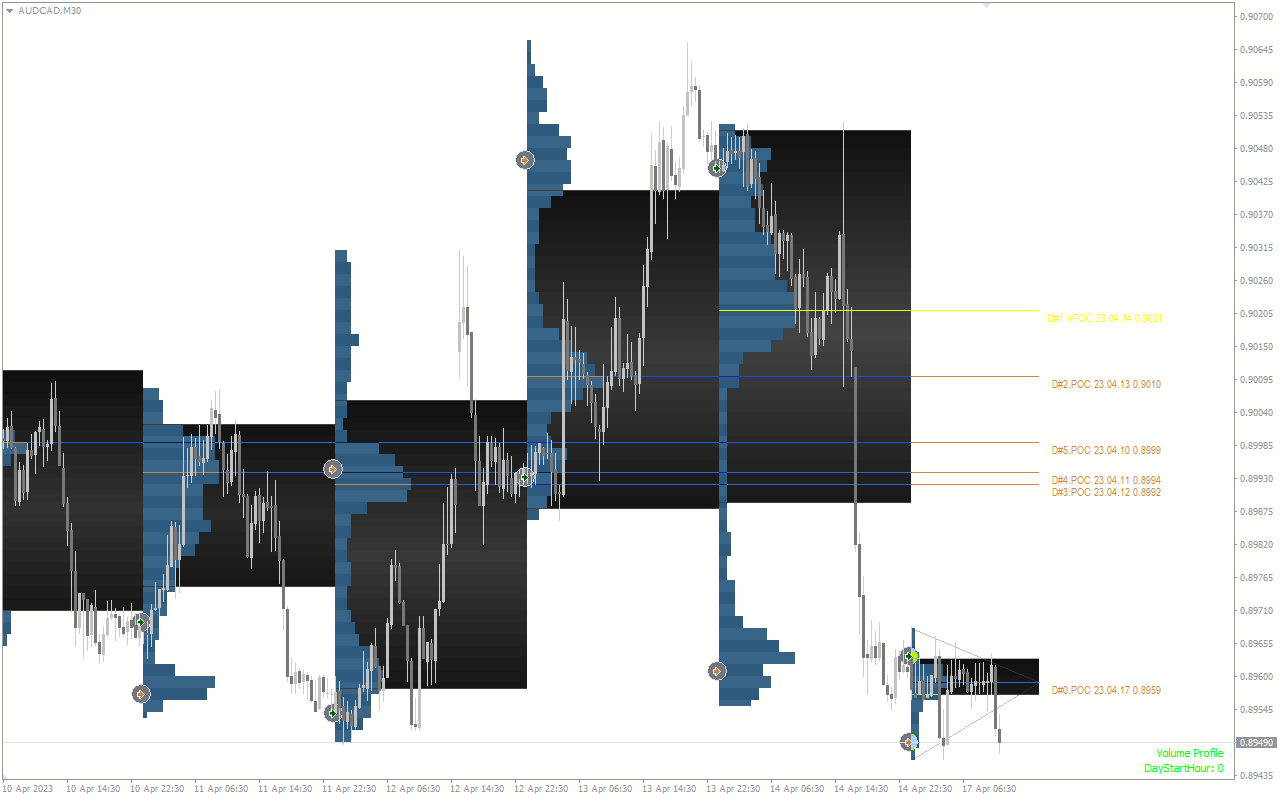
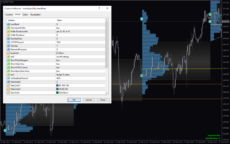
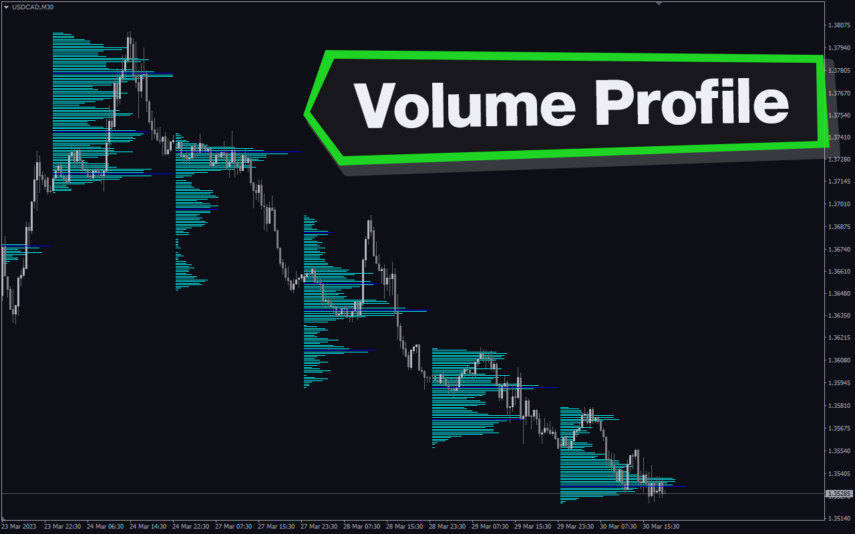
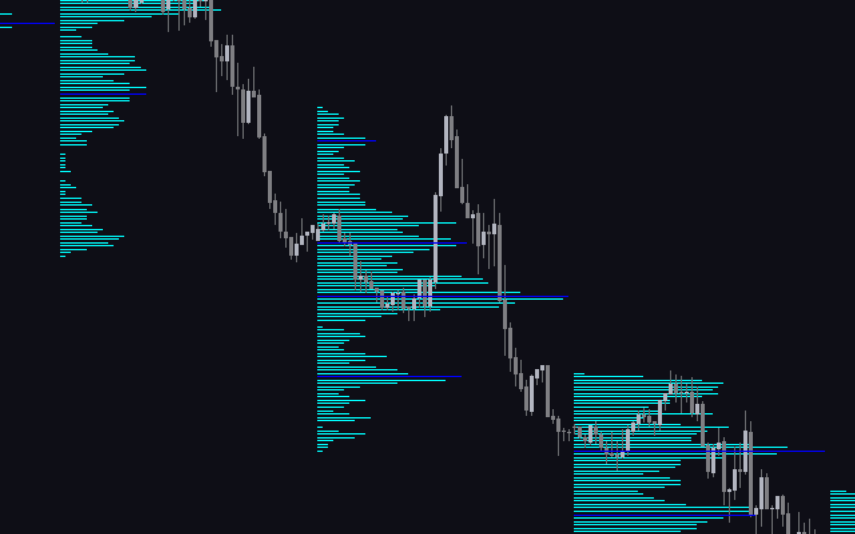
The Market Profile Trendlines Indicator for MT4 is a price action indicator that reveals the price distribution and accumulation phase in a trading session. It represents the price data of a financial instrument with a histogram, which depicts the distribution of trading activities in the market. A trend line is also attached to the indicator to help traders identify a breakout for buying or selling opportunities.
The histogram shows the Point of Control (POC) and Value Area (VA). The Point of Control (POC) is one of the most significant zones of interest because it captures the intensity of trading activity. Besides, it is also a support and resistance zone for price reversal. Therefore, the Point of Control (POC) tends to attract the price for a potential trend reversal. So, a forex trader may anticipate a trend reversal when the price returns to the POC.
Another level of interest is the Value Area (VA). It is a zone where different traders spend considerable trading time; therefore, it tends to act as a support/resistance level. Thus, the market may reverse when the price returns to the edge of the Value Area.
Features of the Indicator
This version of the Market Profile indicator is built with the trend lines to identify trend reversal/breakout trading opportunities. Furthermore, it shows the price distribution using the Point of Control and the Value Area zones, which are significant areas to look for trading opportunities.
Benefits of using the Indicator
- Automatic Analysis of the Market Sentiment: The indicator is an incredible trading tool that automatically identifies the market profile of an instrument to determine whether it is bullish, bearish, or consolidating.
- Displays Market Key Levels: The indicator highlights the Point of Interest and the Value Area, which are critical trading zones in the market. As a forex trader, the POC and VA are critical zones to anticipate trend reversal buying or selling opportunities.
Indicator Setting Description

The indicator comes with the following customizable settings:
Lookback: This determines the maximum candlesticks for trend analysis.
Usevolume profile: Enables/Disables the volume profile feature.
Daystarthour: This sets the time to begin daily analysis.
VATPOPercent: This shows the percentage of TPO added to the VA.
TickSize: This shows the size of the POC/VA.
ExtendedPocLines: Enables/Disables extension of the POC lines.
Trend color: This defines the color to show the trend.
Showpricehistogram: Enables/Disables the price histogram feature.
ShowValueArea: Enables/Disables the display of the value area of the price.
ShowOpenCloseArrow: Enables/Disables the display of the open/close arrow.
VolAmplitudepercent: This shows the percentage of the volume amplitude.
HistoHeight: This defines the height of the histogram.
HistoColor1: Color of histogram1.
HistoColor2: Color of histogram2.
OpenColor: Color for the open price.
CloseColor: Color for the close price.
POCColor: This defines the color to display the POC.
VirginPOCColor: This determines the color of the untested POC zone.
VAColor: Color of the Value Area (VA).
VALinesColor: Color of the VA lines.
InfoColor: Color to display market data.
DailyProfileDataTf: This determines the time frame to display the daily profile data
WeeklyProfileDataTf: This determines the time frame to display the weekly profile data
MonthlyProfileDataTf: This determines the time frame to display the monthly profile data.

Reviews
There are no reviews yet.