

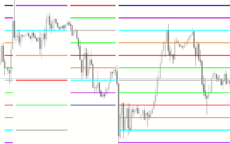
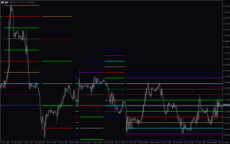
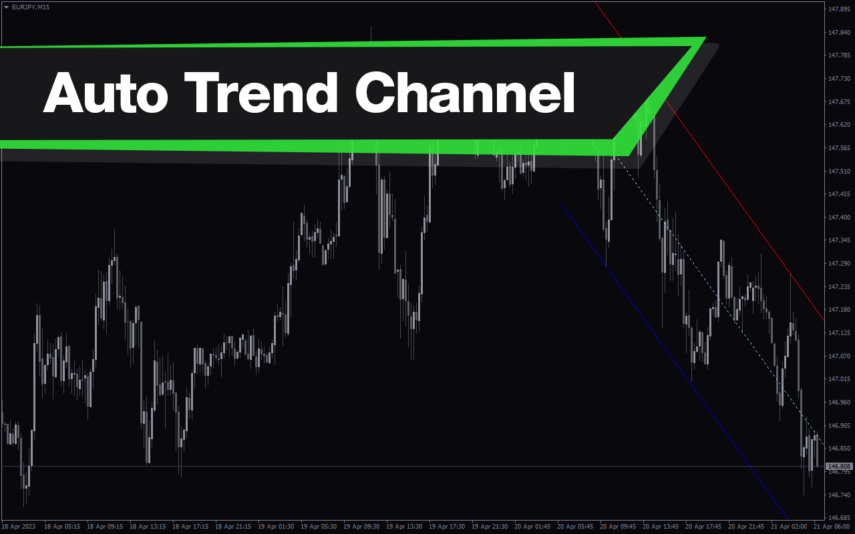
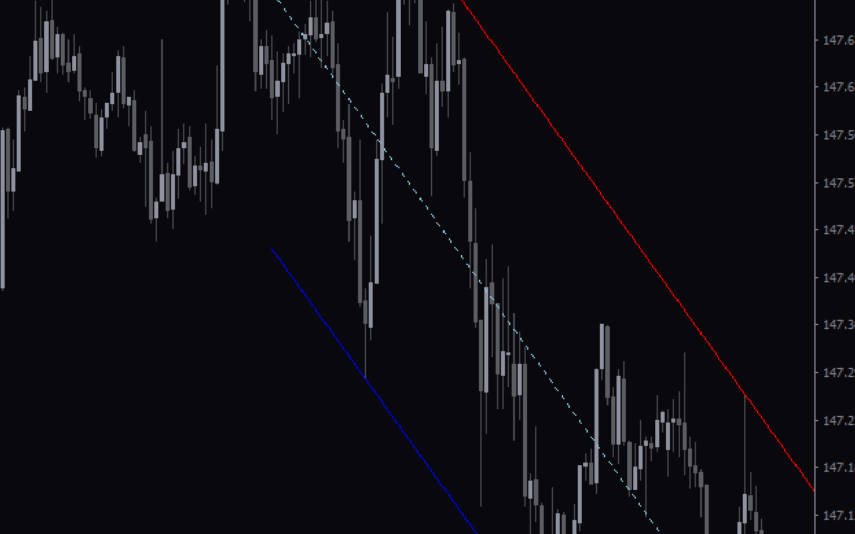
The Murrey Math Indicator for MT5 is a useful tool for forex traders looking to analyze market trends and make informed trading decisions. This popular indicator is available for free and works by plotting nine different lines on the chart, representing key support and resistance levels. Traders can use these levels to identify potential entry and exit points, as well as to set stop-loss and take-profit levels. To use the Murrey Math Indicator, simply add it to your MT5 chart and adjust the settings to suit your trading style. The indicator will automatically calculate the support and resistance levels based on a specific mathematical formula, helping you to visualize important price levels and make more informed trading decisions. Whether you are a beginner or an experienced trader, the Murrey Math Indicator can be a valuable tool in your forex trading arsenal.
MT5


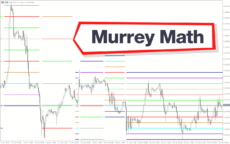
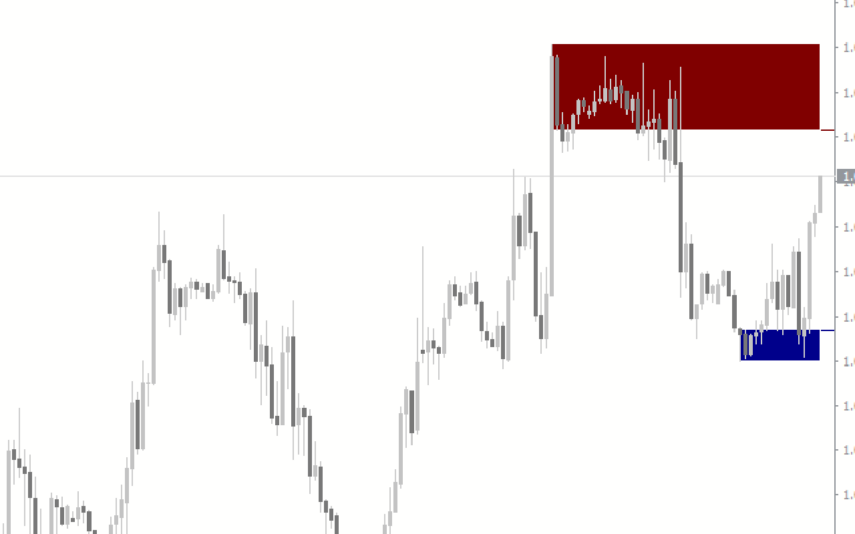
Murrey Math MTF
Murrey Math Indicator MT5 is a popular and useful forex indicator that is free to use. It is based on mathematical calculations that help traders identify key support and resistance levels. The indicator is used to determine potential price reversal points in the market. By adding Murrey Math Indicator MT5 to your trading strategy, you can make more informed trading decisions.
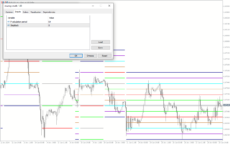
| Timeframe | |
|---|---|
| Trading Style | |
| Platform | |
| Indicator Type |
0
People watching this product now!
Downloads -
Description
Reviews (0)
How to Install
Related products
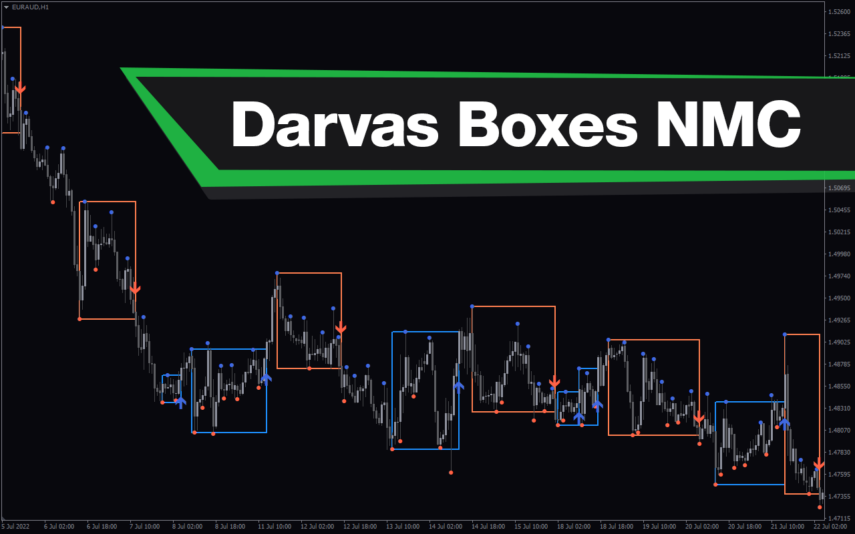
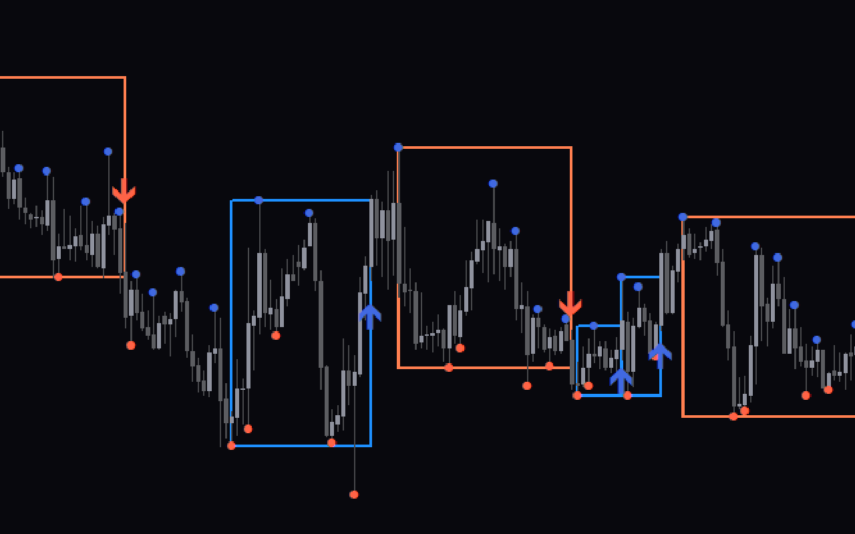
Darvas Boxes nmc
The Darvas Boxes NMC Indicator is a nice and free Forex trading tool available for MT4 platforms. It is based on the Darvas box trading method, which involves identifying trends through the creation of boxes on a price chart. The indicator helps traders visualize key support and resistance levels and potential trend reversals. The Darvas Boxes NMC Indicator provides clear buy and sell signals through color changes and arrows, allowing traders to make informed trading decisions. Its user-friendly interface and customizable settings make it suitable for both novice and experienced traders.
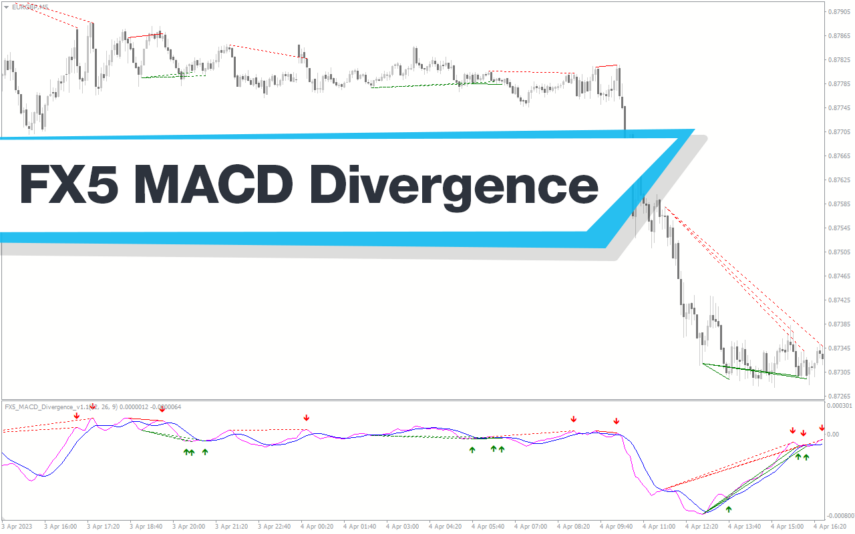
FX5 MACD Divergence
The MACD FX5 Divergence Indicator is a new and popular forex indicator that runs on the MT4 platform. This is a free indicator that traders can use to identify potential trend reversals and momentum shifts. The indicator is based on the Moving Average Convergence-Divergence (MACD) indicator, which measures the distance between two moving averages. It analyzes the divergence between the MACD indicator and price action and then generates buy or sell signals. Use this indicator to better understand market trends and take advantage of potential profit opportunities.
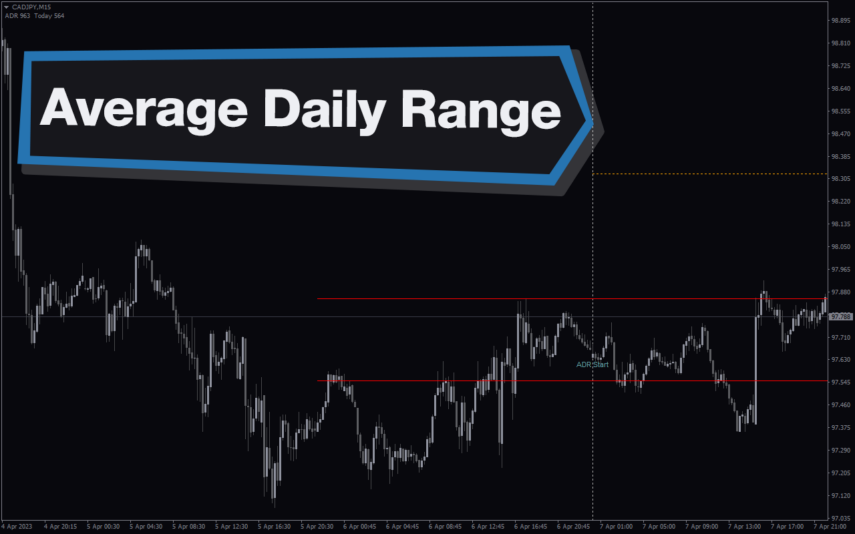
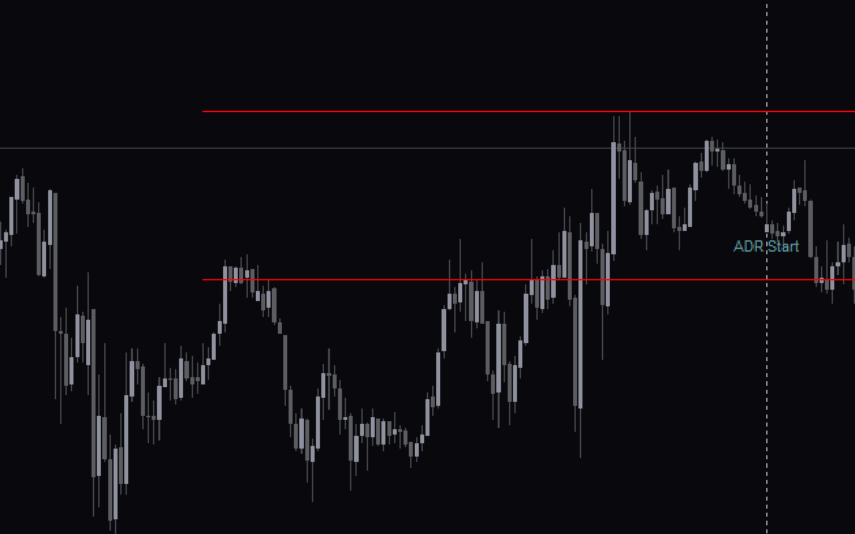
Average Daily Range
The ADR HighLow indicator is a new and popular forex indicator that traders can use for free on the MT4 platform. This indicator measures the average daily range (ADR) of a currency pair and displays the high and low of the day, and is also a great tool for setting stop loss and take profit levels. Use the best ADR indicator to identify potential support and resistance levels and use their trading strategy successfully.
Reviews
There are no reviews yet.