

The Murrey Multi Time Frame is a popular and useful forex indicator designed for the MetaTrader 4 (MT4) platform. This free indicator is based on the Murrey Math levels, which are used by traders to identify potential support and resistance levels in the market. The Murrey Multi Time Frame indicator allows traders to plot Murrey Math levels on different time frames simultaneously, making it easier to spot key levels across multiple time frames. This can help traders make more informed trading decisions and improve their overall trading strategy. To use the Murrey Multi Time Frame indicator, simply download and install it on your MT4 platform. Once installed, you can customize the indicator settings to suit your trading style and preferences. You can then use the indicator to identify potential support and resistance levels, as well as potential entry and exit points for your trades.
MT4


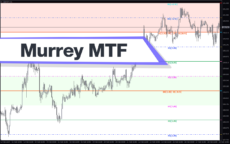
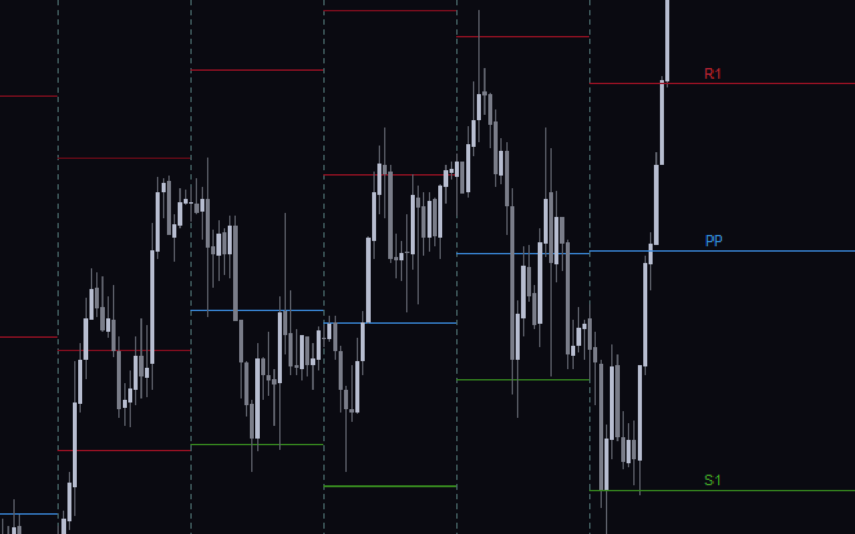
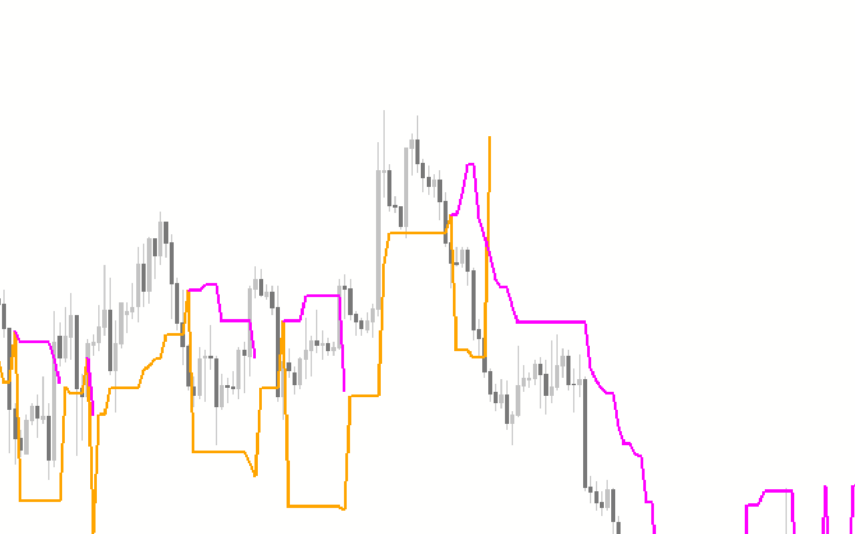
Murrey MTF
The Murrey Multi-Time Frame is a popular and useful forex indicator for MT4 that provides traders with key support and resistance levels across multiple time frames. This free indicator can help traders identify potential entry and exit points by analyzing price action within the Murrey Math grid. By incorporating this indicator into their trading strategy, traders can make more informed decisions based on levels of significance.
| Indicator Type | |
|---|---|
| Trading Style | , |
| Timeframe | , |
| Platform |
0
People watching this product now!
Downloads - 18
Description
Reviews (0)
How to Install
Related products
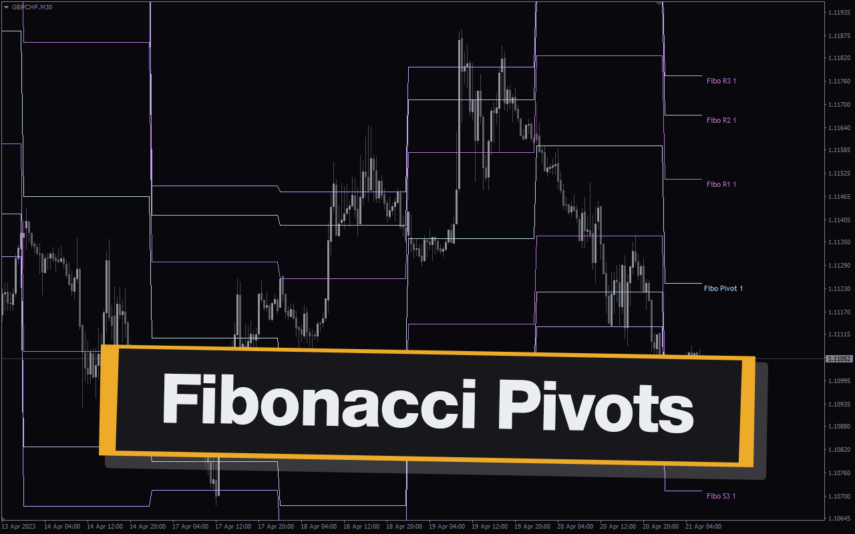
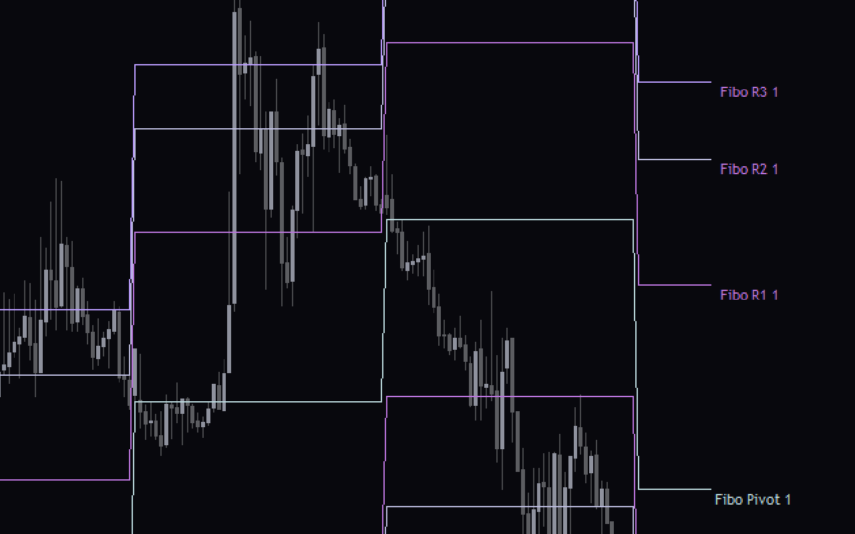
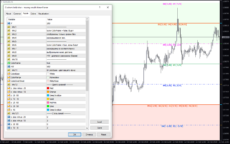
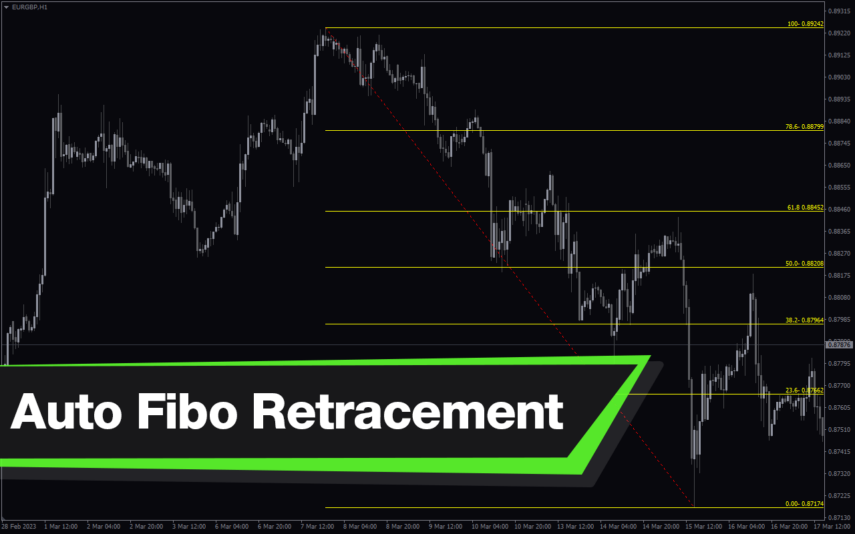
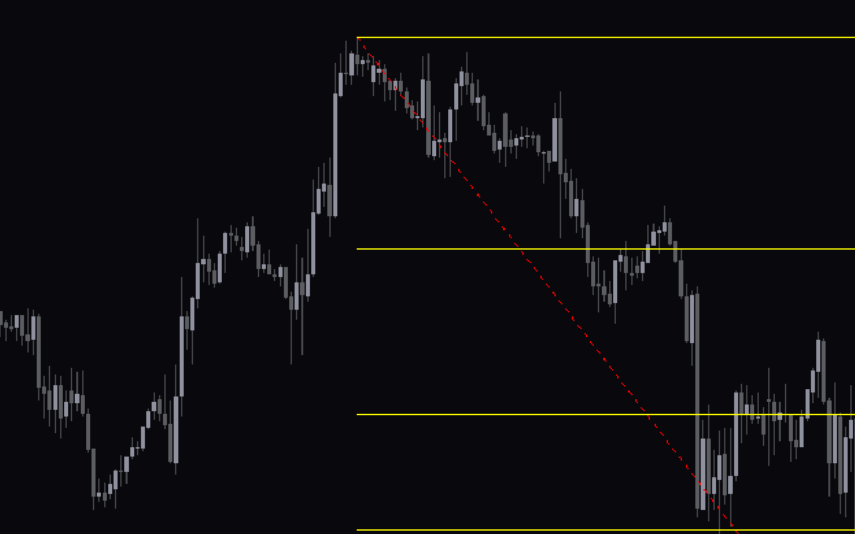
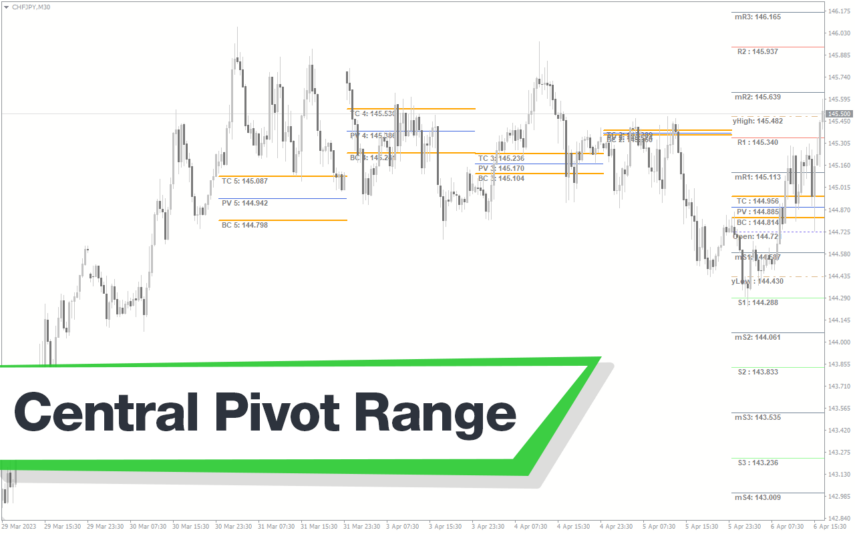
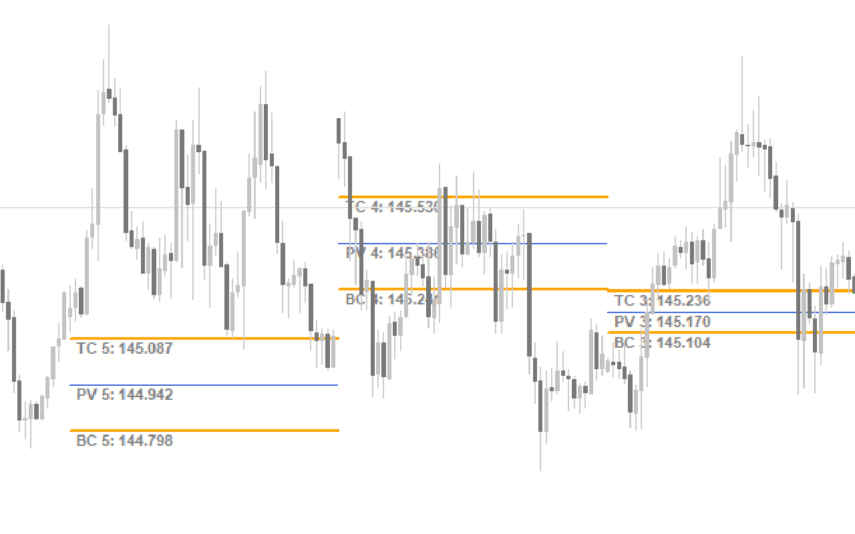
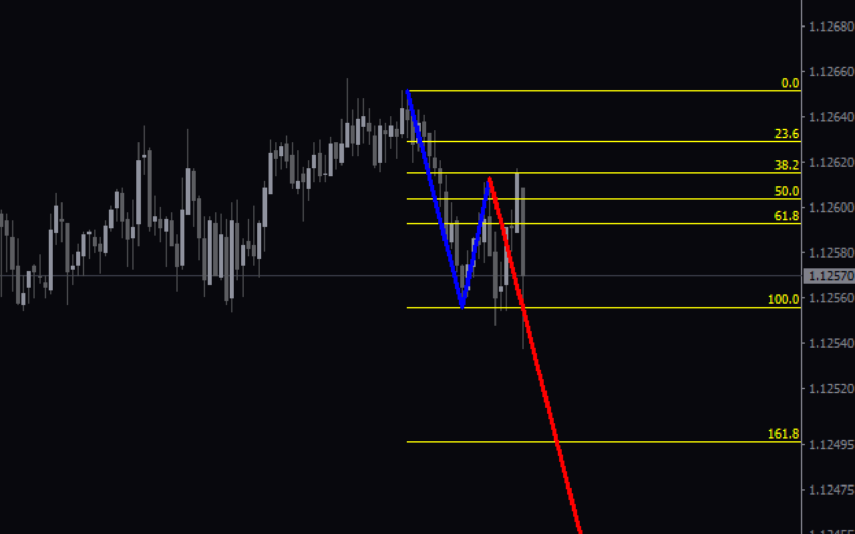
Fibonacci Pivots
The Fibonacci Pivots Indicator is a powerful MT4 tool for Forex traders looking to predict key levels of support and resistance.Using the Fibonacci sequence, the indicator calculates the pivot levels and displays them on the chart, making it easy to identify potential entry and exit points. The Fibonacci Pivots Indicator works best in trending markets and can be used on multiple timeframes, making it suitable for both short-term and long-term traders. With its clear and easy-to-use interface, this indicator is a valuable addition to any trader's toolbox.
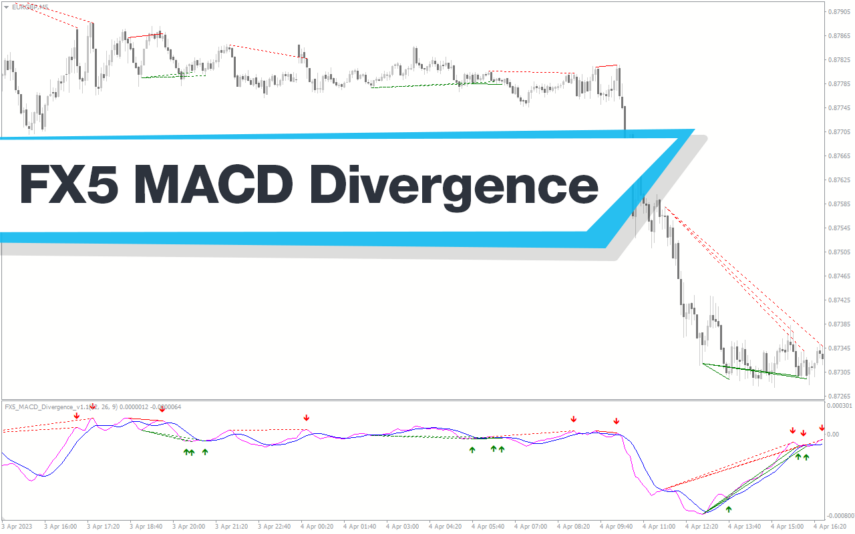
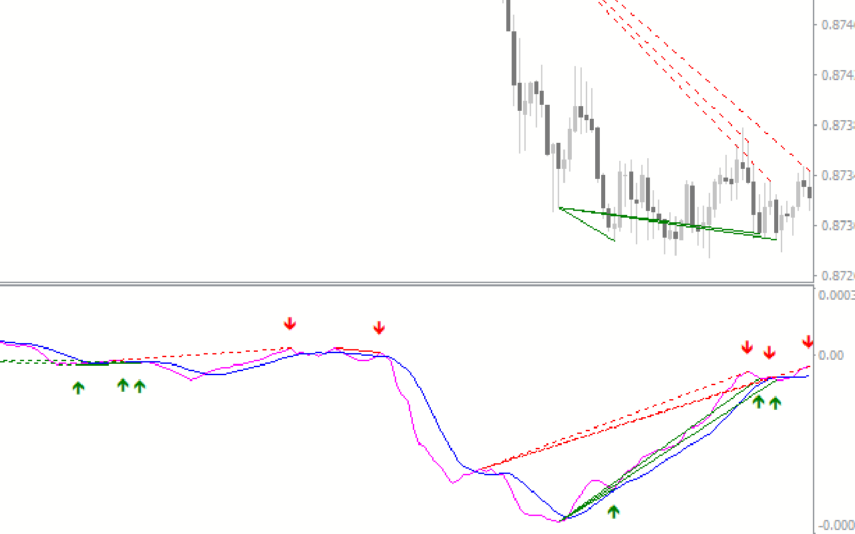
FX5 MACD Divergence
The MACD FX5 Divergence Indicator is a new and popular forex indicator that runs on the MT4 platform. This is a free indicator that traders can use to identify potential trend reversals and momentum shifts. The indicator is based on the Moving Average Convergence-Divergence (MACD) indicator, which measures the distance between two moving averages. It analyzes the divergence between the MACD indicator and price action and then generates buy or sell signals. Use this indicator to better understand market trends and take advantage of potential profit opportunities.
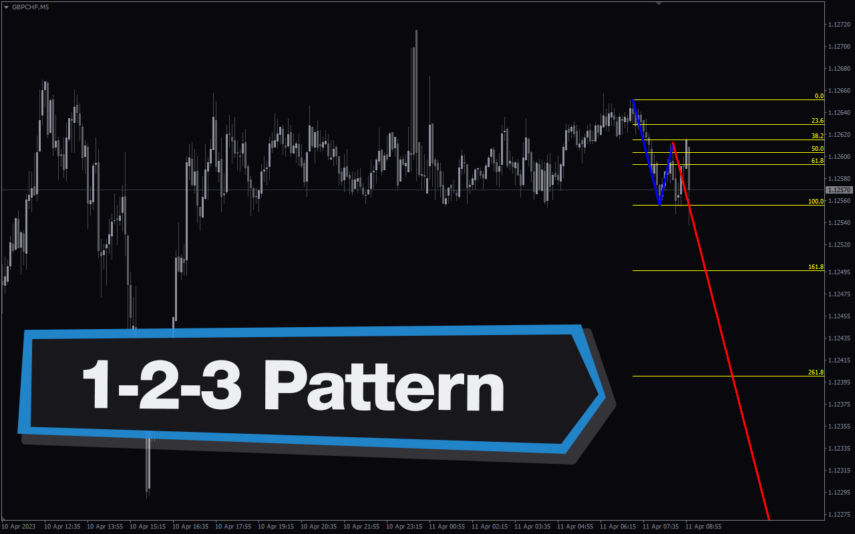
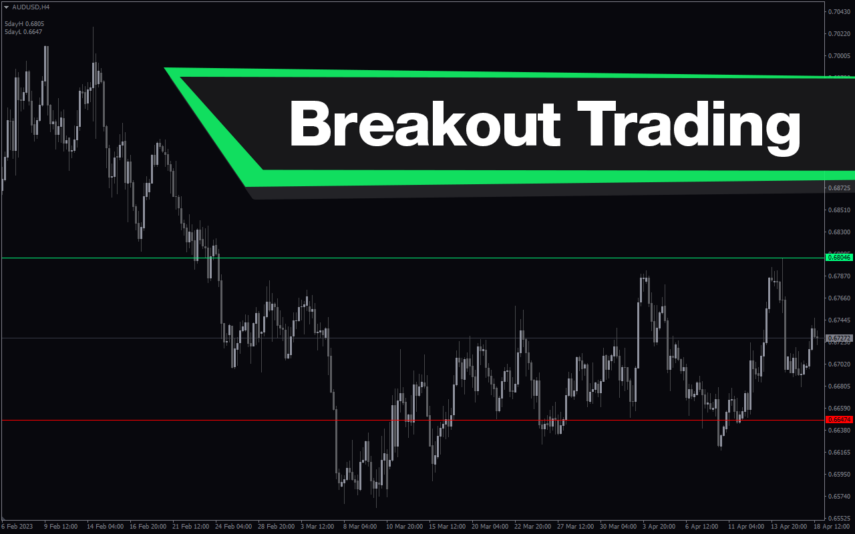
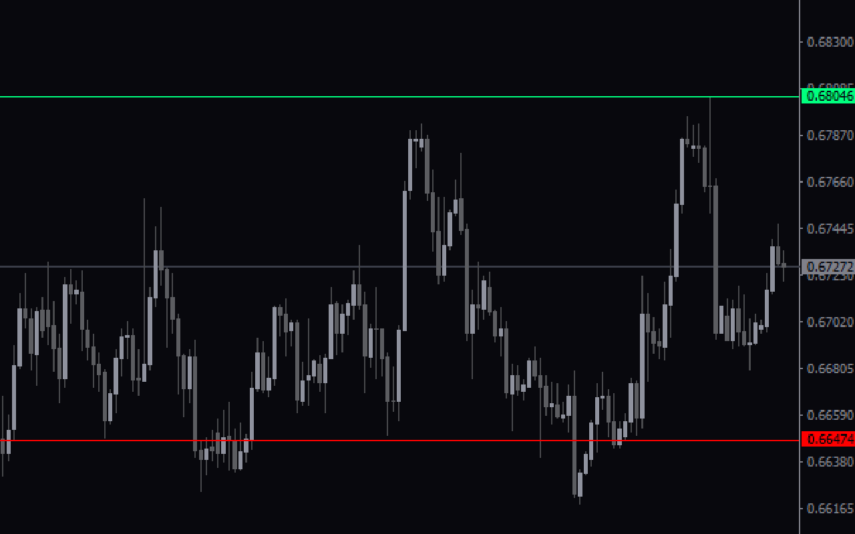
Breakout Trading
The Breakout Trading Indicator is a powerful MT4 tool designed for forex traders who want to catch breakouts in their trading strategy. The indicator scans for potential breakouts and alerts traders when a potential breakout is detected, making it easy to spot profitable trading opportunities. With an advanced algorithm, the indicator identifies key support and resistance levels, helping traders better understand market trends and make informed trading decisions.
Reviews
There are no reviews yet.