Features of the My Price Action Indicator
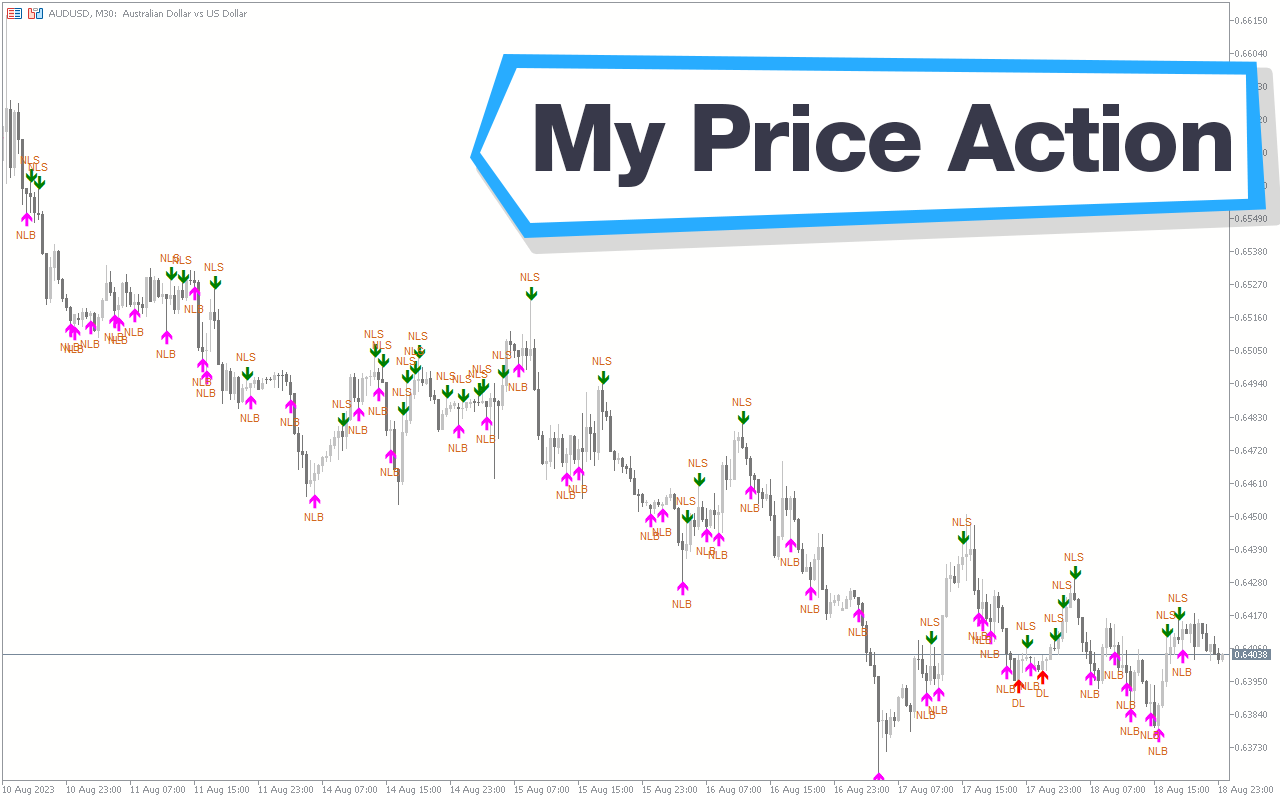
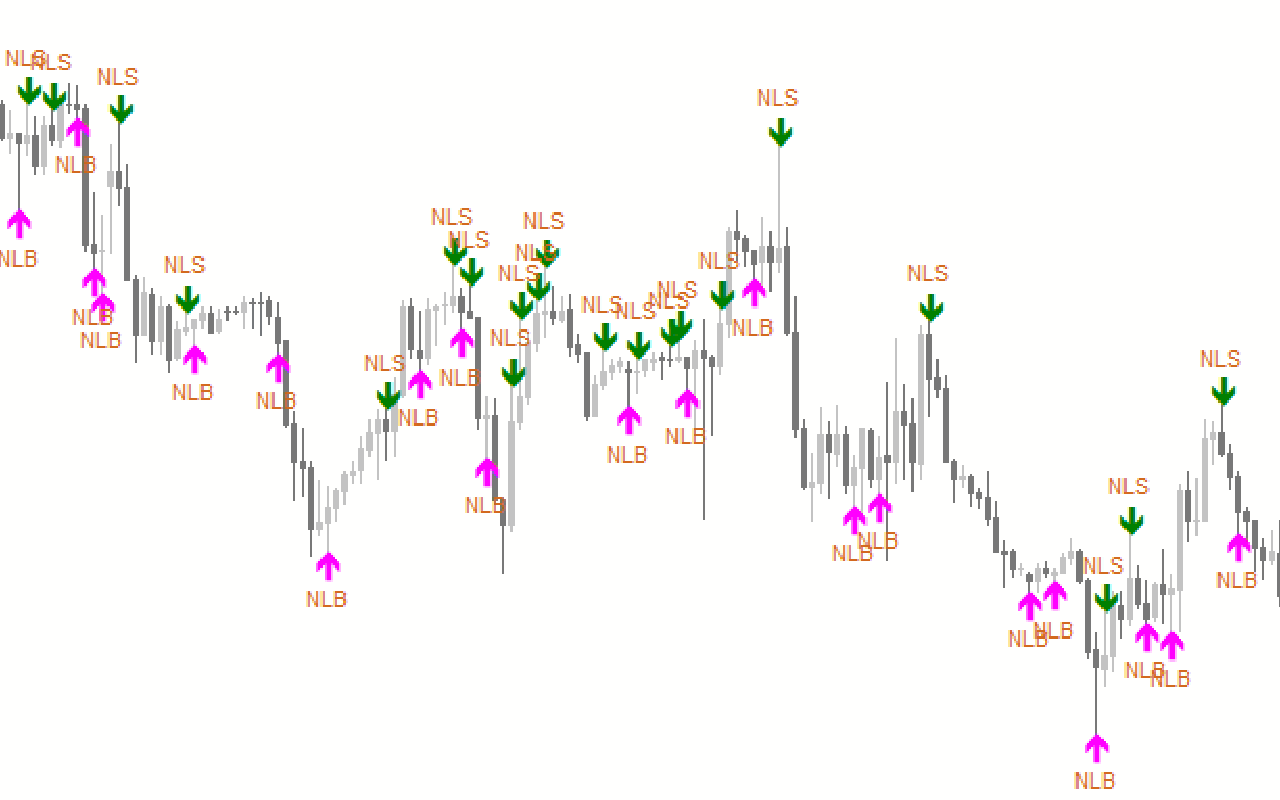
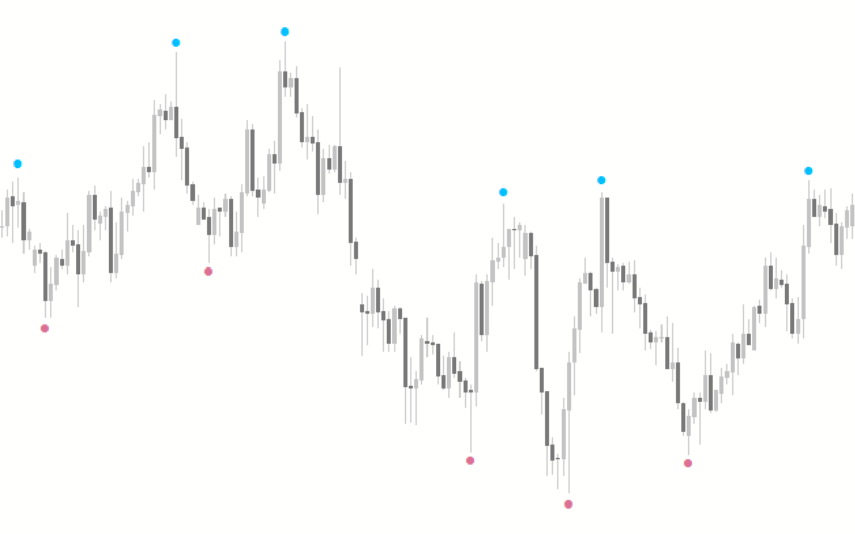
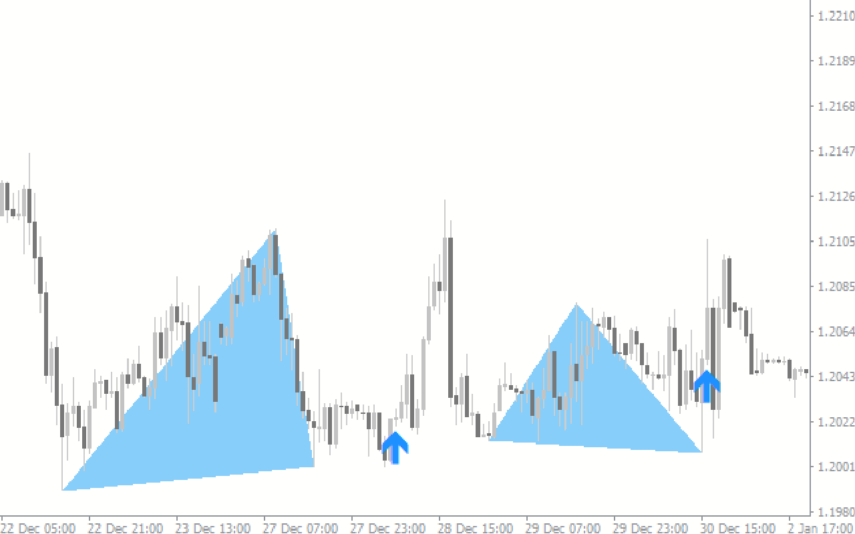
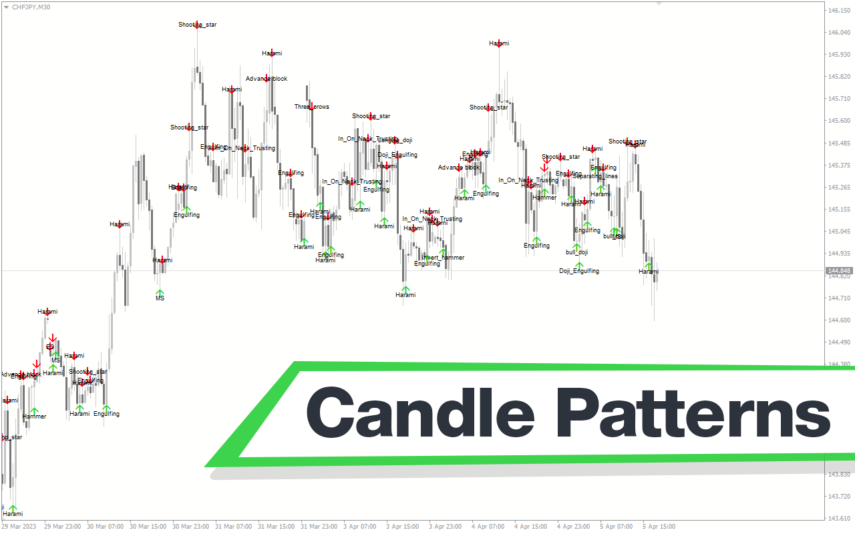
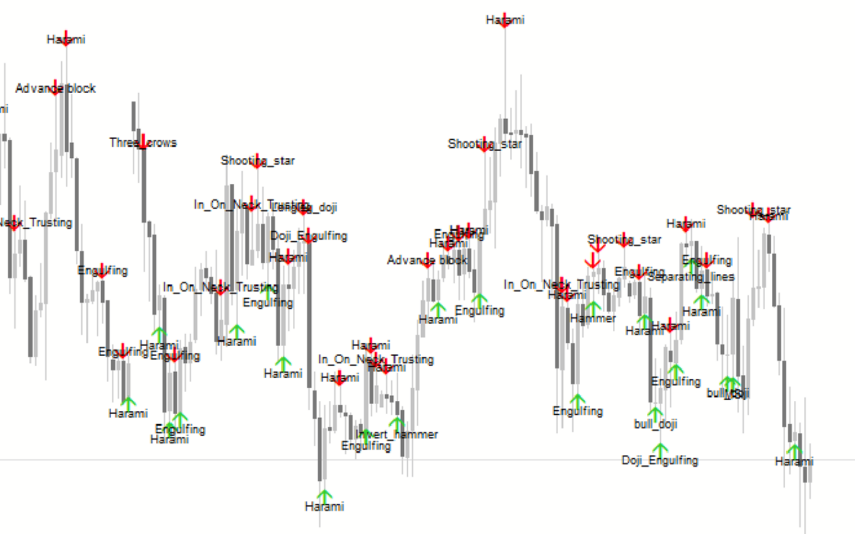
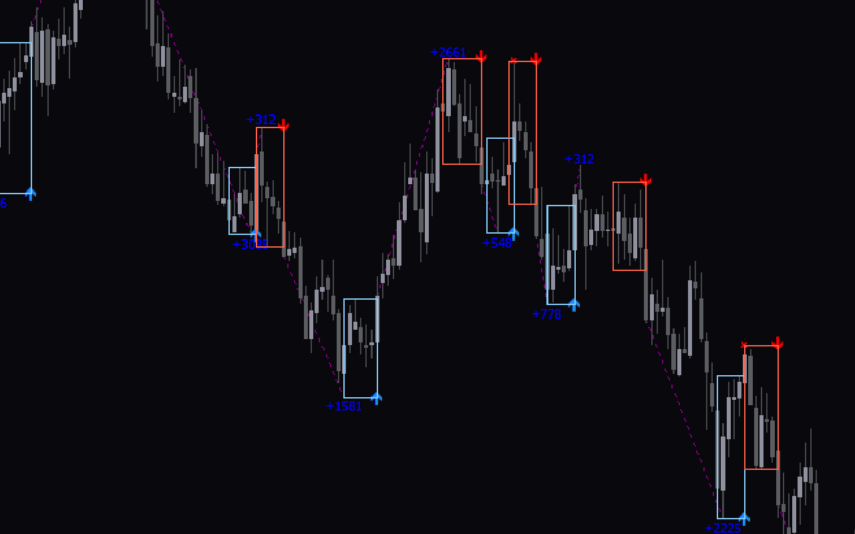
The My Price Action is a unique indicator highlighting notable candles that may signify a significant price change. The indicator displays varying values. It first marks the arrows above or below the candles. The color of the arrows also indicates specific price movements.
However, the arrow readings cannot be regarded as a standalone buy or sell signal. Before using the signals from the indicator, you should learn how to analyze them.
How the Indicator Can Benefit You
The shadows cast by the candles serve as the indicator’s primary foundation. If the shadow of the candle is higher or lower, the indicator displays a point. This helps your search for buying or selling pressure in a given situation.
For instance, if the underside has a long shadow, it indicates increased buying pressure. In a situation like this, you could take a long position.
Indicator Setting Description
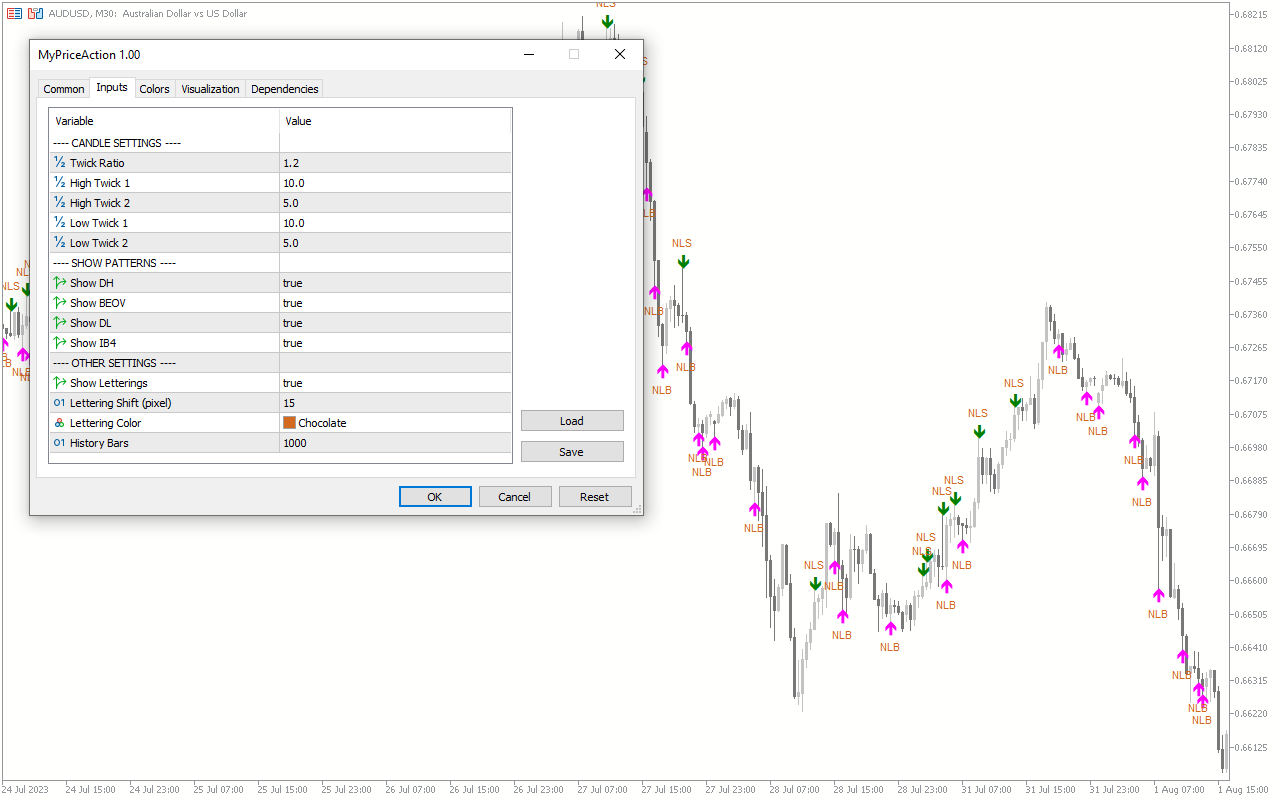
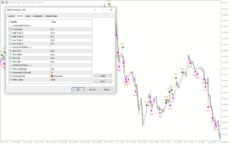
Twick_ratio: You can change the ratio of high to low.
Hightwick1: You can input twick height in pips.
HIghtwick2: You can input twick height in pips.
Lowtwick1: You can input twick low in pips.
Lowtwick2: You can input twick low in pips.
ShowDH: Enables/disables the display of the daily high on the candle.
Show BEOV: Enables/disables the display of the BEOV (like a pin bar) on the chart.
ShowDL: Enables/disables the display of the daily low on the chart.
ShowB4: Enables/disables the display of the new lower lows or higher lows.
Show lettering: Enables/disables the display of lettering.
Lettering shift: Allows you to change the lettering shift.
Lettering colour: Allows you to change the lettering colour.
History bars: Shows the number of bars the indicator uses for calculation


Reviews
There are no reviews yet.