
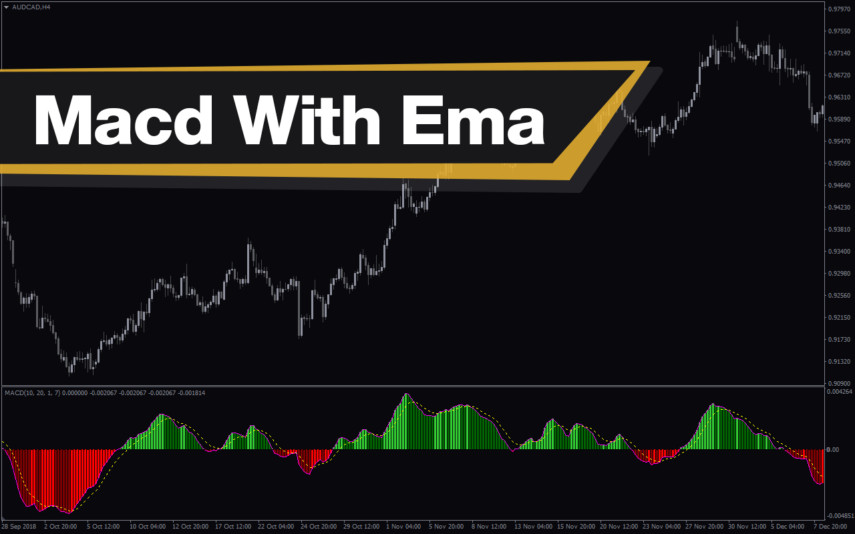
Macd With Ema
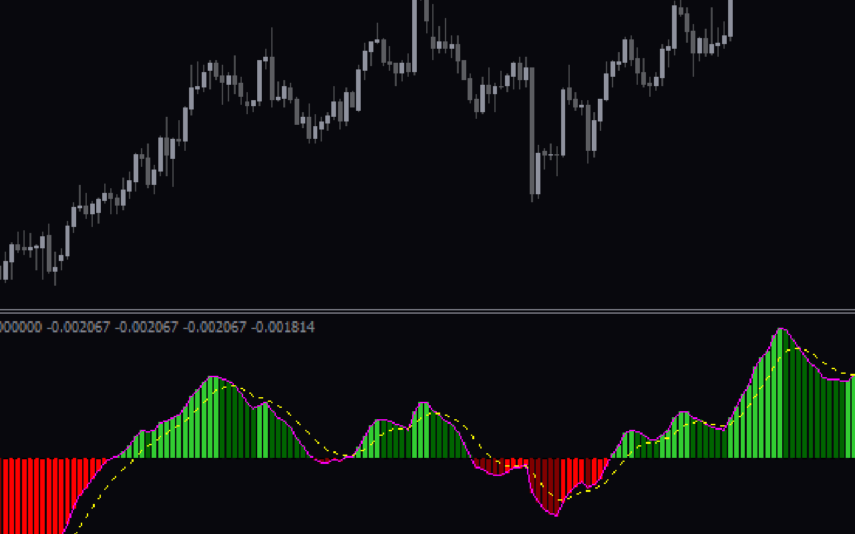
The MACD with EMA indicator is a popular and useful Forex indicator that can be used to help traders identify potential trading opportunities. This free indicator for MT4 is easy to use and can be quickly installed on any MT4 trading platform. The MACD with EMA indicator works by combining the Moving Average Convergence Divergence (MACD) indicator with the Exponential Moving Average (EMA) indicator to help identify potential trading opportunities. The MACD with EMA indicator uses the MACD line to identify the trend direction and then uses the EMA line to identify potential entry points. This indicator is popular among Forex traders because it can help identify potential trading opportunities quickly and easily.
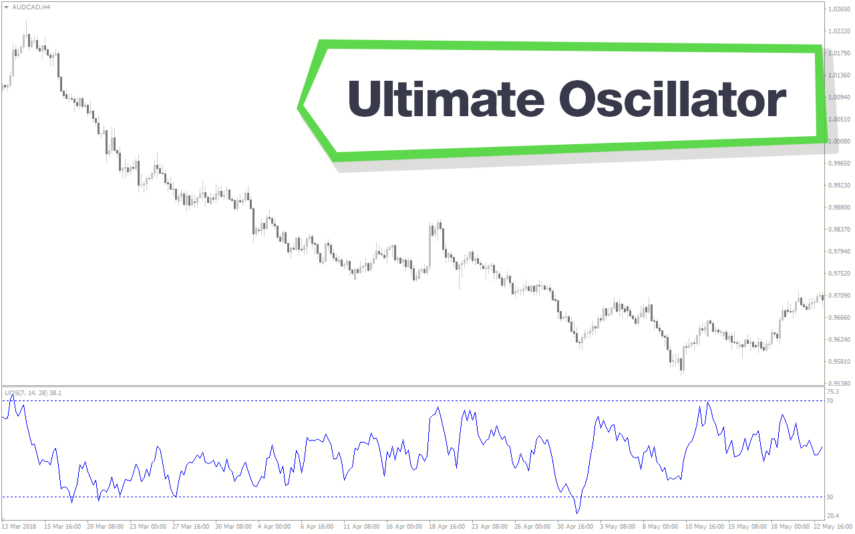
Ultimate Oscillator
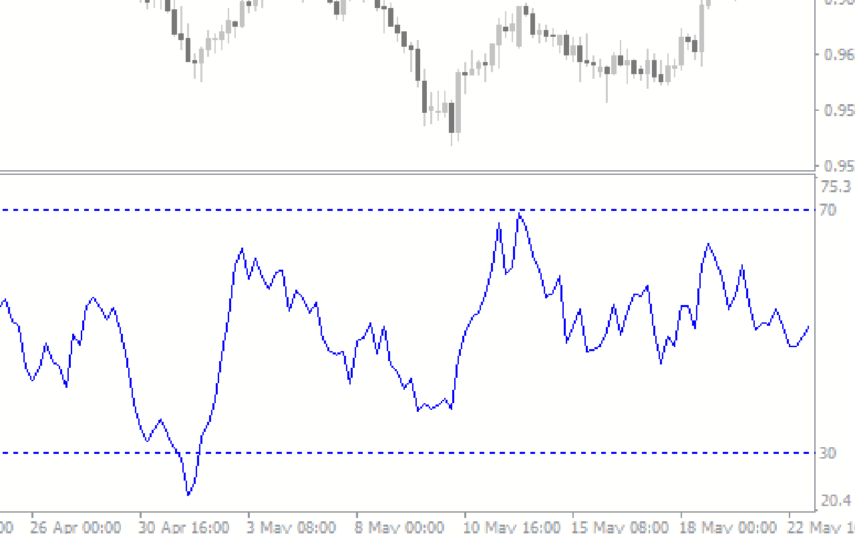
The Ultimate Oscillator Indicator is a popular and useful tool for Forex traders. It is a free indicator that can be used with the MT4 platform. The Ultimate Oscillator Indicator is designed to help traders identify short-term and long-term trends in the Forex market. It works by combining three different oscillators to measure the momentum of the market. By using the Ultimate Oscillator Indicator, traders can better identify potential trading opportunities and make more informed trading decisions.

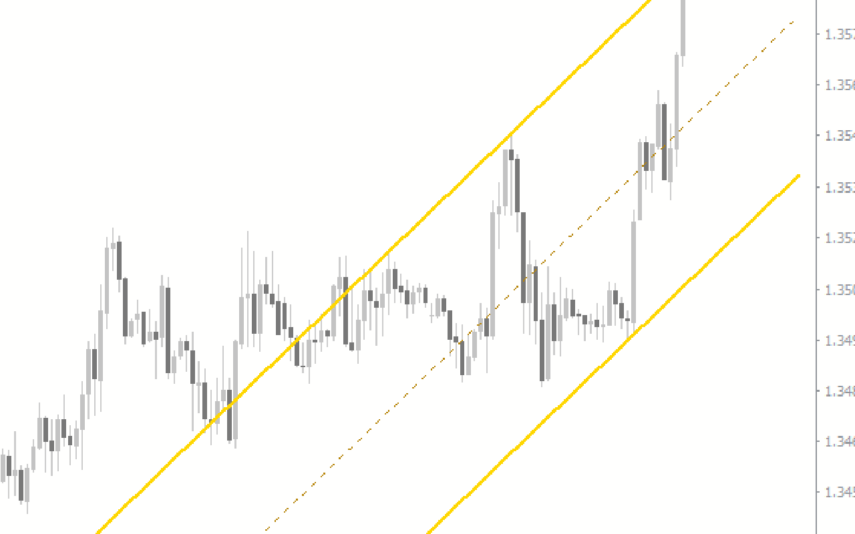
Shi Channel
The SHI Channel Forex Indicator is a popular and free MT4 indicator that is useful for traders of all levels. The indicator works by plotting two lines on a chart. The first line is a support line, which is plotted along the lowest points of the chart. The second line is a resistance line, which is plotted along the highest points of the chart. These two lines form a channel that can be used to identify trends in the market. The SHI Channel Indicator is a powerful tool that can be used to help traders make informed decisions and maximize their profits.
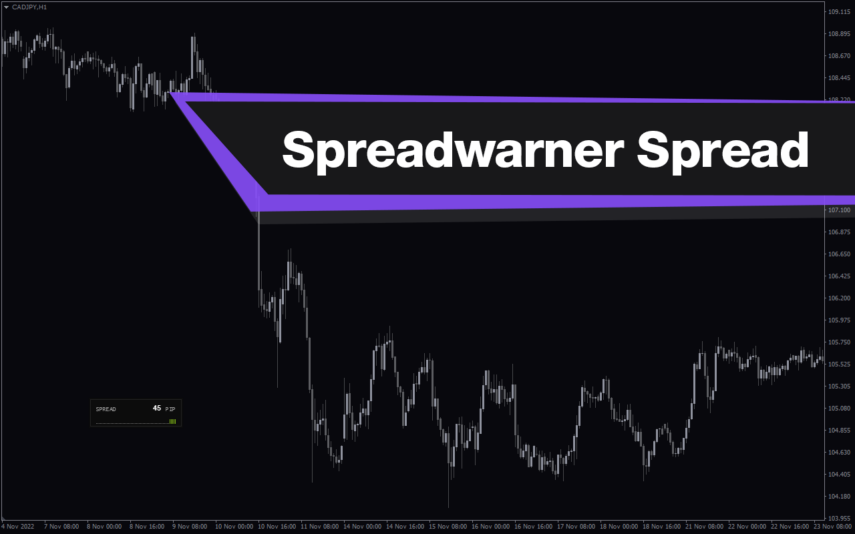
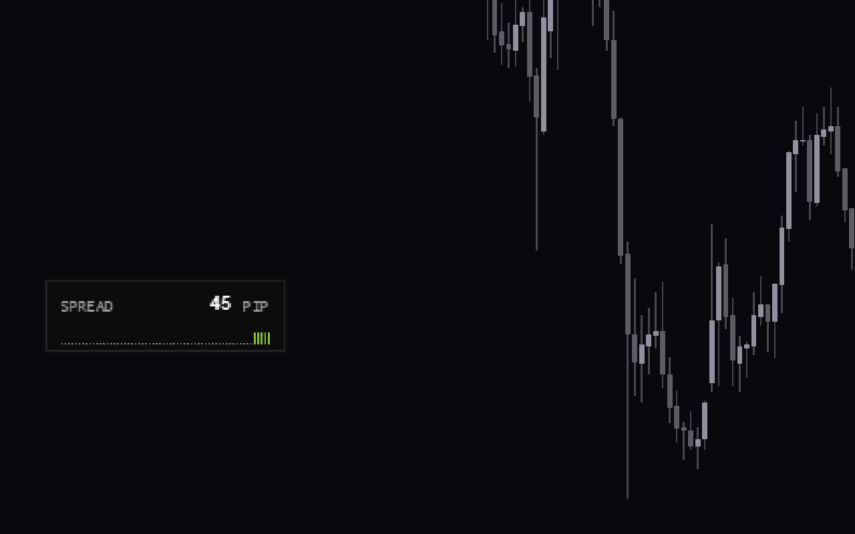
Spreadwarner Spread
The SpreadWarner Spread Indicator is a useful and popular free Forex indicator for MT4. The indicator works by showing the current spread of a currency pair in real-time, and also by providing a visual representation of the spread over the past 24 hours. This allows traders to quickly identify any potential changes in the spread and take advantage of them. With this indicator, traders can easily stay up-to-date on the current spread of their currency pairs and make informed decisions.
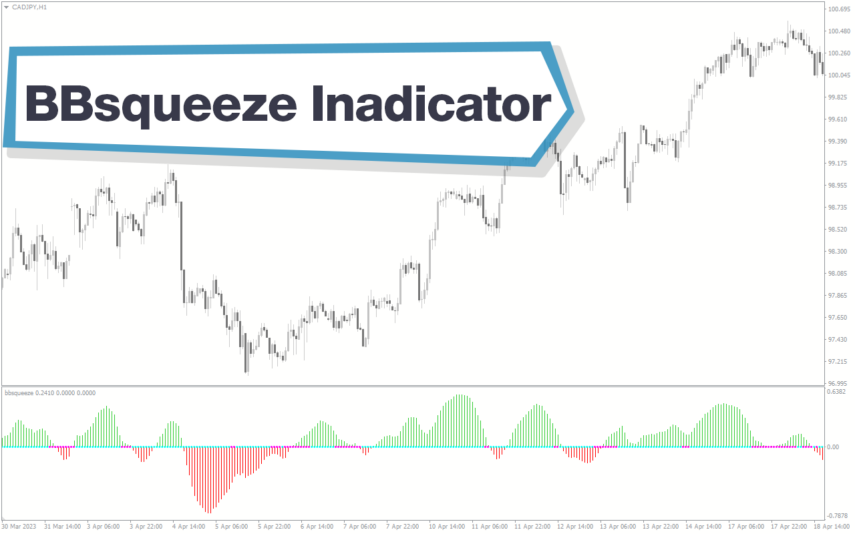
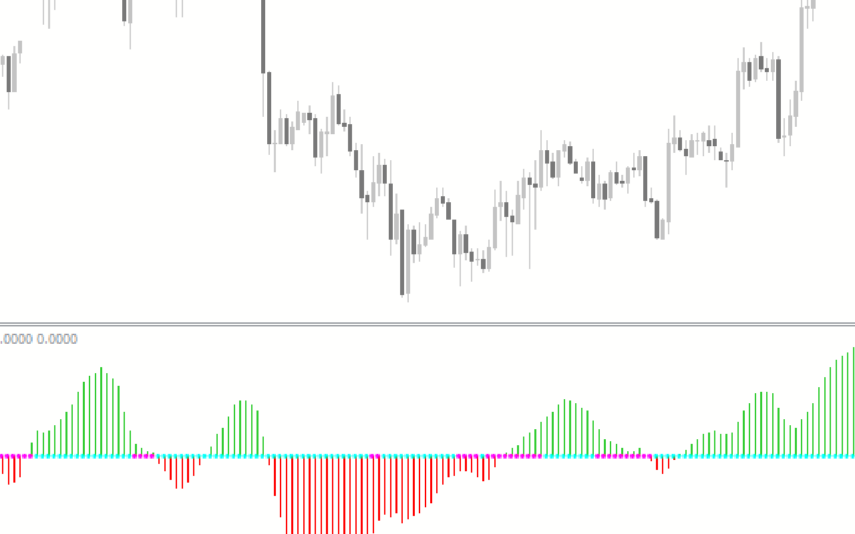
BBsqueeze
The BBSqueeze Indicator is a popular and free Forex indicator that is available for the MT4 platform. The indicator works by calculating the Bollinger Band Squeeze, which is a measure of volatility. When the Bollinger Bands are squeezed, it means that the market is consolidating and a breakout is likely to occur. The BBSqueeze Indicator uses this information to indicate potential breakouts and reversals. It is easy to use and can be used to identify entry and exit points in the market. It is a great tool for traders who want to take advantage of market volatility and capitalize on potential opportunities.
Inverse Fisher Transform Of RSI
The Inverse Fisher Transform of RSI indicator is a useful and popular free Forex indicator for MT4. This indicator is based on the Relative Strength Index (RSI) and is used to identify potential reversals in the price of a currency pair. The Inverse Fisher Transform of RSI indicator works by plotting a line that oscillates between -1 and +1 and can be used to identify potential reversals in price. It is a useful tool for traders looking to capitalize on short-term price movements and can be used in combination with other indicators to confirm trends and signal potential reversals.

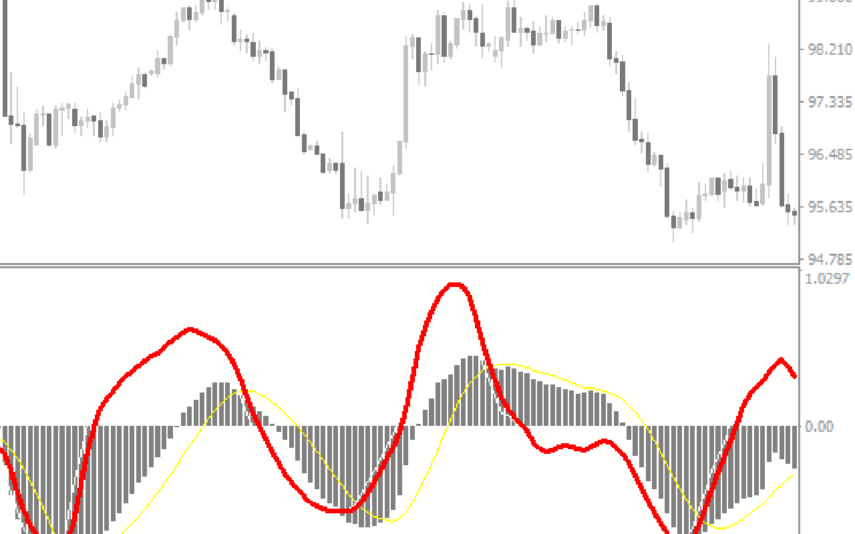
Macd Momentum
The MACD Momentum Indicator is a popular and free Forex indicator for MT4 that is useful for traders in determining momentum in the market. The MACD Momentum Indicator uses the MACD line and the signal line to determine whether the market is in a bullish or bearish trend. The MACD Momentum Indicator also uses a histogram to display the difference between the MACD line and the signal line. The MACD Momentum Indicator is useful for traders as it can help them identify potential trading opportunities in the Forex market.
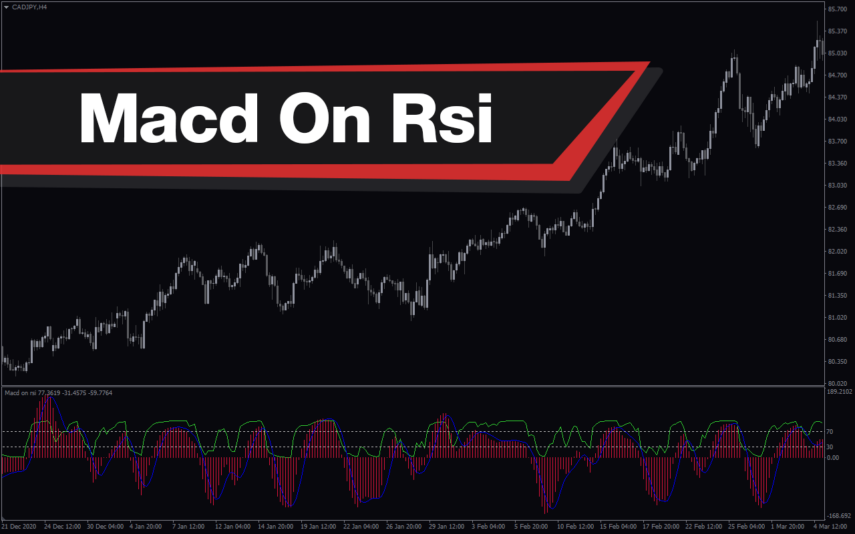
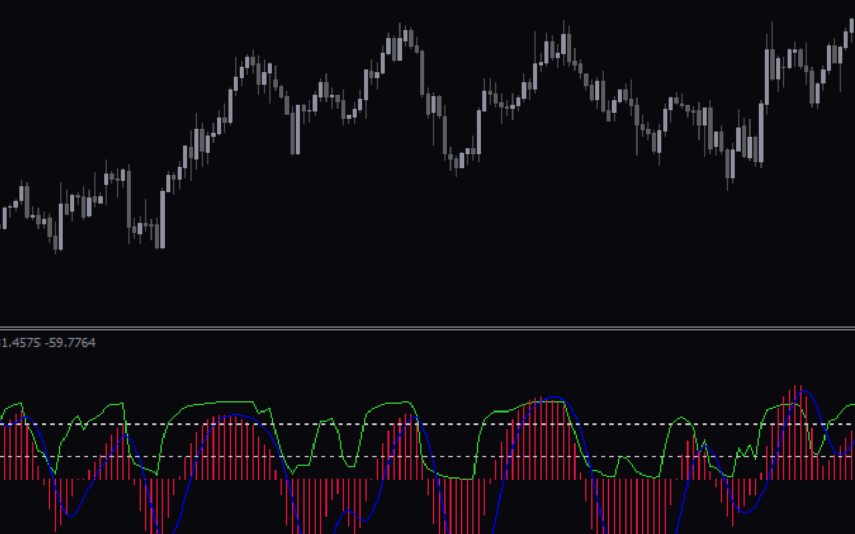
Macd On Rsi
The MACD on RSI indicator is a useful and popular free Forex indicator for MT4. It is used to identify potential trading opportunities by analyzing the divergence between the Moving Average Convergence Divergence (MACD) and Relative Strength Index (RSI) indicators. This can be used to identify potential entry and exit points in the market. The indicator is easy to use and is available for free on most MT4 trading platforms. The indicator is popular among traders because it helps them identify potential trading opportunities in the Forex market.
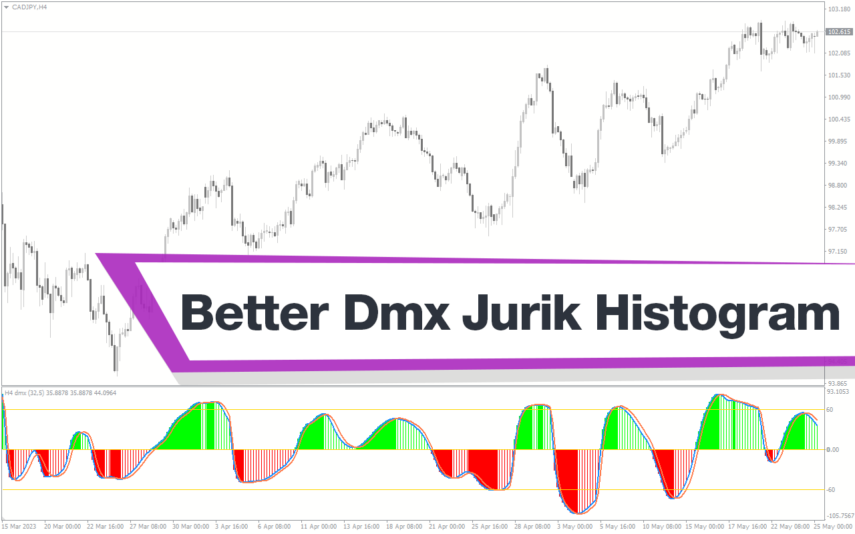
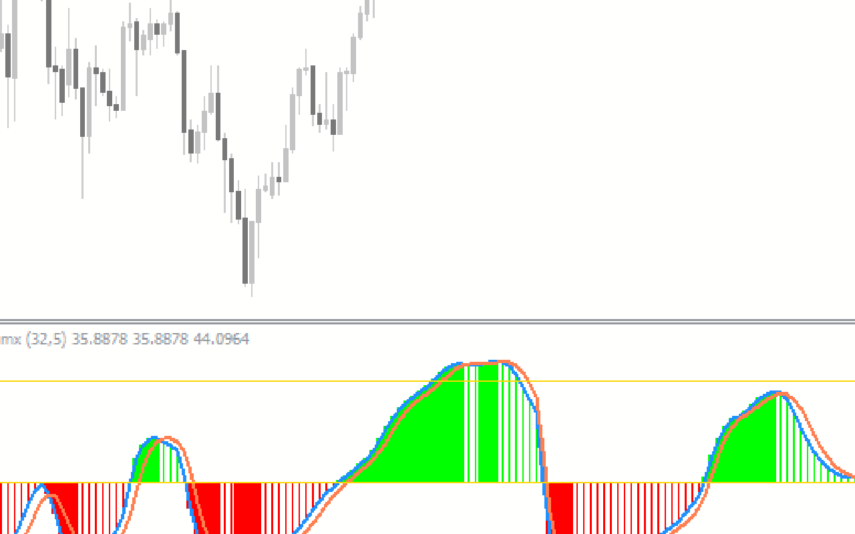
Better Dmx Jurik Histogram
The Better DMX Jurik Histogram Indicator is a useful and popular free Forex indicator for MT4. The indicator uses a combination of histogram and moving average to plot a signal line, and to identify possible trend reversals. It is easy to use, as it only requires traders to set the parameters, and to observe the signal line. It is also easy to install and use, making it a great choice for beginners.
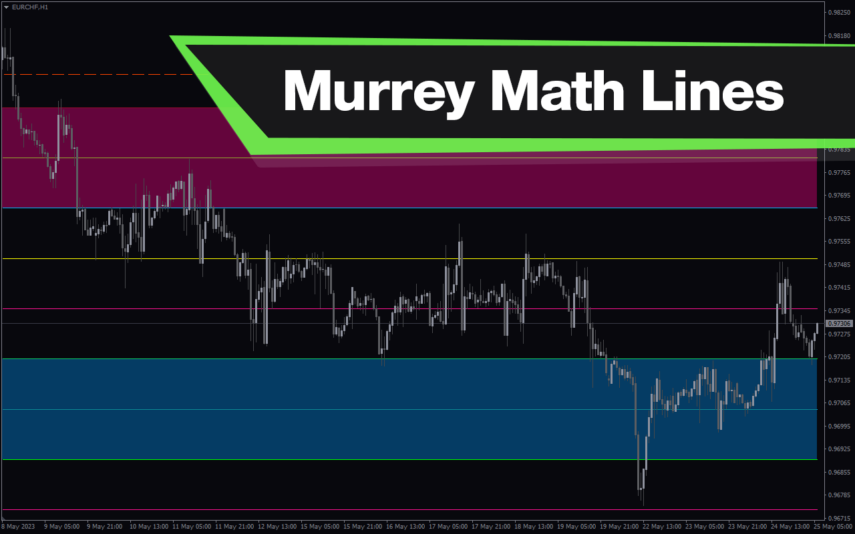
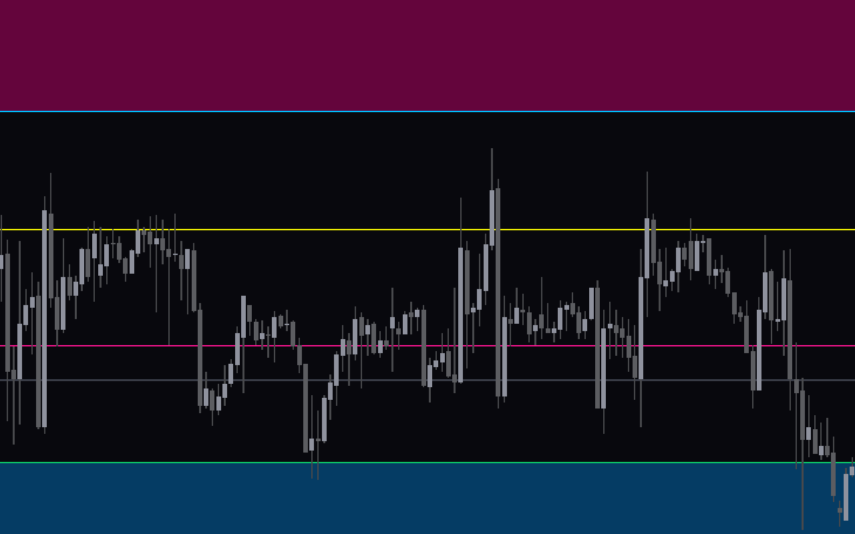
Murrey Math Lines
Murrey Math Lines is a popular and free Forex indicator for MT4 platforms. This indicator is based on the Murrey Math system, which uses a nine-line system to identify potential buying and selling opportunities. The Murrey Math Lines indicator plots nine lines on the chart, which are used to identify potential entry and exit points. is easy to use and provides a great way to identify potential buying and selling opportunities.
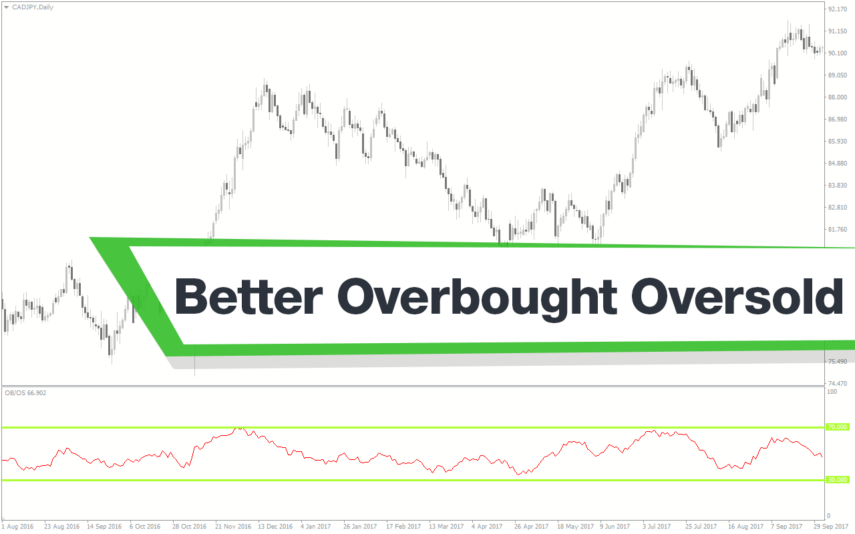

Better Overbought Oversold
The Better Overbought Oversold Indicator is a useful and popular free Forex indicator for MT4 that helps traders identify potential entry and exit points in the market. It works by plotting the current price against the overbought and oversold levels. When the price is above the overbought level, it indicates that the market is in an overbought state, and when the price is below the oversold level, it indicates that the market is in an oversold state. This indicator is easy to use and can be used to identify potential entry and exit points in the market.