Showing 3505–3516 of 4815 results
Rsi Accumulated Floating Level
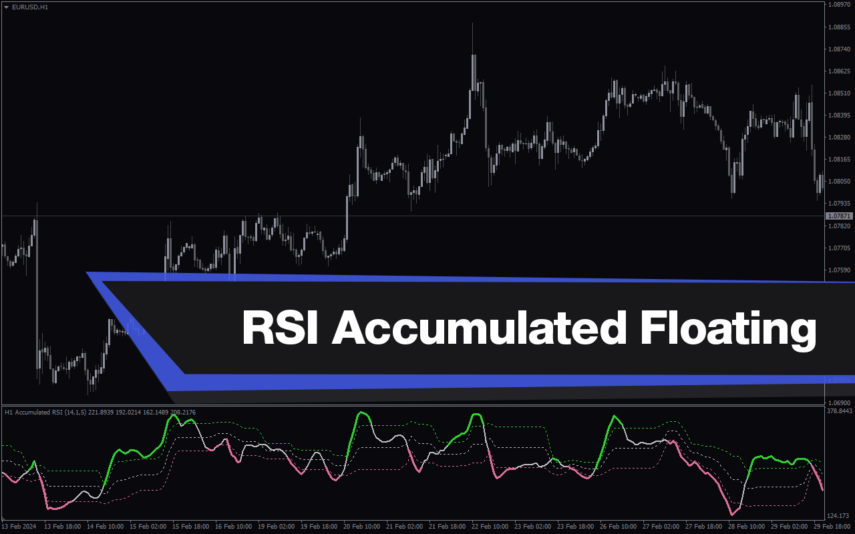
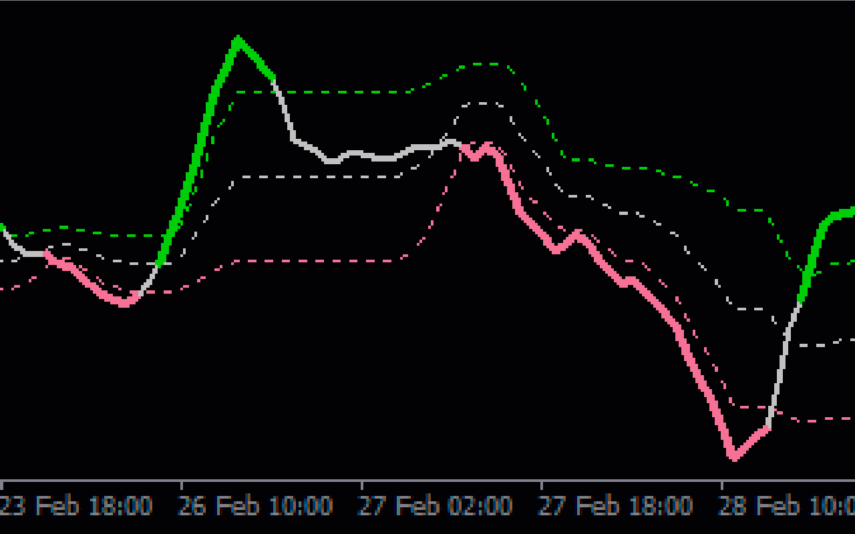
RSI Accumulated Floating Level is a popular and free forex indicator for MT4 that is useful for traders looking to gauge market sentiment. This indicator works by calculating the accumulation of RSI levels over a period of time, providing a more comprehensive view of market dynamics. Traders can use this indicator to identify potential entry and exit points in the forex market.
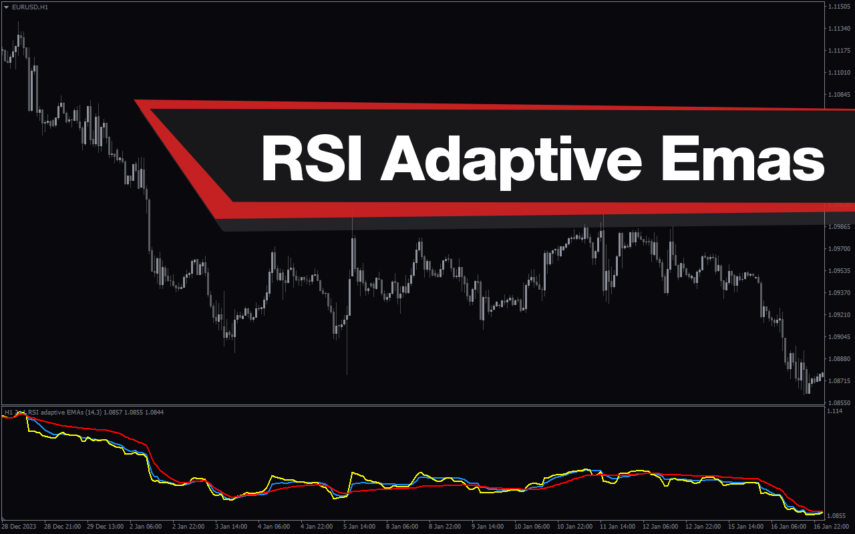
Rsi Adaptive Emas
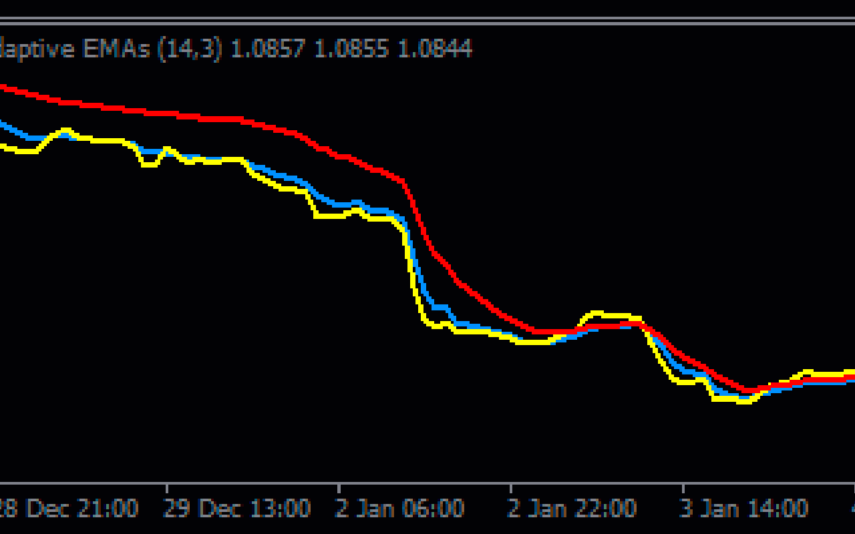
The 3 RSI Adaptive EMAs MTF Indicator is a useful forex indicator available for free on the MT4 platform. It combines the power of three popular indicators - RSI, Adaptive EMAs, and Multi-Time Frame analysis. This indicator helps traders identify potential entry and exit points in the forex market. By dynamically adjusting to market conditions, it provides accurate signals for making informed trading decisions. Beginners and experienced traders can benefit from the functionality of this indicator to enhance their forex trading strategies.
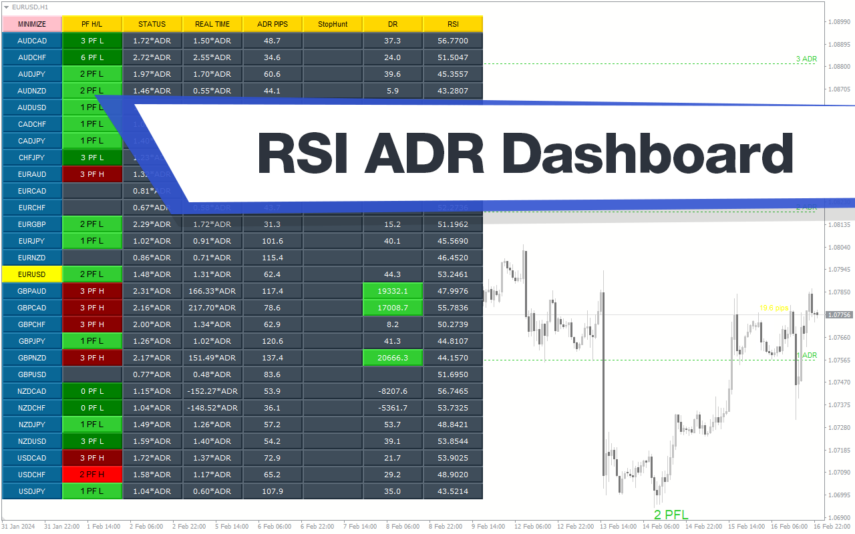
RSI ADR Dashboard
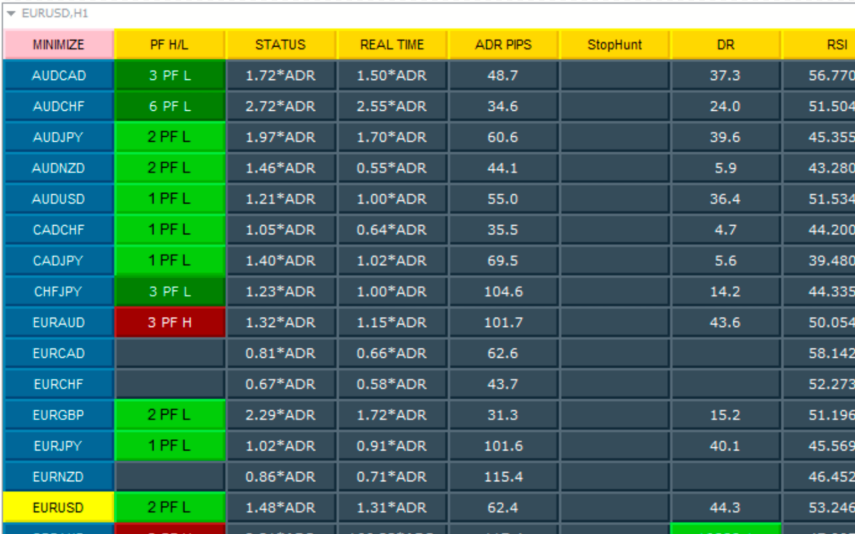
RSI ADR Dashboard Indicator for MT4 is a popular and useful forex tool that provides traders with valuable insights into market trends. This free indicator works by calculating the relative strength index and average daily range to help users make informed trading decisions. Simply install the indicator on your MT4 platform and use the dashboard to monitor multiple currency pairs simultaneously.
RSI Arrow
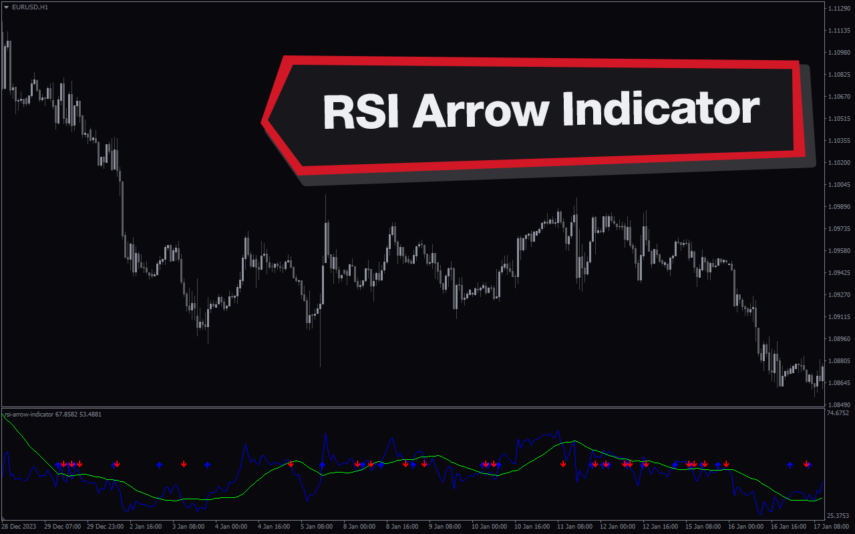
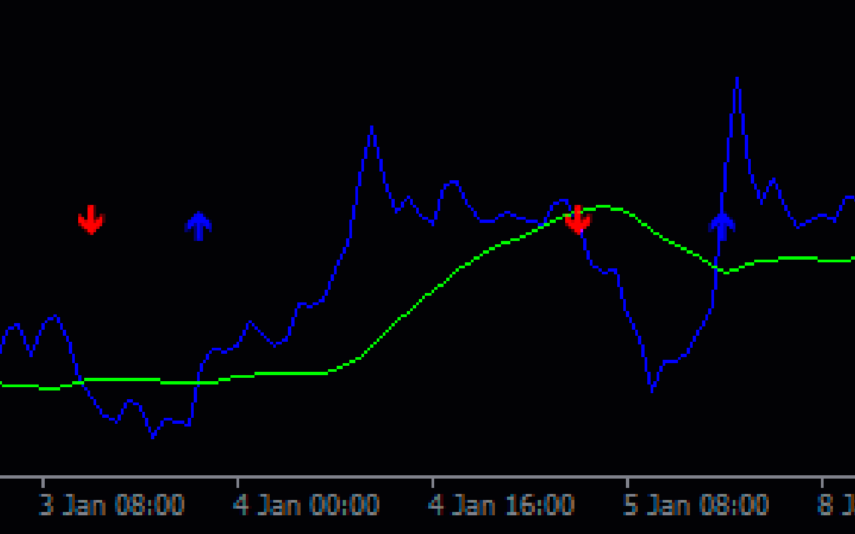
The RSI Arrow Indicator for MT4 is a popular and useful tool in forex trading, available for free. It works by showing potential entry and exit points on the chart based on the Relative Strength Index (RSI). Traders can use this indicator to identify overbought and oversold conditions in the market, helping them make more informed trading decisions.
RSI Bands
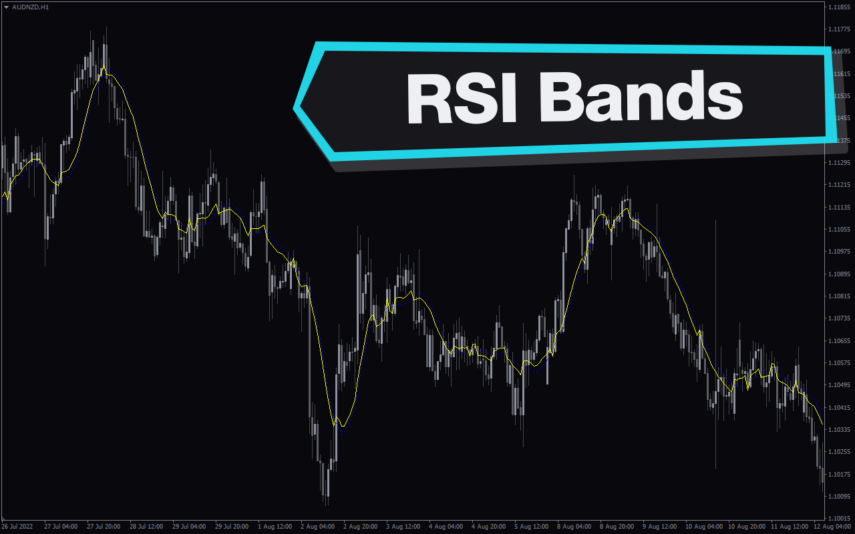
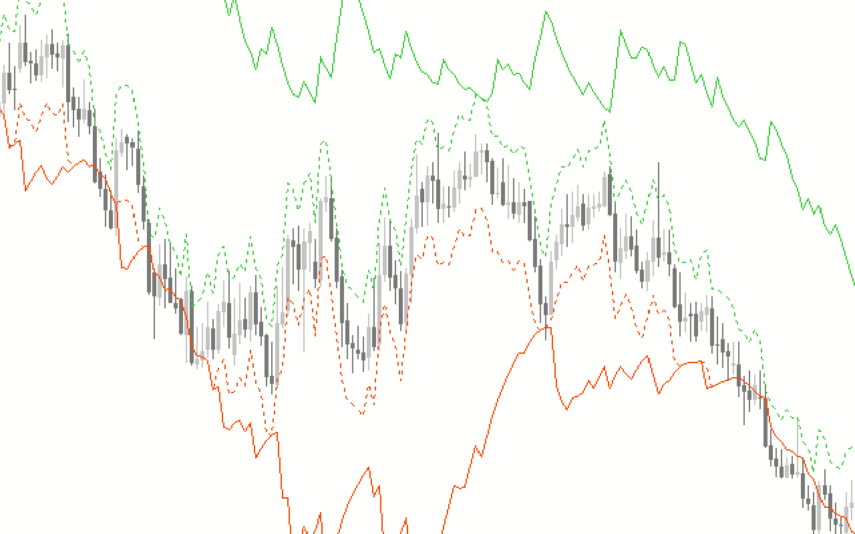
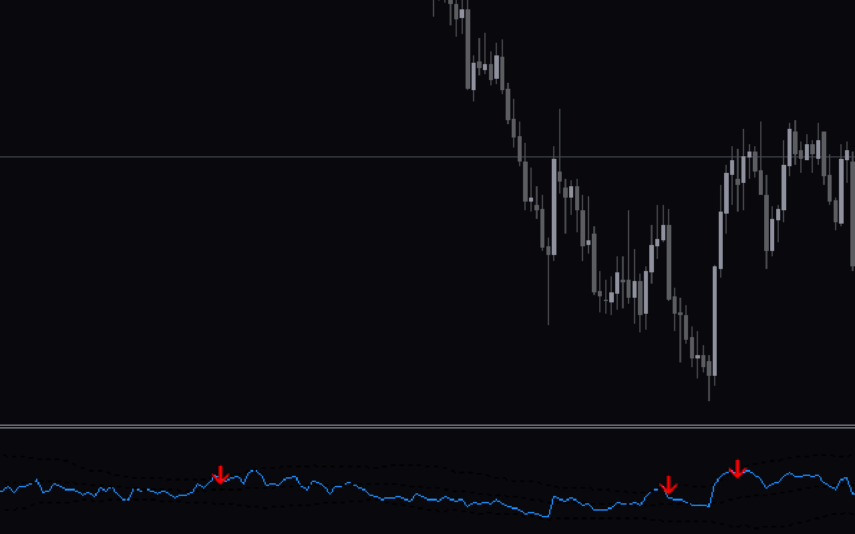
The RSI Bands Indicator is a popular and free forex indicator for the MT4 trading platform. The indicator works by plotting two lines on the chart. The upper line is drawn by adding a certain percentage of the RSI, while the lower line is drawn by subtracting the same percentage. This indicator is a great tool for any trader looking to make informed trading decisions.
RSI Bands
The RSI Bands Indicator MT5 is a useful and popular free Forex indicator. It is designed to help traders identify potential market trends and analyse price movements. The indicator uses the Relative Strength Index (RSI) to calculate the upper and lower bands, which are then used to determine potential entry and exit points. The indicator is available for free on the MT5 platform, making it a popular choice among Forex traders.
Rsi Bands Trading
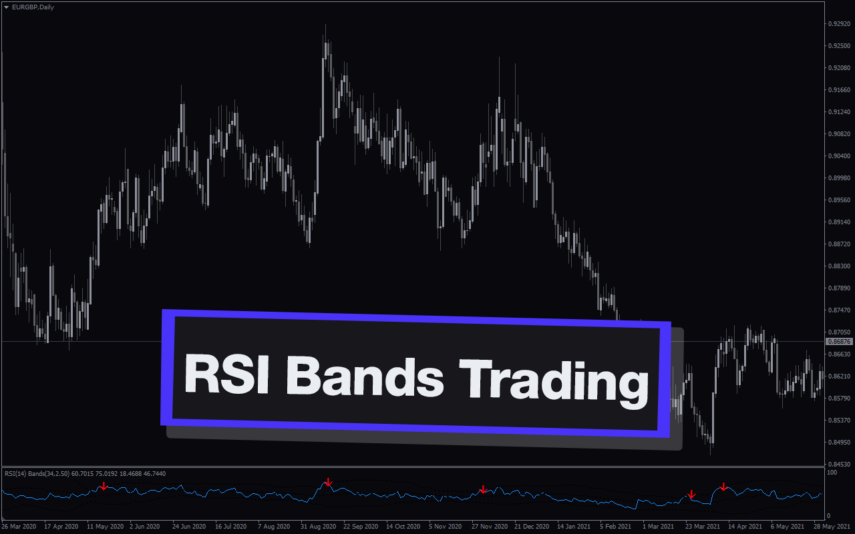
The RSI Bands Trading Indicator MT4 is a popular and free indicator for Forex traders. This indicator is useful for identifying overbought and oversold conditions in the market. The RSI Bands indicator is composed of two bands, one on the upper side and one on the lower side. The upper band is set at an RSI level of 70 and the lower band is set at an RSI level of 30. The RSI Bands indicator is easy to use and provides traders with a visual way to identify overbought and oversold conditions in the market.
Rsi Bar Chart V2
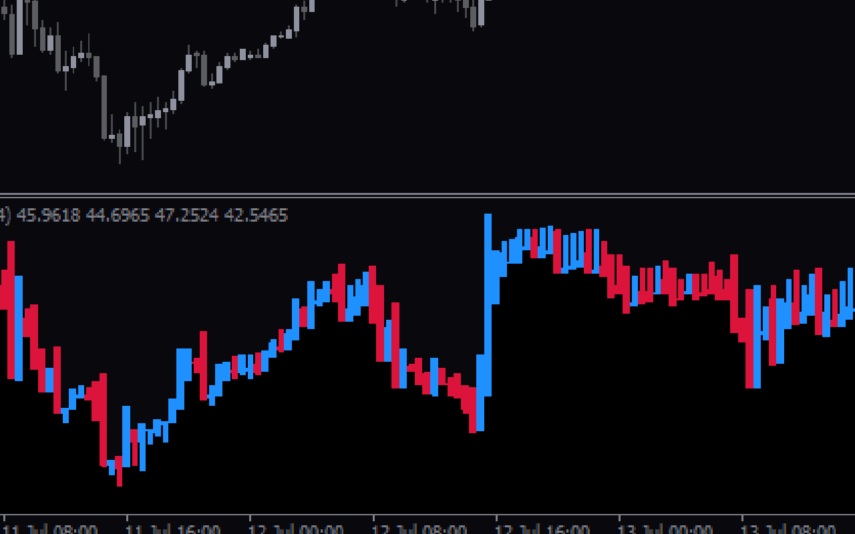
RSI Bar Chart V2 Indicator is a popular and useful forex indicator for MT4. It is free to use and helps traders identify overbought and oversold market conditions. The indicator works by plotting RSI values on a bar chart, making it easy to visually analyze the strength of a trend. Traders can use this indicator to make informed trading decisions based on RSI signals.
RSI Candles
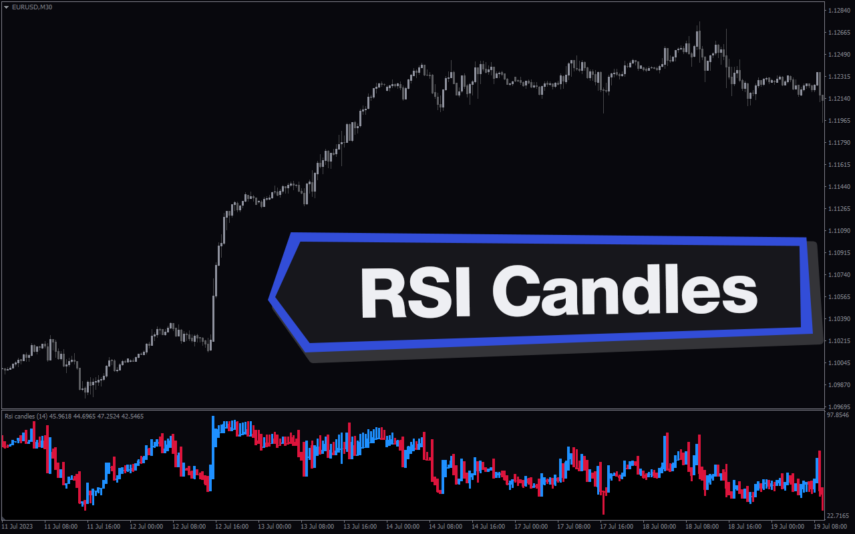
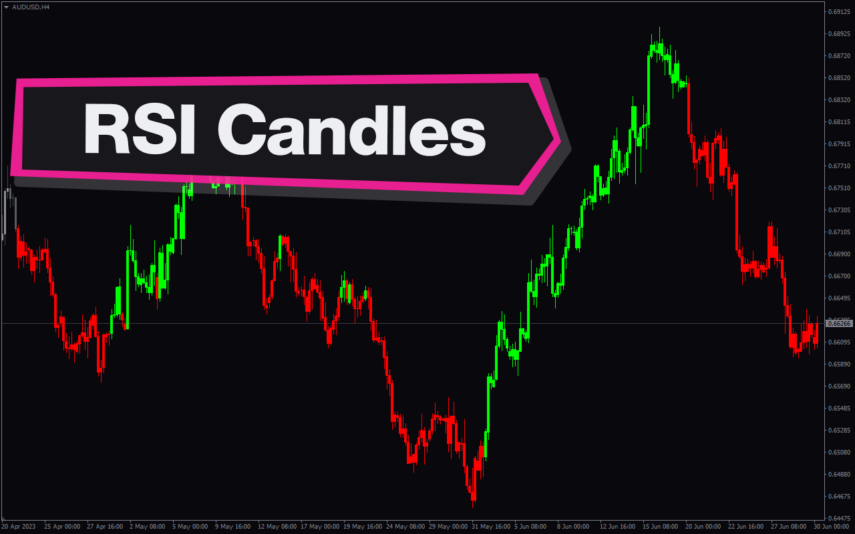
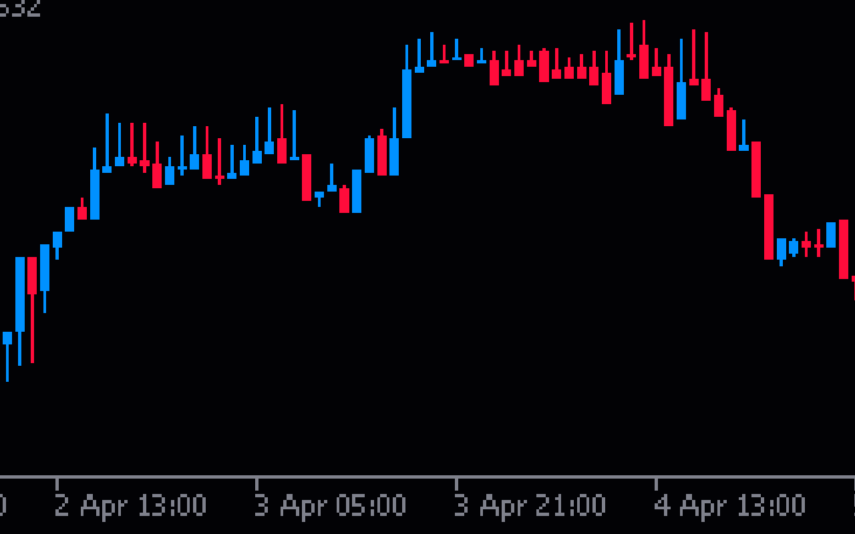
The RSI Candles Indicator is a useful and popular free MT4 Forex indicator. The indicator works by plotting a blue or red candle on the chart depending on the Relative Strength Index (RSI) values. If the RSI values are over 70, a red candle is plotted. If the RSI values are below 30, a blue candle is plotted. The RSI Candles Indicator is a great tool for any trader looking for an effective and free way to analyze the market.
RSI Candles
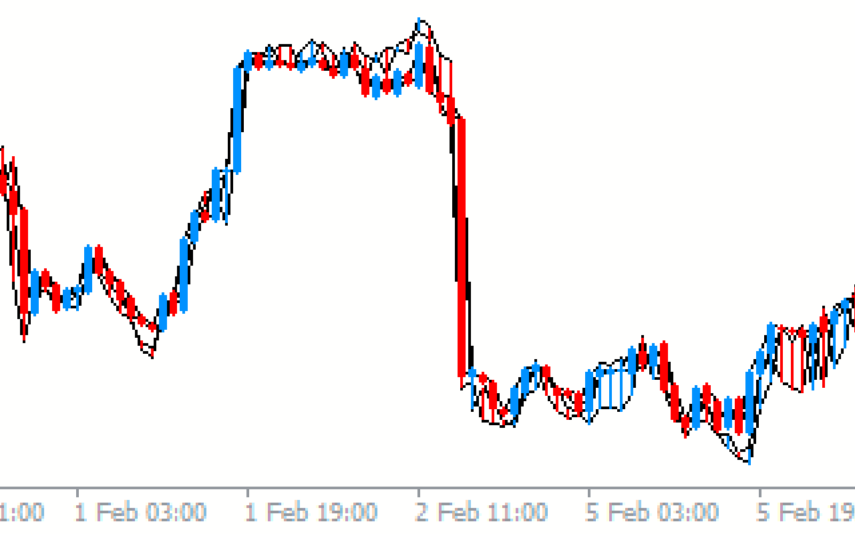
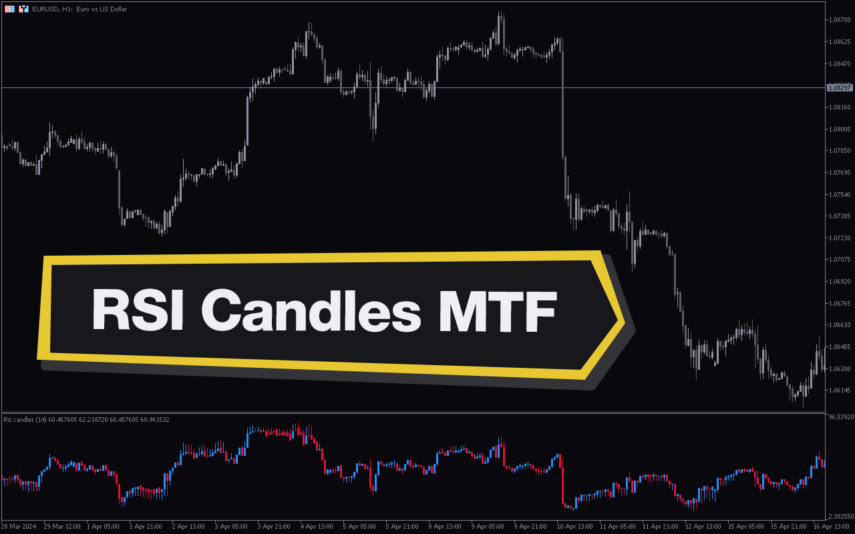
RSI Candles MTF Indicator for MT5 is a useful forex indicator that is popular among traders. It is free to use and provides multiple time frame analysis of RSI levels. This indicator works by overlaying RSI levels on candlesticks, allowing traders to quickly identify overbought or oversold conditions. Simply add the indicator to your chart and adjust the settings to suit your trading style.

