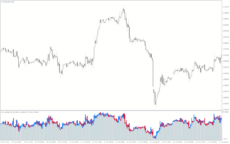
The RSI Candles Seffx indicator for MT4 is a custom indicator that displays the Relative Strength Index (RSI) value in candlesticks format. It is chart-friendly and works on multiple time frames, making it an ideal trading tool for trend analysis.
This version of the RSI indicator assists traders in interpreting the RSI signals more accurately. Unlike the traditional RSI on the MetaTrader platform, which oscillates as the price swings from zone to zone, the RSI candles give a better trend visualization.
Therefore, the RSI Candles Seffx indicator for MT4 is a beginner-friendly tool for efficient market analysis. So, traders can consider adding this indicator to their MT4 chart to interpret the RSI signals and market trend direction.
Features of the RSI Candles Seffx Indicator for MT4
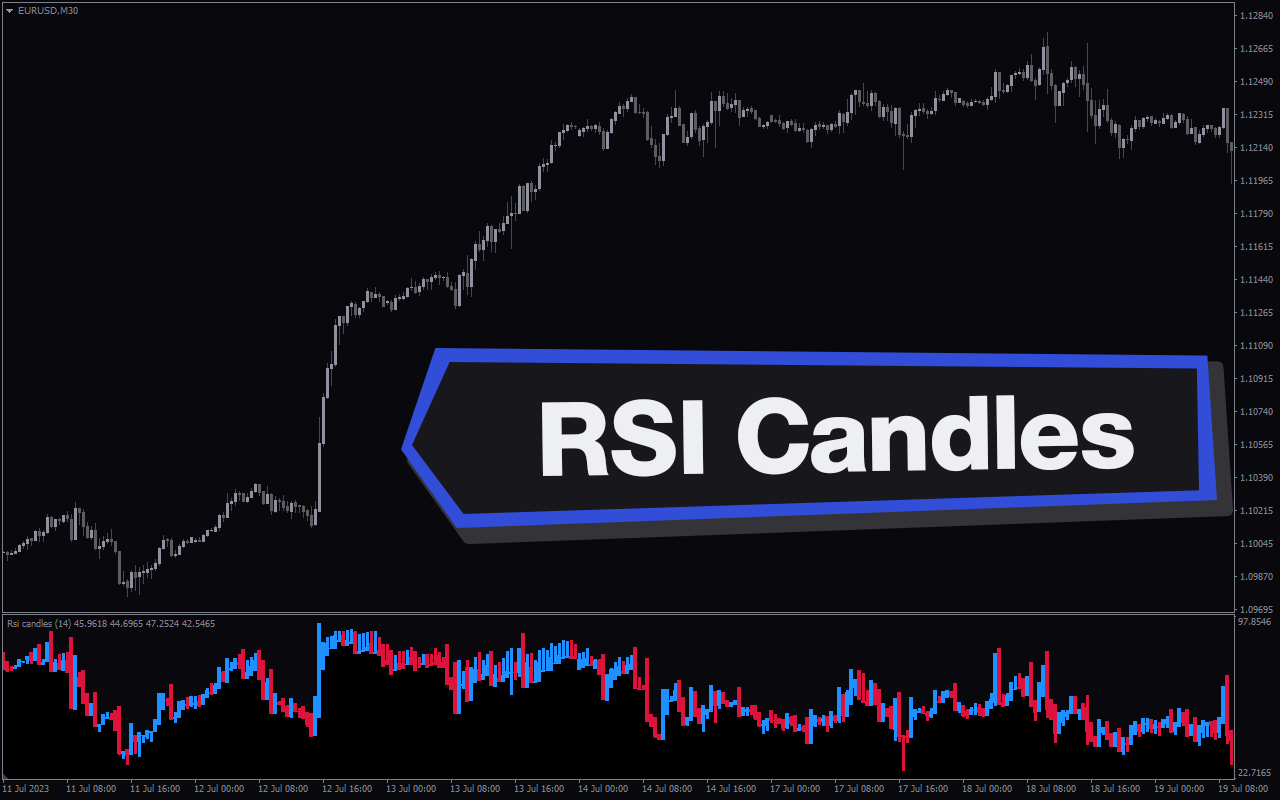
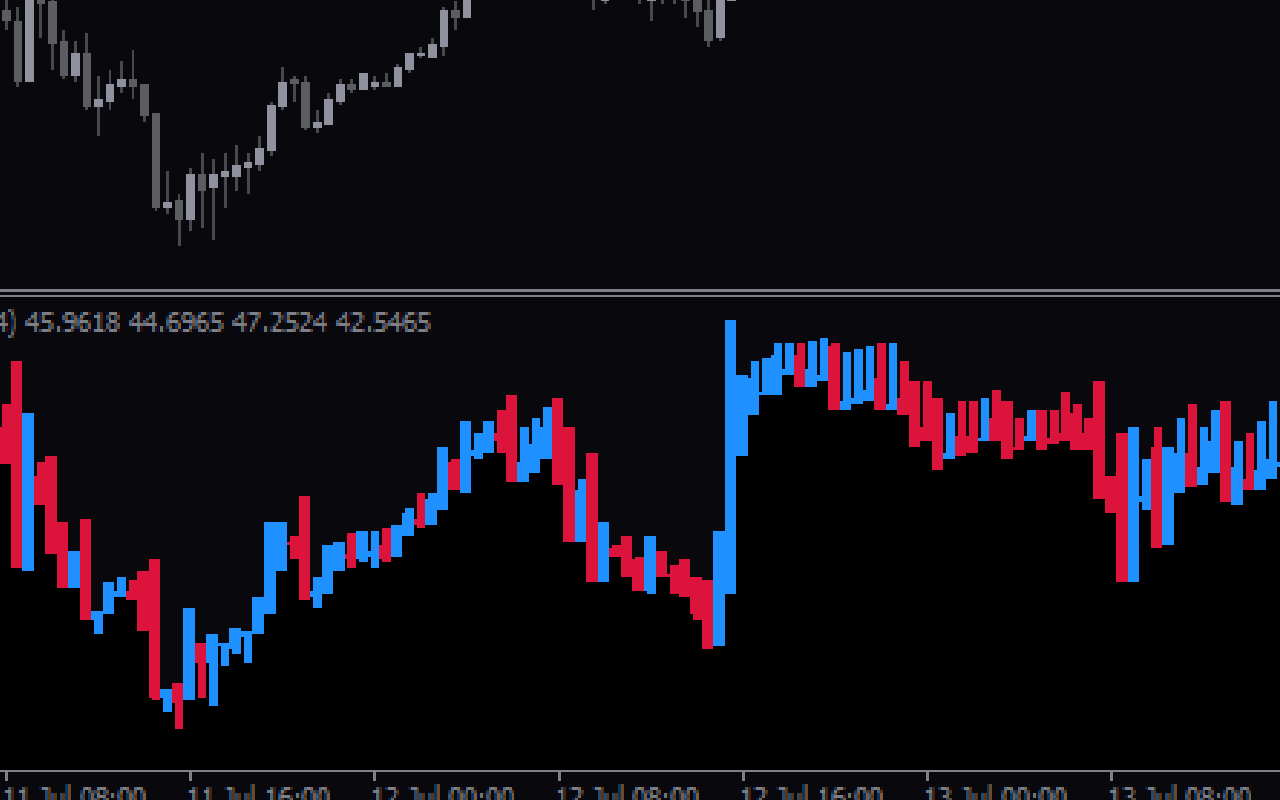
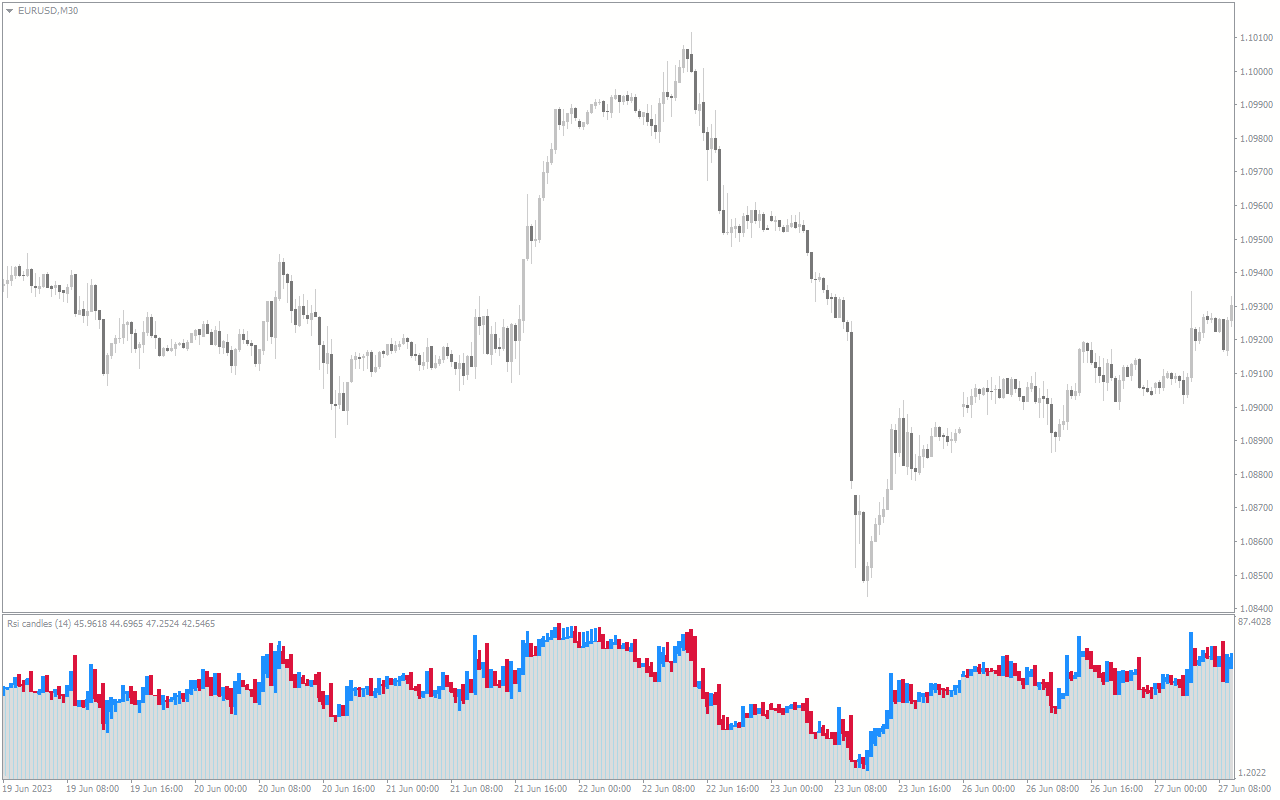
The indicator is designed to display the RSI values as a candlestick, below the main price chart. The candlesticks show the RSI value for High, Low, Open, and Close. Dodger-blue and crimson candlesticks are used to depict the RSI fluctuation. So, the dodger-blue candlestick indicates that the RSI value is rising, while the crimson-colored candles indicate a decline in the RSI value.
Furthermore, when the RSI candles indicator moves consistently to the upside, it suggests the market is in an uptrend. Conversely, a downtrend is when the RSI candles move consistently to the downside.
Benefits of Using the Indicator
- Enhances Trend Identification: As noted above, the indicator makes it easy for traders to identify the trend direction of an instrument. For instance, the market is bullish if the RSI candles move consistently upward.
- Trading Confluence: The indicator can be used as a supporting tool with price action/other technical analysis indicators for improved trading decisions.
Indicator Settings Description
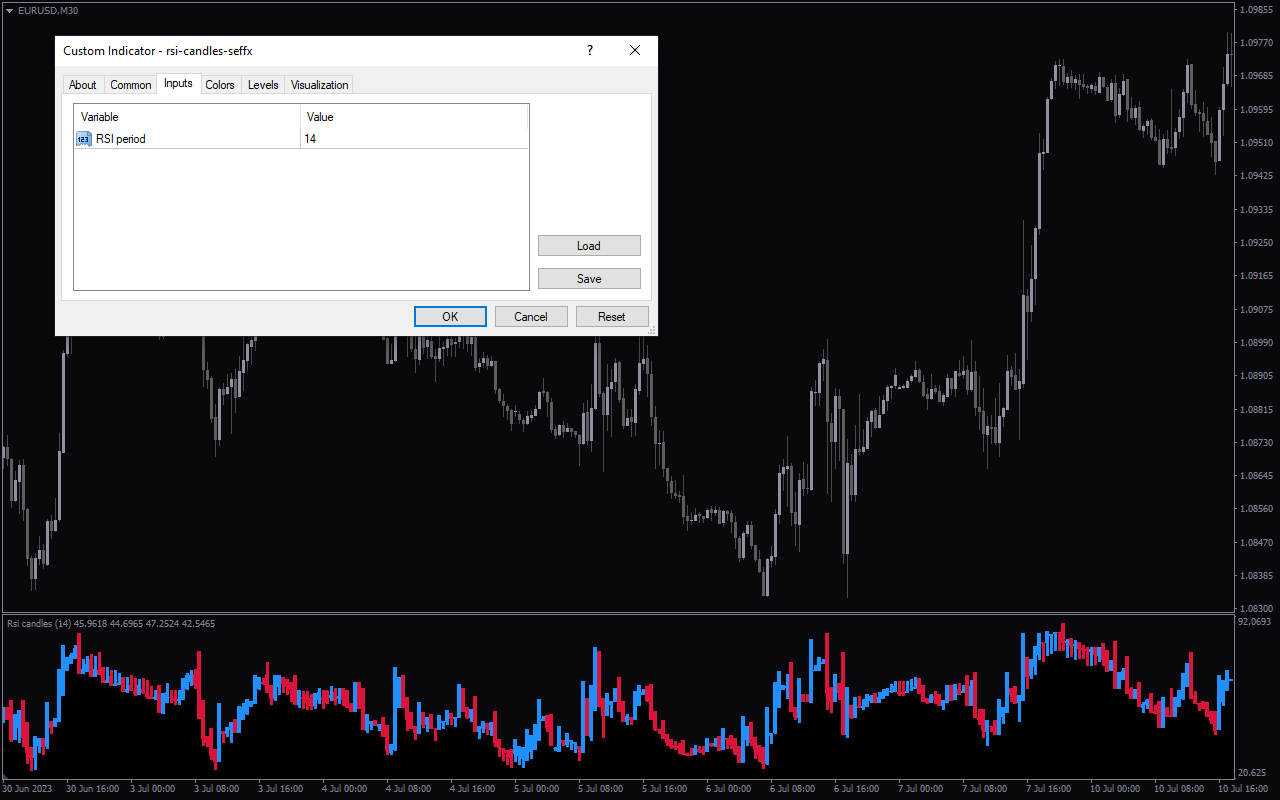
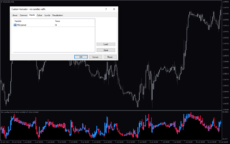
The indicator comes with the following customizable settings:
RSI period: Determines the RSI period for trend analysis.

Reviews
There are no reviews yet.